Daily Forex Market Preview, 28/04/2016
The markets have been volatile over the past few hours with major central bank decisions. The Fed left rates unchanged and so did the RBNZ and the BoJ. While the yen is strengthening currently, there is scope for a pullback in the near term. Meanwhile, EURUSD could be looking to target the 1.14 handle while gold, aiming for 1250 is in the process of making a head and shoulders pattern on the 4-hour chart.
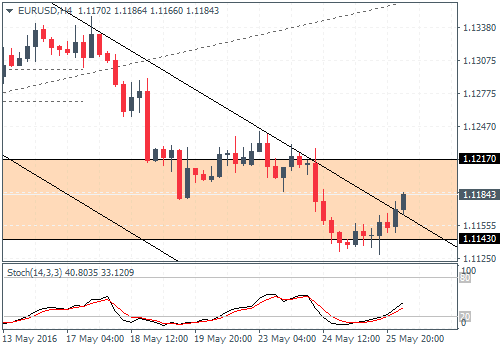
EURUSD Daily Analysis
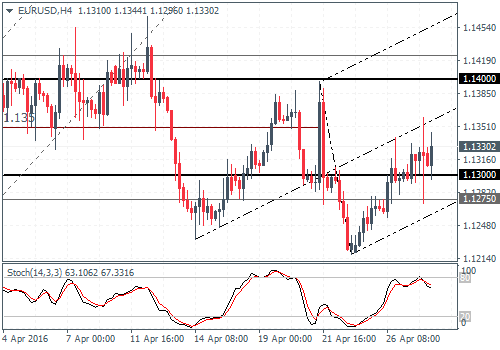
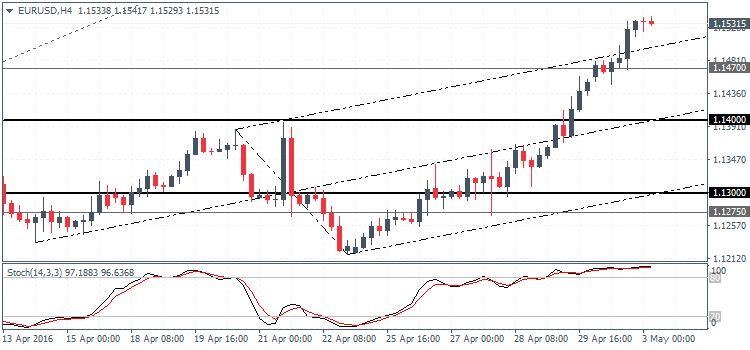
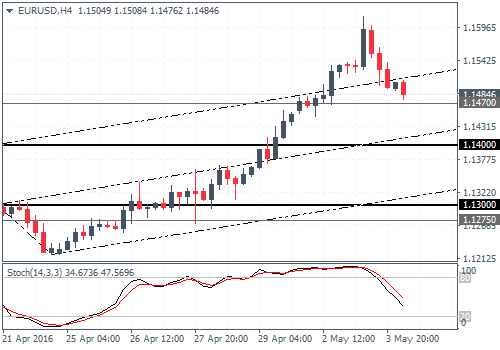
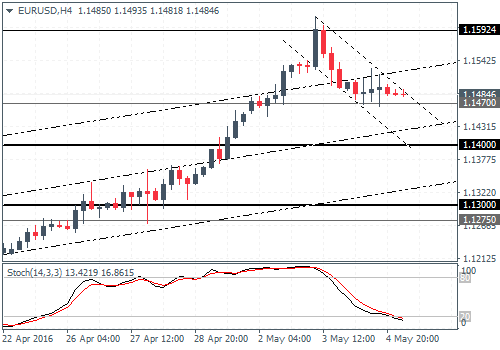
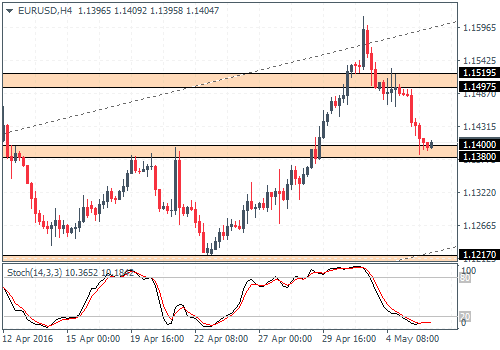
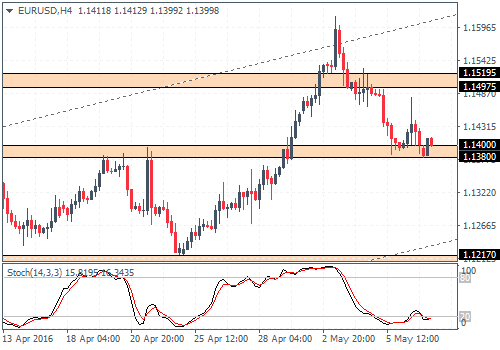
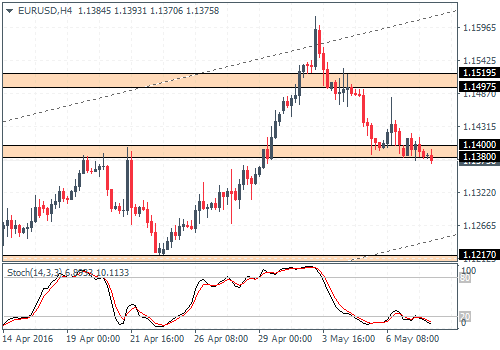
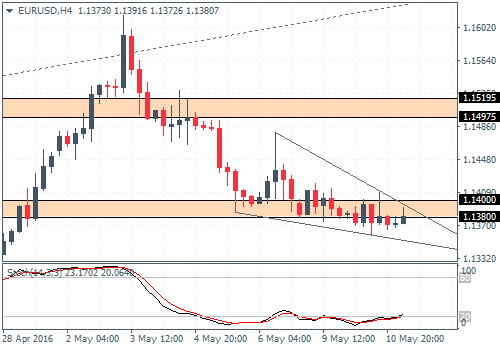
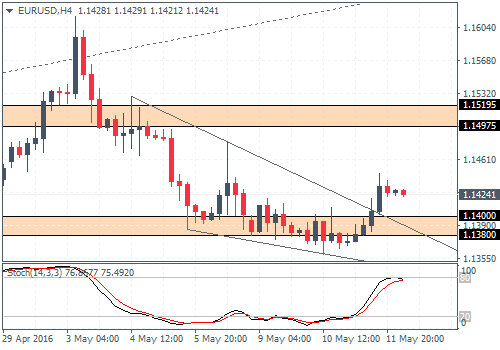
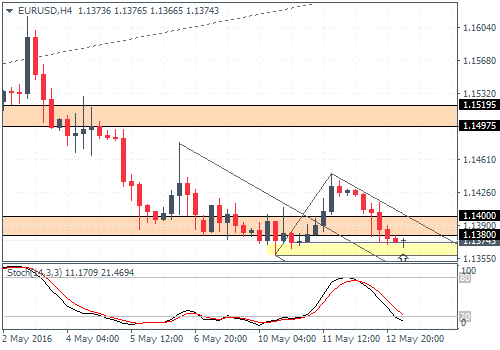
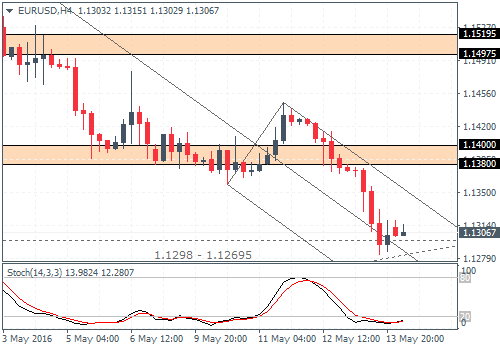
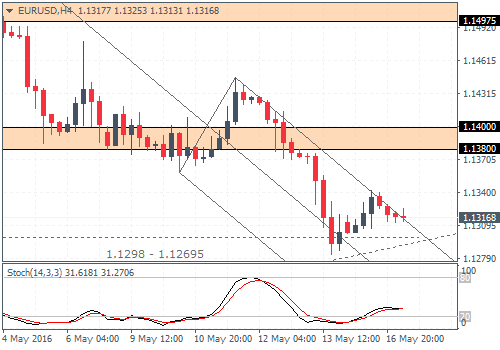
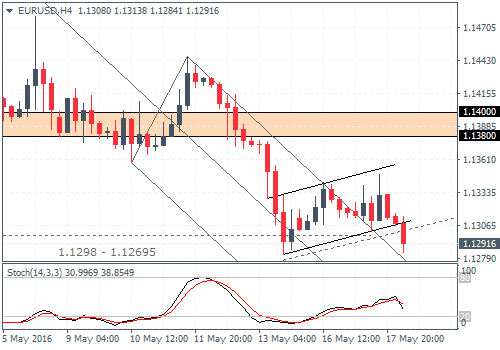
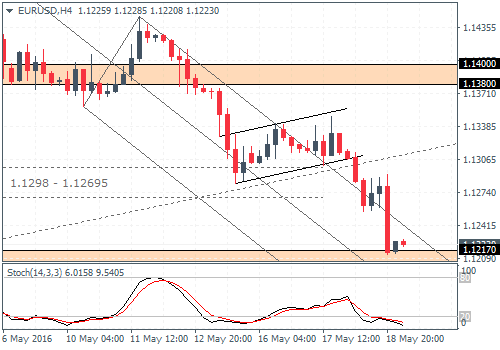
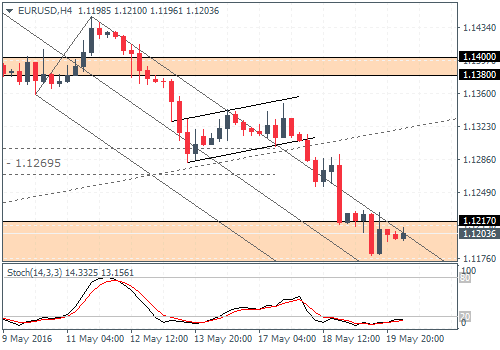
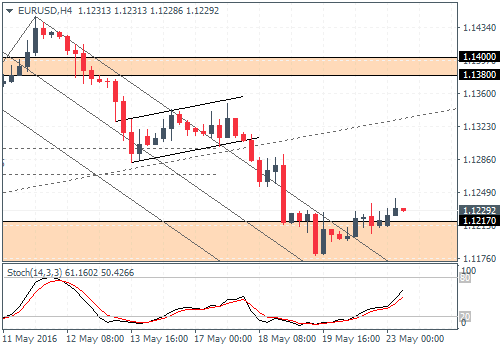
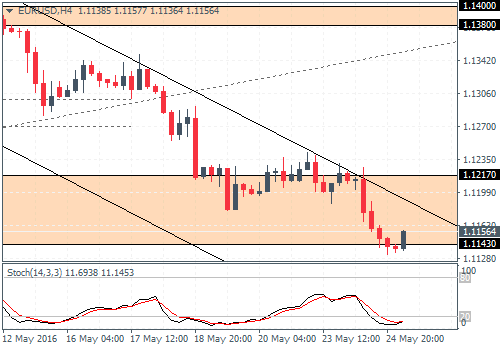
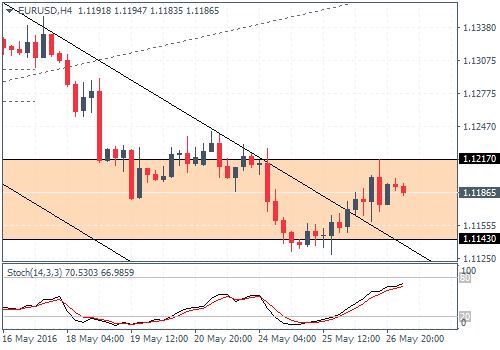
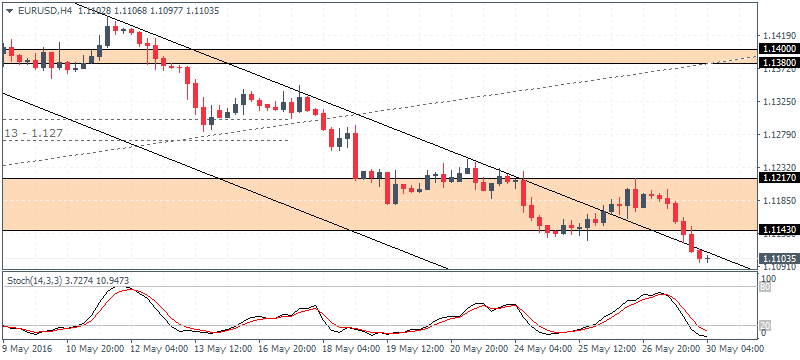
EURUSD (1.13): EURUSD closed bullish yesterday marking the third day of bullish close. Price action indicates the potential for further upside in the euro over the near term, but the medium-long term forecasts show the bearish bias staying intact. Support is identified near 1.130 - 1.1275, which could see the euro dip and establish support at this level. In such a scenario, EURUSD could potentially test 1.425 - 1.140 which is a strong resistance level. As long as this resistance holds, EURUSD could potentially start looking weaker with 1.13 and 1.12 coming in as the near-term targets.
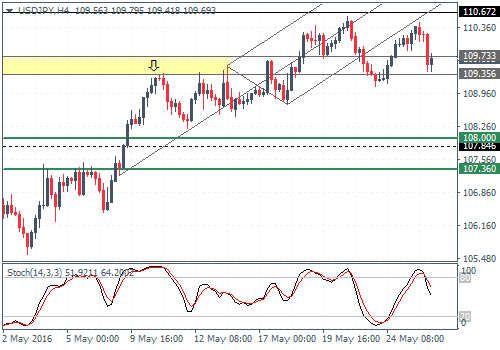
USDJPY Daily Analysis
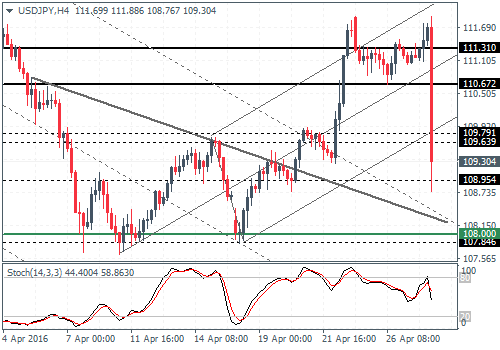
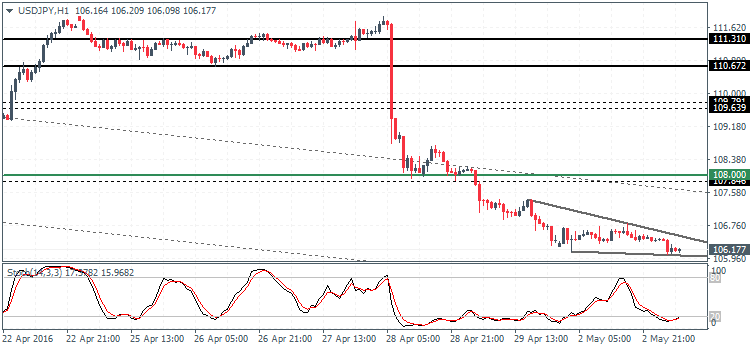
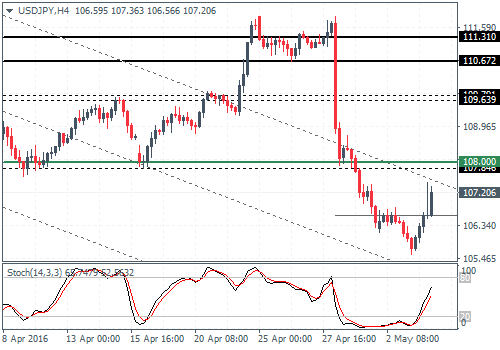
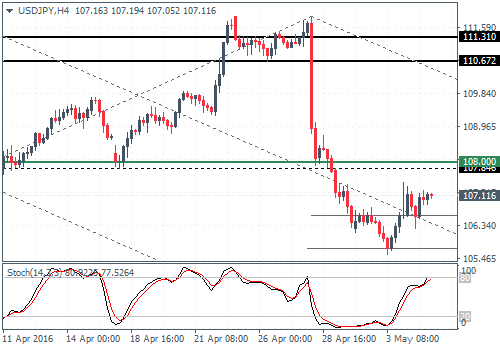
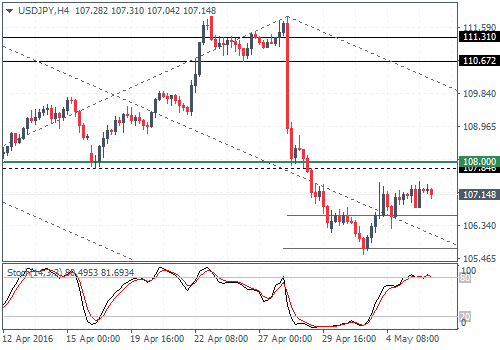
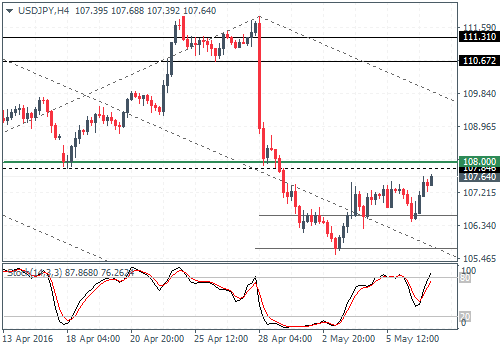
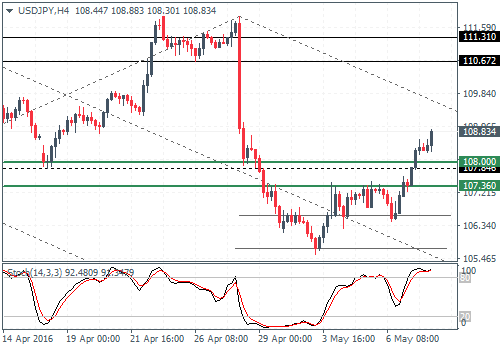
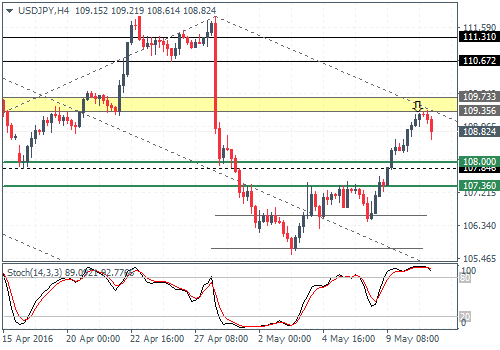
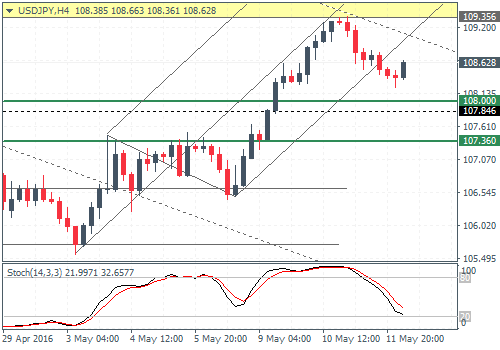
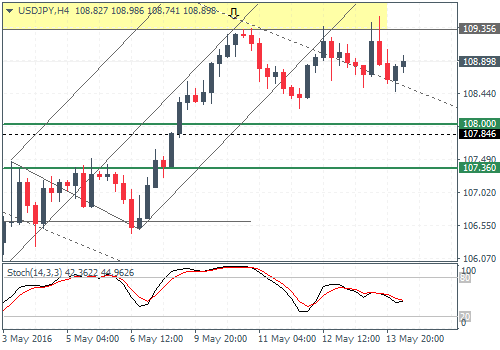
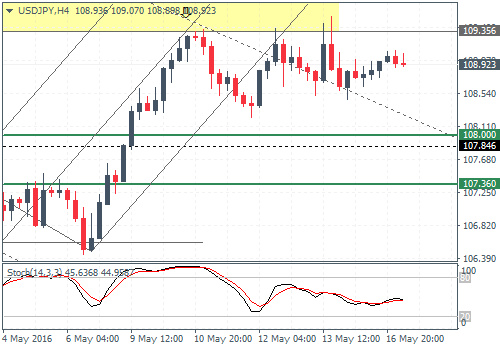
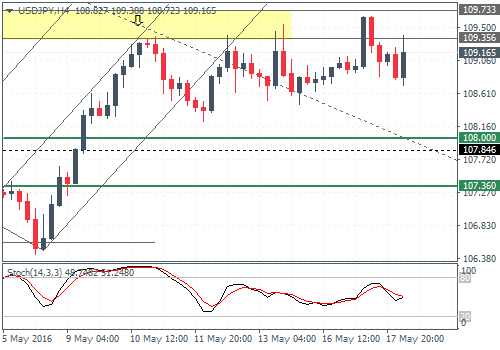
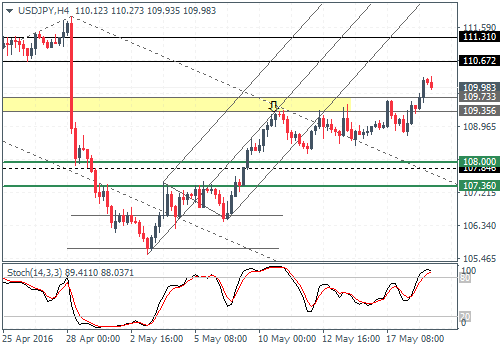
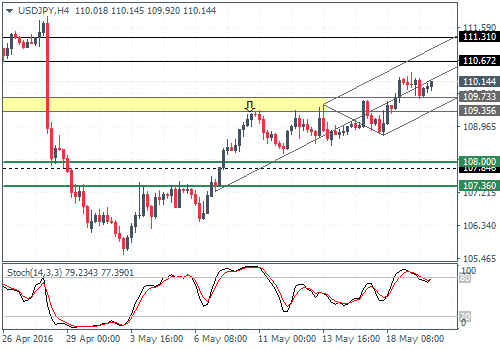
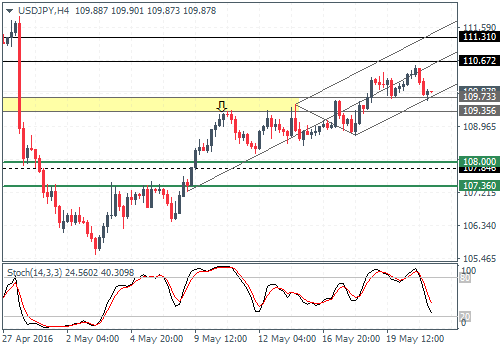
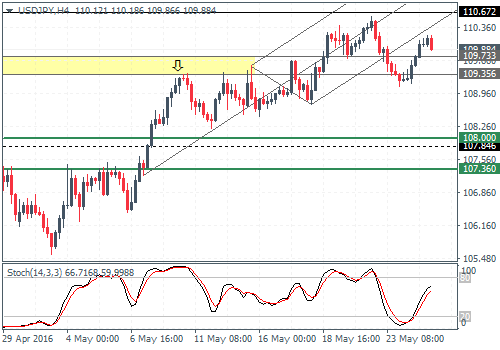
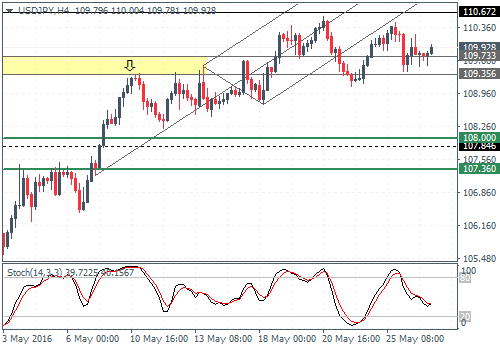
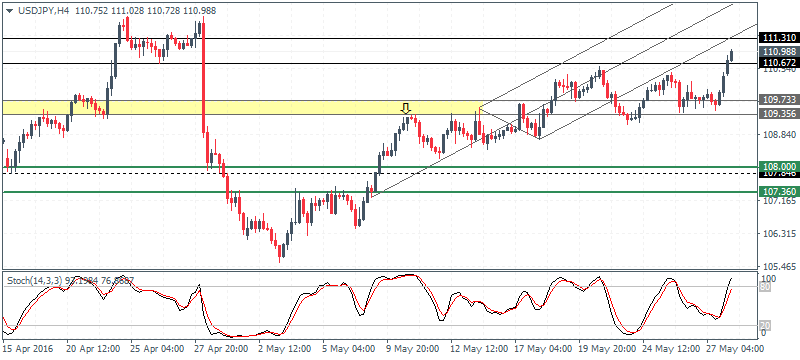
USDJPY (109.2): USDJPY has fallen sharply and is expected to move back to the 108 levels to test the 18th April lows. As long as this support holds, USDJPY could be looking to form a near-term basis for a move towards 112.5. The bias could become invalidated on a daily close below 108 with some convincing candlestick patterns at this level. This could potentially bring back bearish convictions which could see USDJPY attempt to test the 105 levels.
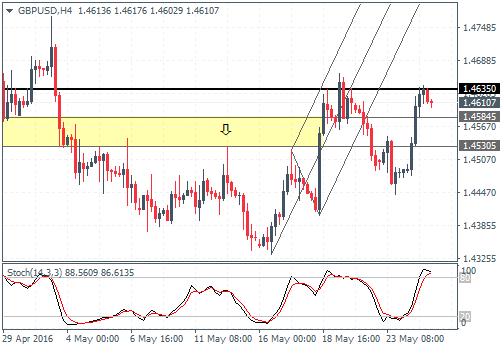
GBPUSD Daily Analysis
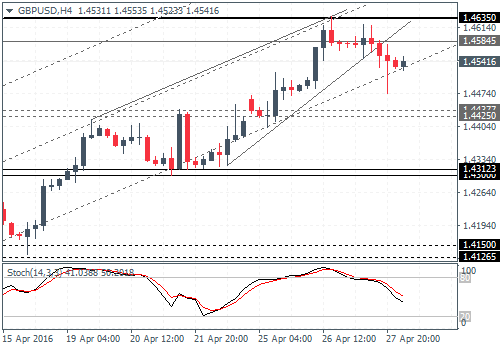
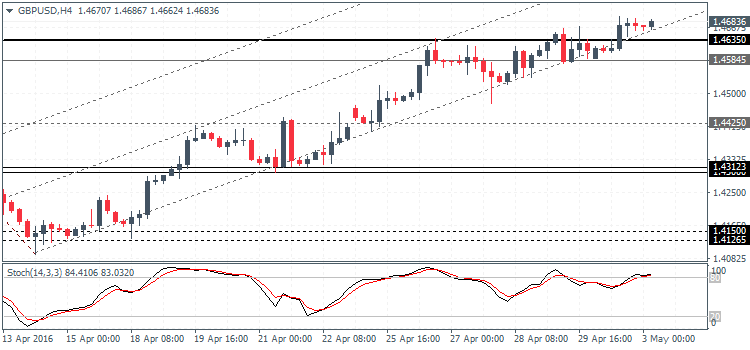
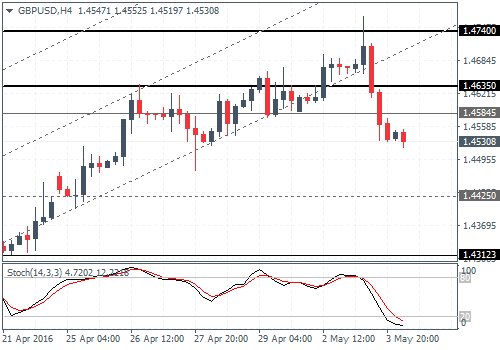
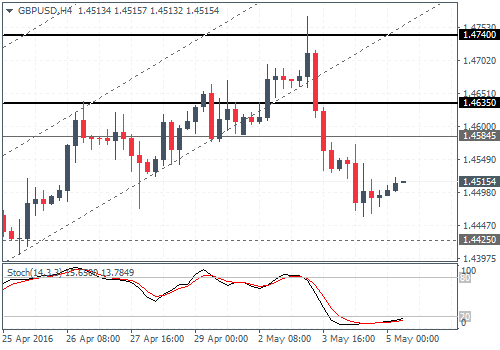
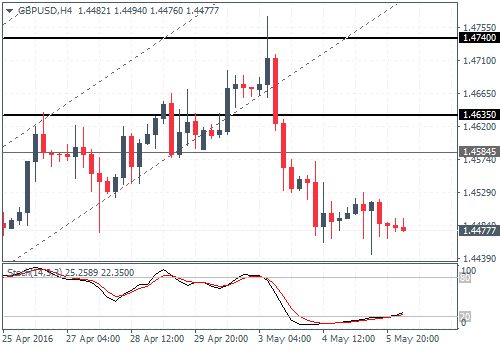
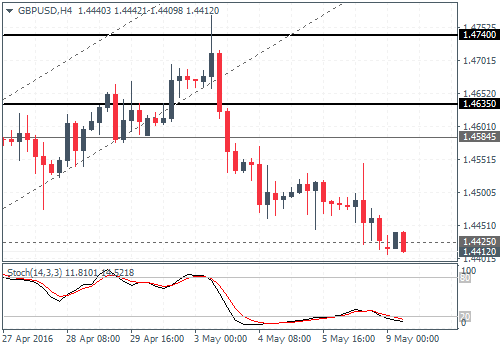
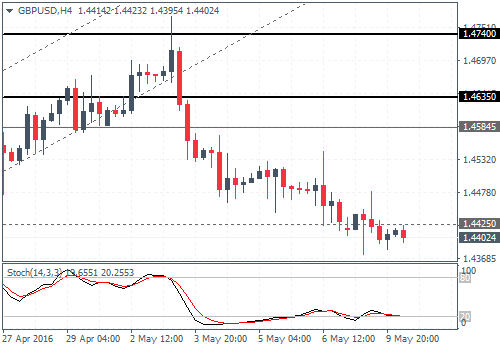
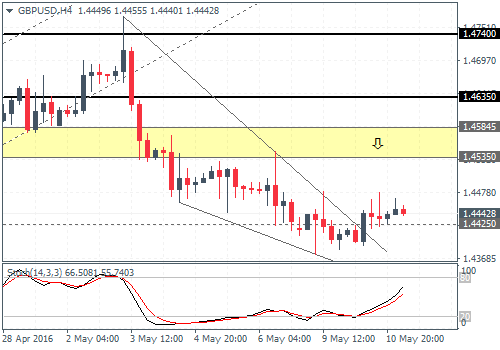
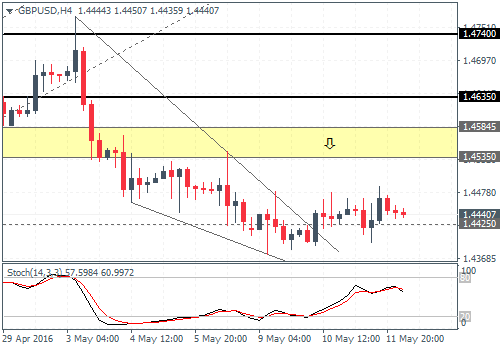
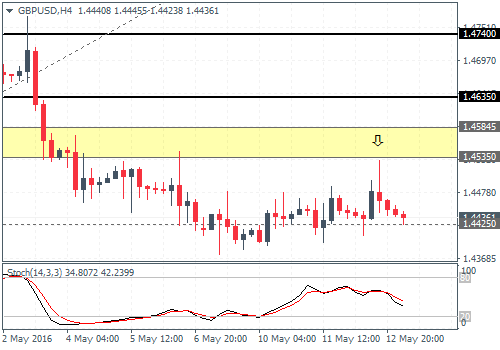
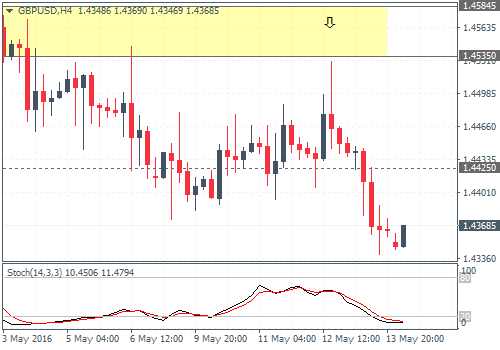
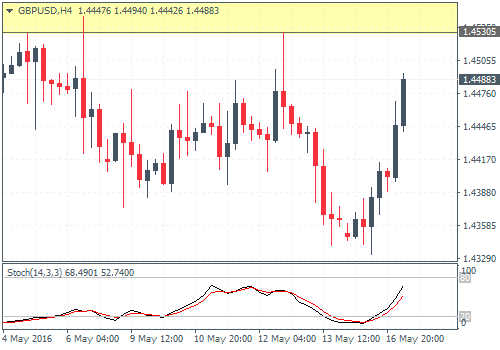
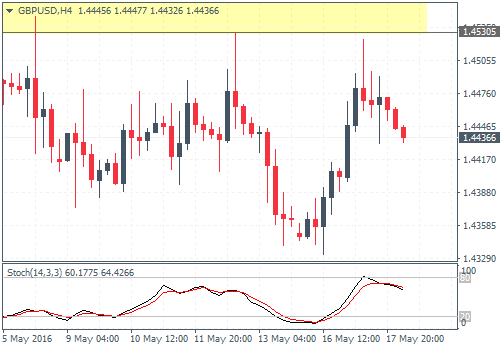
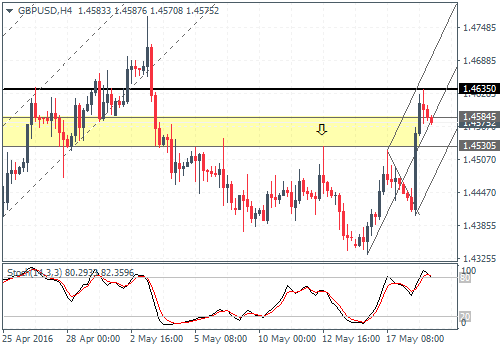
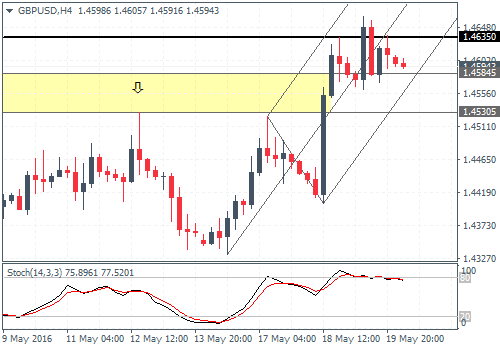
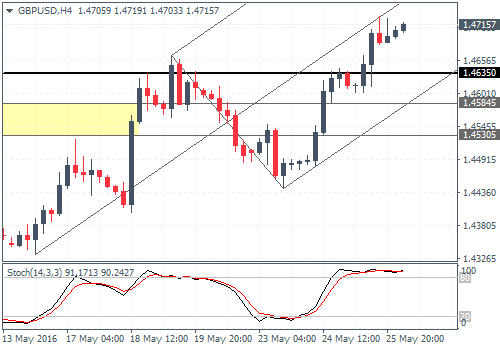
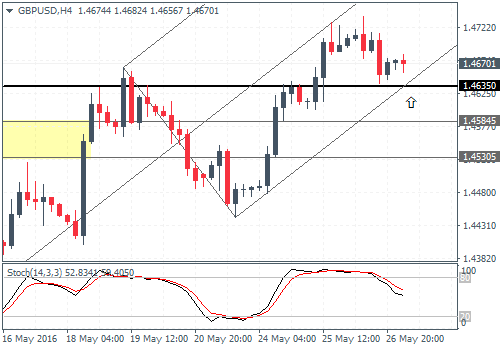
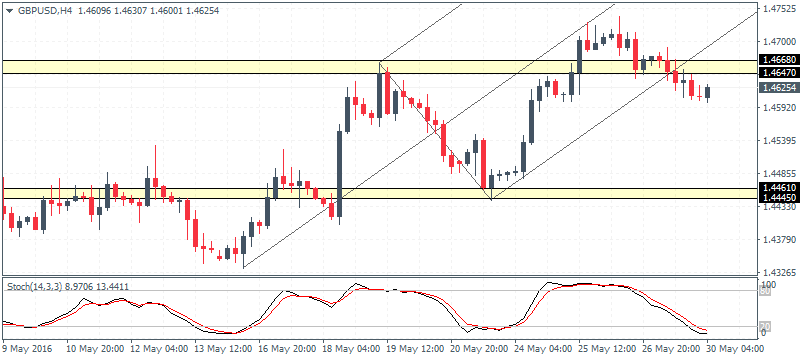
GBPUSD (1.45): GBPUSD has formed an inside bar yesterday after a brief test to 1.4635 the day before. The inside bar pattern is likely to spell a breakout trade in the making. The downside is well supported at 1.4425 support, which marks the inverse head and shoulders neckline resistance on the daily chart. Establishing support here could see GBPUSD look for gains near 1.4635 - 1.4745. On the 4-hour chart, we can see GBPUSD attempting to push lower following the rising wedge consolidation. As long as prices remain below 1.45845 - 1.4635, the bias remains to the downside for 1.443 - 1.4425 (the daily inverse H&S neckline). This would also result in a higher low being posted. A close below 1.4425 could send GBPUSD lower to the next support at 1.431 - 1.430.
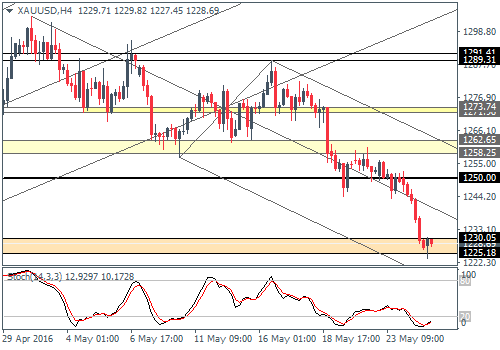
Gold Daily Analysis
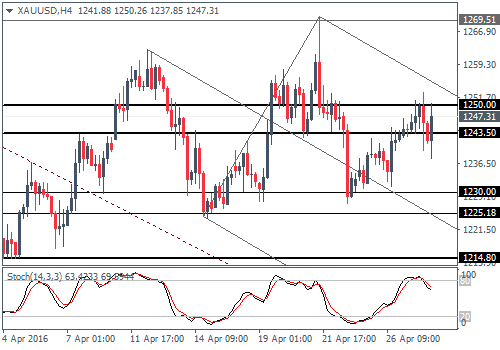
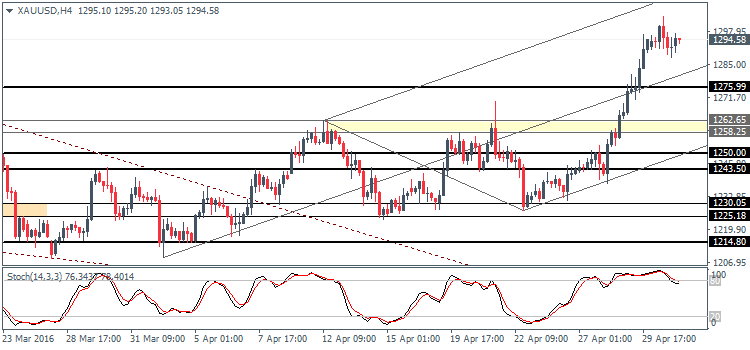
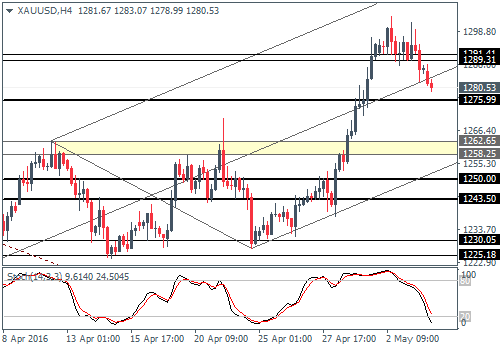
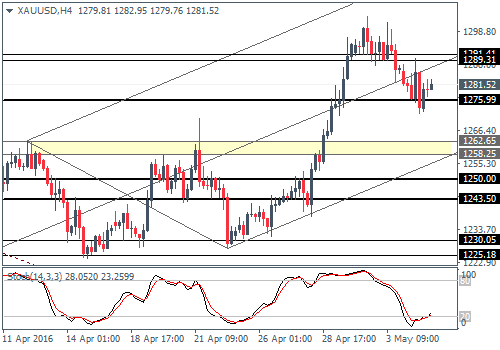
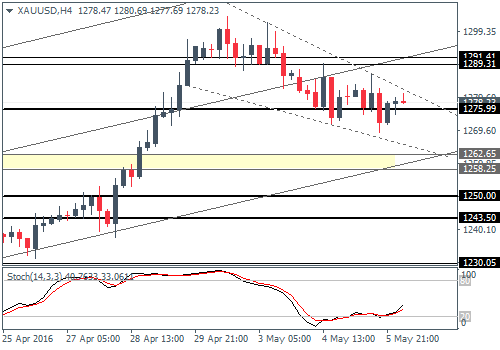
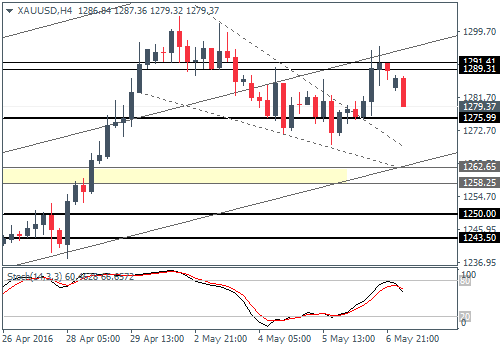
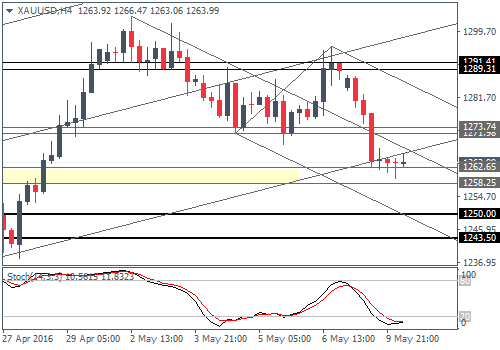
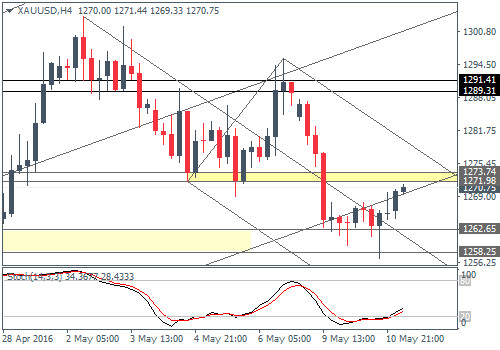
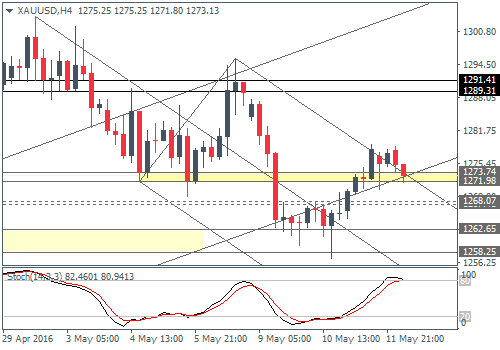
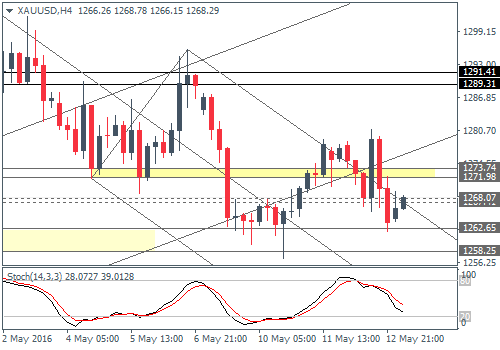
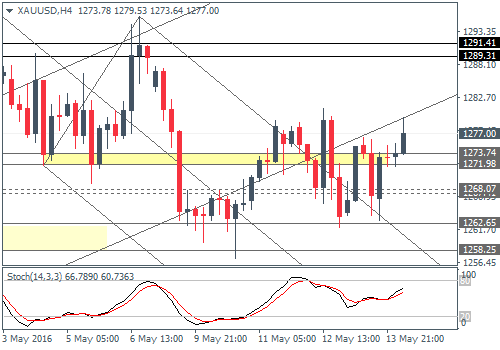
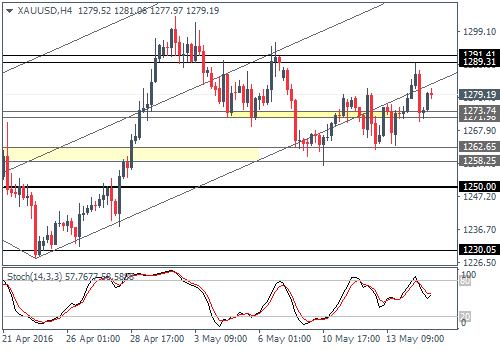
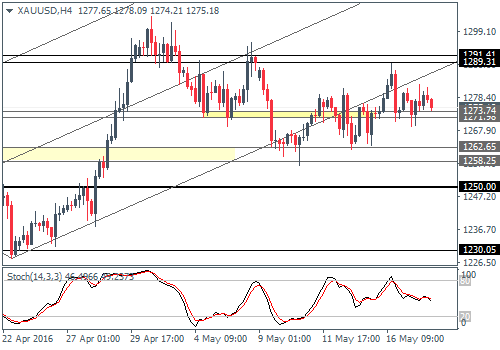
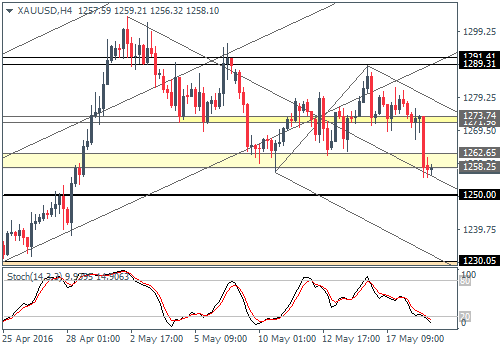
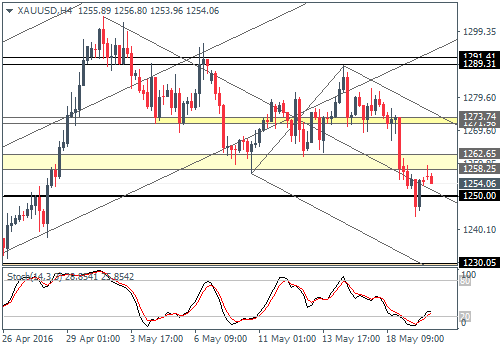
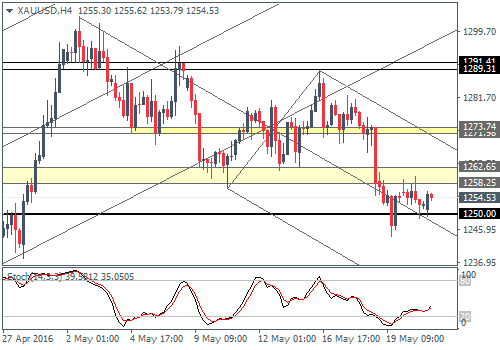
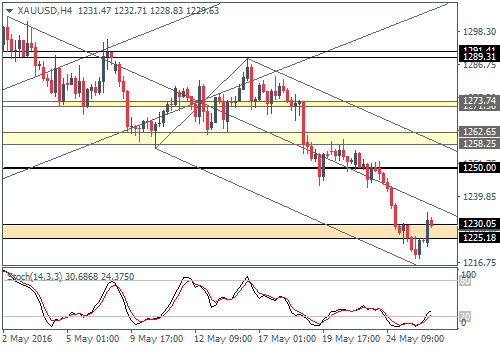
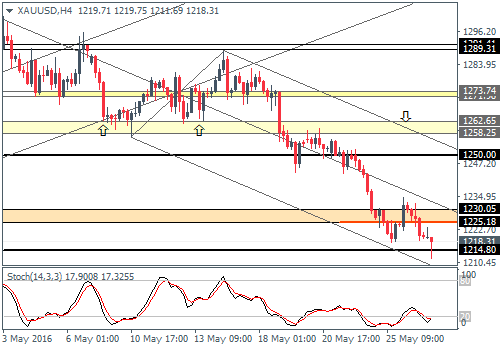
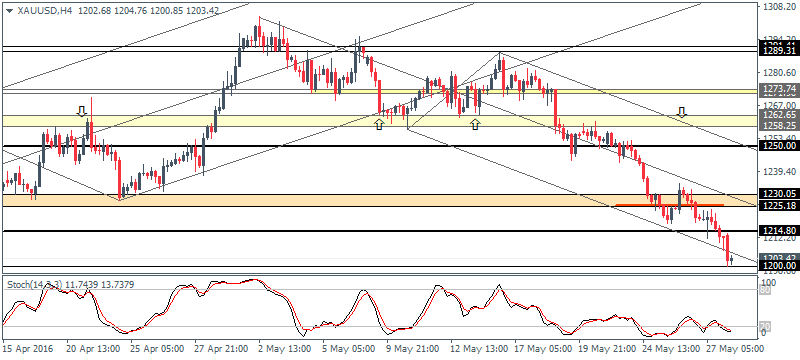
XAUUSD (1247): Gold prices continue to push higher maintaining its bullish momentum since the past few days with 1250 back in sight. However, the momentum is showing signs of waning at the current levels, although at a risk of a spike higher in the near term. The 4-hour chart currently shows a head and shoulders pattern forming with the neckline support at 1230 - 1225 while the head spiked to 1269.5 on April 21st. As long as this high is not breached, Gold prices could potentially form the right shoulder around the 1250 handle. A break of the 1230 - 1225 support could see a measured move lower to the 1205 - 1200 levels.
The markets have been volatile over the past few hours with major central bank decisions. The Fed left rates unchanged and so did the RBNZ and the BoJ. While the yen is strengthening currently, there is scope for a pullback in the near term. Meanwhile, EURUSD could be looking to target the 1.14 handle while gold, aiming for 1250 is in the process of making a head and shoulders pattern on the 4-hour chart.
EURUSD Daily Analysis
EURUSD (1.13): EURUSD closed bullish yesterday marking the third day of bullish close. Price action indicates the potential for further upside in the euro over the near term, but the medium-long term forecasts show the bearish bias staying intact. Support is identified near 1.130 - 1.1275, which could see the euro dip and establish support at this level. In such a scenario, EURUSD could potentially test 1.425 - 1.140 which is a strong resistance level. As long as this resistance holds, EURUSD could potentially start looking weaker with 1.13 and 1.12 coming in as the near-term targets.
USDJPY Daily Analysis
USDJPY (109.2): USDJPY has fallen sharply and is expected to move back to the 108 levels to test the 18th April lows. As long as this support holds, USDJPY could be looking to form a near-term basis for a move towards 112.5. The bias could become invalidated on a daily close below 108 with some convincing candlestick patterns at this level. This could potentially bring back bearish convictions which could see USDJPY attempt to test the 105 levels.
GBPUSD Daily Analysis
GBPUSD (1.45): GBPUSD has formed an inside bar yesterday after a brief test to 1.4635 the day before. The inside bar pattern is likely to spell a breakout trade in the making. The downside is well supported at 1.4425 support, which marks the inverse head and shoulders neckline resistance on the daily chart. Establishing support here could see GBPUSD look for gains near 1.4635 - 1.4745. On the 4-hour chart, we can see GBPUSD attempting to push lower following the rising wedge consolidation. As long as prices remain below 1.45845 - 1.4635, the bias remains to the downside for 1.443 - 1.4425 (the daily inverse H&S neckline). This would also result in a higher low being posted. A close below 1.4425 could send GBPUSD lower to the next support at 1.431 - 1.430.
Gold Daily Analysis
XAUUSD (1247): Gold prices continue to push higher maintaining its bullish momentum since the past few days with 1250 back in sight. However, the momentum is showing signs of waning at the current levels, although at a risk of a spike higher in the near term. The 4-hour chart currently shows a head and shoulders pattern forming with the neckline support at 1230 - 1225 while the head spiked to 1269.5 on April 21st. As long as this high is not breached, Gold prices could potentially form the right shoulder around the 1250 handle. A break of the 1230 - 1225 support could see a measured move lower to the 1205 - 1200 levels.