• The Forex, Binary Options Forum - welcomes you to our Community!

    DigitalCashPalace Forum is dedicated to discussions about Forex, Binary Options, commodities, stocks related.

    Please take a look around, and feel free to .

Market analysis and trade recommendations by FBS

AUD/JPY Daily Analytics
00:46 27.11.2017

AUD/JPY is looking to consolidate its losses across the board below the 200 SMA at H1 chart. Currently, it remains supported by the 84.45 level, at which we’re expecting to make a correction that drives the pair to test the Fibonacci zone of 50% at 86.03. Around that area, the pair could find offers in order to resume the bearish bias and reaches the Fibo target of -23.6% at 83.70.

RSI indicator is close to test the 50 level, strengthening the idea of sideways moves.

1511743553-53091941dfb0e4eca84e1d5f829d0a0b_1200x1200_q90v3.png


More:
https://fbs.com/analytics/articles/aud-jpy-sell-zone-around-8603-5323
 
EUR/USD Daily Analytics
08:39 27.11.2017
Technical levels: support – 1.1920; resistance – 1.1960.

Trade recommendations:

Sell — 1.1960; SL — 1.1980; TP1 — 1.1920; TP2 – 1.1880
Reason: expanding bullish Ichimoku Cloud with rising Senkou Span A; a golden cross of Tenkan-sen and Kijun-sen with rising Tenkan-sen; the prices are made a new monthly high, but the market is overbought.

1511771977-5974574d0f06c411e972e24d898d2405_1200x1200_q90v3.png


More:
https://fbs.com/analytics/articles/eur-usd-euro-made-new-highs-5330
 
NZD/USD Daily Analytics
10:18 27.11.2017
Recommendation:

BUY 0.6895

SL 0.684

TP1 0.6995 TP2 0.7165

On the daily chart, bulls managed to lead the pair outside of the descending channel. If they manage to bring the NZD above 0.6907, the risks of a “Shark” pattern will increase. Its 88.6% target lies at 0.7165.

1511777793-fb9be1d9d65d6402746f6573306cf53b_1200x1200_q90v3.png


On H1, NZD/USD is retesting the “Head and shoulders” neckline. Recoil from resistance will allow bears to pull the kiwi down to 88.6% and 113% targets of the “Shark” pattern. On the other hand, successful test of resistance at 0.6895 will increase the risks of more upside.

1511777808-3696dc2326705fd45dfa7b732beb8b1e_1200x1200_q90v3.png


More:
https://fbs.com/analytics/articles/nzd-usd-kiwi-wants-more-5334
 
EUR/USD Daily Analytics
10:26 27.11.2017

1511778258-7d71490b9b1255f47c777f3dd91a65d3_1200x1200_q90v3.png


The price has been rising since a pullback from 4/8 MM Level happened. So, there's an opportunity to have an extension in wave [iii]. However, it's likely to have a local downward correction, so we should keep an eye on 6/8 MM Level as an intraday target.

1511778258-add7e8d800b3891071420a9d362ac0b0_1200x1200_q90v3.png


The current upward impulse is ready to end, which means we could have wave (ii) in the coming hours. The main bearish target is 6/8 MM Level, which could be a departure point for another bullish rally.

More:
https://fbs.com/analytics/articles/eur-usd-upward-impulse-ready-to-end-5335
 
AUD/USD Daily Anlytics
10:47 27.11.2017
Recommendation:

BUY 0.7640

SL 0.7585

TP1 0.775 TP2 0.7895

On the daily chart, AUD/USD bulls managed to keep the pair inside the long-term uptrend channel. A break of the upper border of the medium-term descending channel with the following successful test of resistance at 0.7637 will increase the risks of correction to the medium-term bearish trend.

1511779582-1db64c049cc9775b27418fd0e6b0833a_1200x1200_q90v3.png


On H1, AUD/USD formed a “Dragon” pattern. A successful test of resistance at 0.7636-0.7639 will finish the formation of “Dragon’s head” and will be a signal for opening long positions.

1511779603-ef00342837a633bda01cab6a3fe3e88f_1200x1200_q90v3.png


More:
https://fbs.com/analytics/articles/aud-usd-bulls-return-to-the-game-5336
 
GBP/USD Daily Analytics
08:20 28.11.2017
Technical levels: support – 1.3320; resistance – 1.3400.

Trade recommendations:

Buy — 1.3340; SL — 1.3320; TP1 — 1.3400; TP2 — 1.3480.
Reason: expanding bullish Ichimoku Cloud with rising Senkou Span A; a golden cross of Tenkan-sen and Kijun-sen, rising Tenkan-sen; the market corrected into the channel of Tenkan-Kijun and will supported by Kijun-sen.

1511857211-5838ef800660551113de2aff99712827_1200x1200_q90v3.png


More:
https://fbs.com/analytics/articles/gbp-usd-pound-may-go-higher-5365
 
AUD/USD Daily Analytics
08:22 28.11.2017
Technical levels: support – 0.7600; resistance – 0.7630

Trade recommendations:

Sell — 0.7590; SL — 0.7610; TP1 — 0.7530; TP2 — 0.7500.
Reason: narrow bearish Ichimoku Cloud with horizontal Senkou Span A and B; a golden cross of Tenkan-sen and Kijun-sen, but the lines are horizontal; the prices tested the Cloud’s upper border and can’t breakout it to positive area.

1511857211-42a68b4bfa2f0515dfbaa054e9dbae66_1200x1200_q90v3.png


More:
https://fbs.com/analytics/articles/aud-usd-aussie-will-continue-downtrend-5366
 
XAU/USD Daily Analytics
08:55 28.11.2017
Recommendation:

BUY $1305

SL $1290

TP1 $1322 TP2 $1350

On the daily chart, XAU/USD bulls managed to lead the pair out of the upper border of the consolidation range between $1266 and $1288 an ounce. In order to count for the uptrend’s resumption, buyers need a successful test of $1300-1302.

1511859136-20c6ebb86722ac92f8a505b7903a964b_1200x1200_q90v3.png


On H1, the exit out of the 1266-1305 consolidation range will likely lead either to the formation of the “Bat” pattern with a target at 88.6% or the resumption in the medium-term downtrend.

1511859157-e12a637cc937326a9c7981d6dfc46909_1200x1200_q90v3.png


More:
https://fbs.com/analytics/articles/xau-usd-gold-is-catching-a-bat-5368
 
USD/CAD Daily Analytics
09:12 28.11.2017
Recommendation:

BUY 1.283 SL 1.2775 TP 1.293

SELL 1.2675 SL 1.273 TP 1.2575

On the daily chart, USD/CAD formed a triangle. A break of its lower border will trigger the “Bat” pattern with the target at 88.6%. On the other hand, if the pair gets above the upper border, bulls will regain hope for getting to 88.6% target of the “Shark” pattern.

1511860282-1430b06b52ccdf0a9e951da31344610e_1200x1200_q90v3.png


On H1, USD/CAD keeps forming the “Spike and ledge”. A successful test of the lower border of 1.2675-1.2830 range will increase the risks of reaching 161.8% target of AB=CD. A break of resistance at 1.2830 will encourage the uptrend’s resumption.

1511860297-5c726ce87bf89e31cdcfbd4c37b26a4a_1200x1200_q90v3.png


More:
https://fbs.com/analytics/articles/usd-cad-loonie-drew-a-triangle-5369
 
USD/CHF Daily Analytics
07:28 29.11.2017
Recommendation:

BUY 0.9890

SL 0.9835

TP1 0.9990 TP2 1.0145 TP3 1.0300

On the daily chart, USD/CHF bulls managed to hold an important support at 0.9775-0.9800. To resume the uptrend, buyers need a successful test of resistance at 0.9880-0.9890 and at 0.9940. In this case, the odds of the pair’s going to 200% target of AB=CD will increase.

1511940452-a5903a7f3cf43bc4f33886526fd841ba_1200x1200_q90v3.png


On H1, a break of the upper border of the uptrend channel and resistance at 0.9880 (earlier it acted as support) will create grounds for a “Shark” pattern with the target at 88.6%.

1511940472-351a015a31e5fdb2fee97b43bc66aebc_1200x1200_q90v3.png


More:
https://fbs.com/analytics/articles/usd-chf-bulls-defeated-an-attack-5393
 
GBP/USD Daily Analytics
07:40 29.11.2017
Recommendation:

BUY 1.3390

SL 1.3335

TP1 1.349 TP2 1.352 TP3 1.3585

On the daily chart, GBP/USD bulls managed to settle above the upper border of the 1.3045-1.3320 consolidation range within “Spike and ledge” pattern. If the pair renews November high, the odds of the rally’s continuation will increase.

1511941165-b6b56ed02b1869ac79ae2067aff9ca74_1200x1200_q90v3.png


On H1, after GBP/USD reached targets of “Three Indians”, 1-2-3 and “Shark”, there’s a transformation of the latter to 5-0. The pound’s advance above 78.6% and 88.6% of the wave CD means that bulls are in control of the situation.

1511941180-2cf183d9aa99dd882e50bd88c66a58cb_1200x1200_q90v3.png


More:
https://fbs.com/analytics/articles/gbp-usd-pound-broke-free-5394
 
EUR/USD Daily Analytics
07:54 29.11.2017
Technical levels: support – 1.1830; resistance – 1.1960.

Trade recommendations:

Buy — 1.1850/60; SL — 1.1830; TP1 — 1.1900; TP2 – 1.1960
Reason: bullish Ichimoku Cloud, but with horizontal Senkou Span A and B; a cancelled golden cross of Tenkan-sen and Kijun-sen with the horizontal lines; the prices in a correctional movement, but will return to Tenkan and Kijun soon.

1511942033-5974574d0f06c411e972e24d898d2405_1200x1200_q90v3.png


More:
https://fbs.com/analytics/articles/eur-usd-euro-in-correction-to-cloud-5396
 
AUD/USD Daily Analytics
07:55 29.11.2017
Technical levels: support – 0.7580; resistance – 0.7630

Trade recommendations:

Sell — 0.7580; SL — 0.7600; TP1 — 0.7530; TP2 — 0.7500.
Buy — 0.7600; SL — 0.7590; TP1 — 0.7660; TP2 — 0.7690.
Reason: narrow bearish Ichimoku Cloud with horizontal Senkou Span A and B; a cancelled golden cross of Tenkan-sen and Kijun-sen, the lines are horizontal; the prices returned to the SSA’a support.

1511942033-42a68b4bfa2f0515dfbaa054e9dbae66_1200x1200_q90v3.png


More:
https://fbs.com/analytics/articles/aud-usd-the-bears-testing-ssa’s-support-5397
 
EUR/JPY Daily Analytics
07:22 30.11.2017
Recommendation:

BUY 133.60

SL 133.05

TP1 134.60 TP2 136.00 TP3 137.70

On the daily chart, EUR/JPY is forming a “Spike and ledge”. A break of the upper border of the 131.5-133.95 range will create grounds for the pair going to 200% target of AB=CD. On the other hand, successful test of support at 131.50 will trigger the “Bat” pattern. Its 88.6% target corresponds to 128.30.

1512026451-8afba167b3e7c15d0d5d28d0f3c7b966_1200x1200_q90v3.png


On H1, EUR/JPY formed a “Widening wedge” pattern. To resume the uptrend, there’s a need for a successful test of resistance at 133.6.

1512026467-144c086f9efd0dd7367f2818eb875c0e_1200x1200_q90v3.png


More:
https://fbs.com/analytics/articles/eur-jpy-euro-is-in-the-ledge-5415
 
USD/JPY Daily Analytics
07:33 30.11.2017
Recommendation:

BUY 112.35

SL 111.75

TP1 113 TP2 113.25

TP3 113.9

On the daily chart, USD/JPY bulls managed to lead the pair outside of the long-term downtrend channel and settle above resistance at 111.65. A successful test of resistance at 113 will return buyers the hope for going to 113% target of the senior “Shark” pattern.

1512027119-3297c54597baddc0779dab87f73568a2_1200x1200_q90v3.png


On H1, there’s a great possibility of a volatile trading. After a break of the upper border of the downtrend channel and reaching 113% target of the junior “Shark” pattern, there may be a pullback and a retest of the diagonal support.

1512027135-1f50b4d918123f905c31c70a9dfda50a_1200x1200_q90v3.png


More:
https://fbs.com/analytics/articles/usd-jpy-yen’s-in-the-shark’s-lair-5416
 
GBP/USD Daily Analytics
08:53 30.11.2017
Technical levels: support – 1.3380; resistance – 1.3500.

Trade recommendations:

Sell — 1.3500; SL — 1.3520; TP1 — 1.3430; TP2 — 1.3380.
Reason: expanding bullish Ichimoku Cloud with rising Senkou Span A and B; the rising lines Tenkan-sen and Kijun-sen; the prices made new highs but there is strong daily resistance on 1.3500 – expecting the correctional movement.

1512031976-5838ef800660551113de2aff99712827_1200x1200_q90v3.png


More:
https://fbs.com/analytics/articles/gbp-usd-pound-under-main-resistance-5421
 
EUR/USD Daily Analytics[/B]
15:20 30.11.2017

1512055087-db1ef97176742dc40a4ff6b4015deab4_1200x1200_q90v3.png


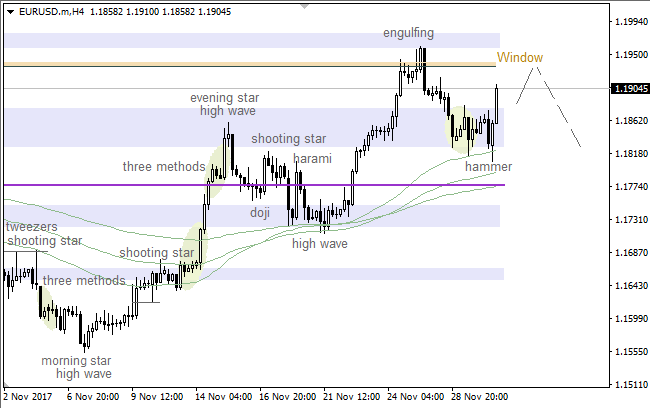
There's a "Hammer", which has been formed on the 34 Moving Average. Confirmation of this pattern hasn't been formed yet, so the market is likely going to test the upper "Window", which could act as resistance.

1512055087-5781625340bfcd135257c78ae10ced74_1200x1200_q90v3.png


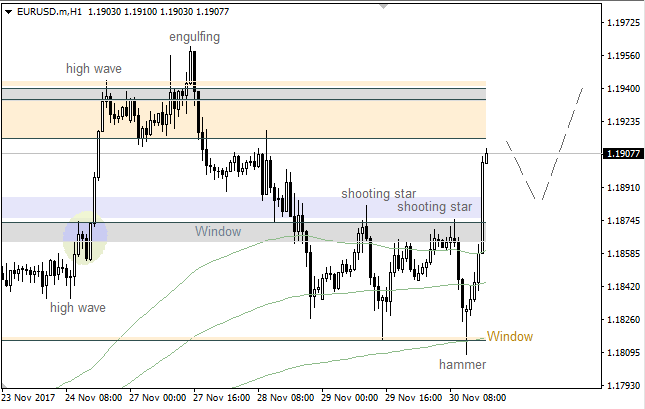
The 144 Moving Average has acted as support, so there's a "Hammer", which has been confirmed. Therefore, the market is likely going to continue moving up towards the nearest "Window".

More:
https://fbs.com/analytics/articles/eur-usd-144-ma-acted-as-support-5430
 
USD/JPY Daily Analytics
15:22 30.11.2017

1512055135-a20d33a93f24eb4624aa6811abf7a2ea_1200x1200_q90v3.png


The upper "Window" has acted as resistance, so there's a bearish "Shooting Star". In this case, we're likely going to have a downward correction towards the closest support level.

1512055088-dd55ed5b9bc1ea7bdf46befe68fc6f7b_1200x1200_q90v3.png


There're bearish patterns such a "Shooting Star" and a "Harami", which both have been confirmed. So, the pair is likely going to test the Moving Averages, which could be a departure point for a local upward price movement.

More:
https://fbs.com/analytics/articles/usd-jpy-bearish-shooting-star-5431
 
Top