• The Forex, Binary Options Forum - welcomes you to our Community!

    DigitalCashPalace Forum is dedicated to discussions about Forex, Binary Options, commodities, stocks related.

    Please take a look around, and feel free to .

Market analysis and trade recommendations by FBS

EUR/USD Daily Analytics
08:05 01.12.2017
Recommendation:

BUY 1.1860

SL 1.1805

TP1 1.1975 TP2 1.2045

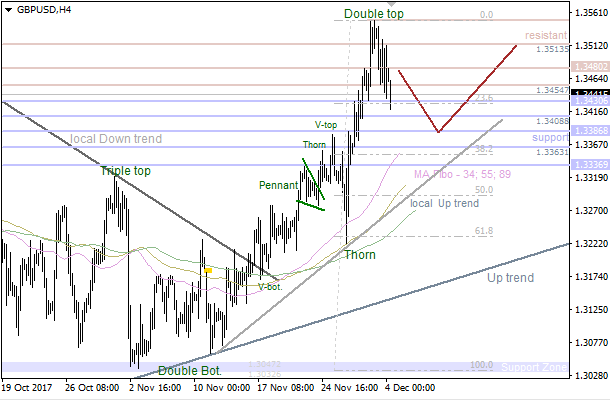
On the daily chart, EUR/USD keeps forming the inverted “Shark” pattern with a target of 88.6%. Bulls managed to settle above 1.1820 and 1.1885 and aim to continue way up to resume the long-term uptrend.

1512115418-8afba167b3e7c15d0d5d28d0f3c7b966_1200x1200_q90v3.png


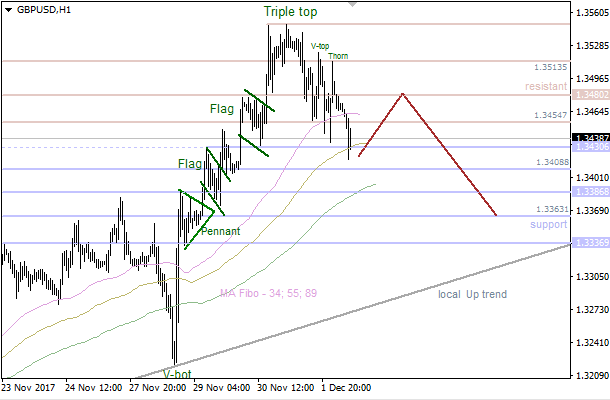
On H1, after reaching targets of the “Widening wedge” and “Three touches” bulls managed to return the initiative to their hands. They are pushing the pair up towards 88.6% and 224% of the “Shark” and AB=CD.

1512115439-1f50b4d918123f905c31c70a9dfda50a_1200x1200_q90v3.png


More:
https://fbs.com/analytics/articles/eur-usd-bulls-came-to-power-5442
 
EUR/USD Daily Analytics
08:34 01.12.2017
Technical levels: support – 1.1890; resistance – 1.1960.

Trade recommendations:

Buy — 1.1890; SL — 1.1870; TP1 — 1.1960; TP2 – 1.2000.
Reason: bullish Ichimoku Cloud with horizontal Senkou Span A and B; a dead cross of Tenkan-sen and Kijun-sen with the horizontal lines; the prices are returned to the positive area and may continue uptrend.

1512117234-5974574d0f06c411e972e24d898d2405_1200x1200_q90v3.png


More:
https://fbs.com/analytics/articles/eur-usd-euro-returned-to-positive-area-5443
 
EUR/GBP Daily Analytics
08:36 01.12.2017
Recommendation:

BUY 0.8825

SL 0.8770

TP1 0.8885 TP2 0.8950

On the daily chart, EUR/GBP is fighting for 0.8805 (50% of the long-term bullish wave). Bears are trying to bring the pair inside the downtrend channel. If they succeed, the risks of correction to the long-term trend increase. On the other hand, return of the pair above 0.8805 will return the initiative to the bulls.

1512117287-bc1ce4ebdd72b71af2881b8edc2b5fe5_1200x1200_q90v3.png


On H1, EUR/GBP formed a “Head and shoulders” and “Gartley” patterns. The realization of a 1-2-3 pattern will allow bulls to count on a retest of the neckline.

1512117309-311438cdc50bb0f634d8ee27e47a0113_1200x1200_q90v3.png


More:
https://fbs.com/analytics/articles/eur-gbp-bulls-are-going-for-a-retest-5445
 
EUR/USD Daily Analytics
10:54 01.12.2017

1512125581-8ba1590928682dad418e14dde9c342e5_1200x1200_q90v3.png


The 34 Moving Average has acted as support, so the market is likely going to reach the next resistance area at 1.1975 - 1.2003 in the short term. If a pullback from these levels happens little later on, there'll be an opportunity to have a downward correction towards the nearest support at 1.1909 - 1.1859.

1512125581-b17b8896d79e2474558f222fcb575c48_1200x1200_q90v3.png


Bulls faced with resistance at 1.1927, so the price is consolidating. Also, there's a "Pennant" pattern, so the pair is likely going to achieve the closest resistance at 1.1975 - 1.2003 during the day. Meanwhile, if we have a pullback from this area, bears will probably try to test another support at 1.1909 - 1.1897.

More:
https://fbs.com/analytics/articles/eur-usd-pennant-pattern-5447
 
GBP/USD Daily Analytics
10:56 01.12.2017

1512125581-7436a3179532b395952f7e9cd6835d8e_1200x1200_q90v3.png


The market found resistance at 1.3469, so the pair is likely going to test the nearest support at 1.3513 - 1.3480 in the coming hours. However, if a pullback from this area forms afterwards, we could have another upward price movement in the direction of the next resistance at 1.3595 - 1.3618.

1512125581-7c5ec9c4d49217084e664e549e1e3218_1200x1200_q90v3.png


There's a possible "Tripe Top", which hasn't been finished yet. If this pattern confirms, bears are likely going to reach the nearest support at 1.3513 - 1.3480, which could be a departure point for another bullish price movement.

More:
https://fbs.com/analytics/articles/gbp-usd-possible-tripe-top-5448
 
EUR/USD Daily Analytics
11:01 01.12.2017

1512125932-6463049ebbcbec7e6eac5252238f996b_1200x1200_q90v3.png


The upper "Window" acted as resistance for the second time, so there's an "Engulfing" pattern, which hasn't been confirmed yet. Therefore, the 34 Moving Average is likely going to act as support in the short term.

1512125932-9780a83e845dde30262975b517bc3fb8_1200x1200_q90v3.png


There's an "Engulfing" pattern, which has been formed on the upper "Window". The main intraday target is the 89 Moving Average. If a pullback from this line happens, there'll be an opportunity to have another upward price movement.

More:
https://fbs.com/analytics/articles/eur-usd-engulfing-pattern-5449
 
USD/JPY Daily Analytics
11:03 01.12.2017

1512125932-2d8488834908d6fc98409df43d934faf_1200x1200_q90v3.png


The 55 Moving Average is acting as support, but there're bearish patterns like a "Doji" and a "Shooting Star". So, we're likely going to have a local bearish correction in the short term. At the same time, there's an opportunity to have another bullish price movement afterwards.

1512125932-015274ad05c9e13370731b95508f9a6d_1200x1200_q90v3.png


We've got a "Doji" and a "Harami", which have been formed at the last high. Considering that both patterns have confirmation, the market is likely going to test the 34 Moving Average. If a pullback from this line happens, we could have an upward price movement towards the upper "Window".

More:
https://fbs.com/analytics/articles/usd-jpy-55-moving-average-acting-as-support-5450
 
[B]EUR/NZD Daily Analytics[/B]
00:02 04.12.2017


The pair remains strong in a bullish bias held since November 28th session and according to our projections, EUR/NZD is expected to find buyers at the current stage. That’s a likely scenario, taking in consideration that our Fibonacci levels coincides with the 1.7274 and 1.7214. If the pair manages to rebound around that area, the next target should be the -23.6% at 1.7569.

RSI indicator is moving into the waters of oversold territory.

1512345724-088c4d7cde7093f9a5f3f72dee6cc988_1200x1200_q90v3.png


More:
https://fbs.com/analytics/articles/eur-nzd-looking-for-buyers-across-the-board-5464
 
NZD/USD Daily Analytics
08:26 04.12.2017

Recommendation:

SELL 0.6815 SL 0.6870 TP1 0.6715 TP2 0.6625

BUY 0.6935 SL 0.6880 TP1 0.7035 TP2 0.7170

On the daily chart, NZD/USD is consolidating in the 0.6820-0.6980 range. A break of its lower border will increase the risks of kiwi going to 127.2% and 161.8% targets of a “Crab”. On the other hand, successful test of resistance at 0.6980 creates grounds for the pair going to 88.6% target of the “Shark” pattern.

1512375451-fb9be1d9d65d6402746f6573306cf53b_1200x1200_q90v3.png


On H1, a successful test of the neckline of the “Head and Shoulders” will allow the pair to continue its fall. On the other hand, going above 0.6930 will increase the odds of the rally’s continuation.

1512375567-3696dc2326705fd45dfa7b732beb8b1e_1200x1200_q90v3.png


More:
https://fbs.com/analytics/articles/nzd-usd-kiwi-is-waiting-for-a-signal-5472
 
AUD/USD Daily Analytics
11:39 04.12.2017
Recommendation:

BUY 0.7640

SL 0.7585

TP1 0.7750 TP2 0.7895

On the daily chart, AUD/USD keeps fighting for the lower border of a long-term uptrend channel. If bulls fail to hold it, the risks of realization of 88.6% target of the senior “Shark” pattern will increase. On the other hand, a break of resistance at 0.7637-0.7640 will trigger the junior “Shark”.

1512387489-1db64c049cc9775b27418fd0e6b0833a_1200x1200_q90v3.png


On H1, AUD/USD after reaching 78.6% target of a “Shark” pulled back to 88.6%. The second attack of resistance at 0.7635 in case of success will allow bulls to count on the continuation of the rally.

1512387506-ef00342837a633bda01cab6a3fe3e88f_1200x1200_q90v3.png


More:
https://fbs.com/analytics/articles/aud-usd-bulls-clutch-at-a-straw-5477
 
EUR/USD Daily Analytics
13:50 04.12.2017

1512395316-1eca2633866aff308ac1bbc22b5a8de7_1200x1200_q90v3.png


Bulls faced with resistance at 1.1934 - 1.1938, so there's a "Triple Top" pattern, which has been confirmed. Therefore, the market is likely going to decline towards the nearest support at 1.1808 - 1.1792 in the short term. If a pullback from this area happens little later on, we could have another upward price movement in the direction of the next resistance at 1.1909.

1512395316-0069f716ba8251ca229926d50aee765f_1200x1200_q90v3.png


There's a "Triple Top" pattern, which has been confirmed by the last "Breakaway Gap", so the price has broken all the Moving Averages. However, bears faced with support at 1.1836. In this case, the pair is likely going to reach the closest resistance at 1.1897 - 1.1909 in the coming hours.

More:
https://fbs.com/analytics/articles/eur-usd-breakaway-gap-5480
 
GBP/USD Daily Analytics
13:52 04.12.2017

1512395316-62791b559440548024df65cf06613086_1200x1200_q90v3.png


There's a "Double Top" pattern, which has been confirmed. So, the price is likely going to reach the nearest support at 1.3386 - 1.3363 in the coming hours. If a pullback from this area happens afterwards, there'll be an opportunity to have an upward price movement towards another resistance at 1.3480 - 1.3513.

1512395315-86e5015fa7253642273a9bed14565ce8_1200x1200_q90v3.png


The 55 Moving Average has acted as support, so bulls are likely going to test the 34 MA shortly. If a pullback from this line happens afterwards, bears will probably try to reach the nearest support between the levels 1.3386 - 1.3363.

More:
https://fbs.com/analytics/articles/gbp-usd-double-top-pattern-5481
 
EUR/USD Daily Analytics
13:56 04.12.2017

1512395704-a9ac5baf76d2d1a174b777927c872e63_1200x1200_q90v3.png


The upper "Window" has acted as resistance once again. Also, there's new "Window". Therefore, the market is likely going to test the 89 Moving Average in the short term.

1512395704-ac01f1ef0a8d7b3c06615693502c3a0a_1200x1200_q90v3.png


The 144 Moving Average is acting as support. Also, there's a bullish "Engulfing", but this pattern hasn't been confirmed yet. So, the pair is likely going to test the lower "Window" in the coming hours.

More:
https://fbs.com/analytics/articles/eur-usd-144-ma-acting-as-support-5482
 
USD/JPY Daily Analytics
13:58 04.12.2017

1512395704-1371f05370987f4d270e9d5c49e96af5_1200x1200_q90v3.png


The price has been fixed above the "Window". Also, there isn't any reversal pattern so far. In this case, the price is likely going to continue moving up towards the next "Window".

1512395704-d36185502233ff52b35d15c1520df6a5_1200x1200_q90v3.png


There's a bearish "Engulfing", but this pattern hasn't been confirmed yet. So, we could have just a local correction and the following upward price movement afterwards.

More:
https://fbs.com/analytics/articles/usd-jpy-bearish-engulfing-5483
 
XAU/USD Daily Analytics
07:01 05.12.2017

Recommendation:

SELL $1266

SL $1281

TP1 $1237 TP2 $1212

On the daily chart, inability of bulls to conquer resistance at $1299-1302 an ounce with the following return of the price inside the $1266-1288 consolidation range points at buyers’ weakness. As a result, risks of the price reaching 78.6% and 200% targets of “Gartley” and AB=CD increased.

1512457206-20c6ebb86722ac92f8a505b7903a964b_1200x1200_q90v3.png


On H1, gold’s going outside of the short-term uptrend channel with the following retest of diagonal resistance confirms that bears are serious.

1512457224-e12a637cc937326a9c7981d6dfc46909_1200x1200_q90v3.png


More:
https://fbs.com/analytics/articles/xau-usd-gold-chose-direction-5496
 
USD/CAD Daily Analytics
07:08 05.12.2017
Recommendation:

SELL 1.2655

SL 1.271

TP1 1.2555 TP2 1.2495

On the daily chart, USD/CAD formed a “Shakeout-Fakeout” pattern with a false break of an upper border of a triangle. As a result, the pair went outside of the uptrend channel. Such dynamics increases the risks of it sliding to 88.6% target of the “Bat” pattern.

1512457638-1430b06b52ccdf0a9e951da31344610e_1200x1200_q90v3.png


On H1, USD/CAD is finishing a “Widening wedge” pattern. A pullback to 23.6% with the following return to point 5 means that bears are serious.

1512457652-5c726ce87bf89e31cdcfbd4c37b26a4a_1200x1200_q90v3.png


More:
https://fbs.com/analytics/articles/usd-cad-bulls-got-into-a-trap-5497
 
EUR/USD Daily Analytics
08:02 05.12.2017
Technical levels: support – 1.1830; resistance – 1.1880, 1.1960.

Trade recommendations:

Buy — 1.1890; SL — 1.1870; TP1 — 1.1960; TP2 – 1.2000.
Sell — 1.1850; SL — 1.1870; TP1 — 1.1760.
Reason: bullish Ichimoku Cloud, but horizontal Senkou Span A and B; a weak golden cross of Tenkan-sen and Kijun-sen with the horizontal lines; the prices are under strong resistance of Kijun-sen and Senkou Span A.

1512460949-5974574d0f06c411e972e24d898d2405_1200x1200_q90v3.png


More:
https://fbs.com/analytics/articles/eur-usd-euro-in-negative-mood-5502
 
Top