• The Forex, Binary Options Forum - welcomes you to our Community!

    DigitalCashPalace Forum is dedicated to discussions about Forex, Binary Options, commodities, stocks related.

    Please take a look around, and feel free to .

Market analysis and trade recommendations by FBS

USD/JPY Daily Analytics
08:03 05.12.2017
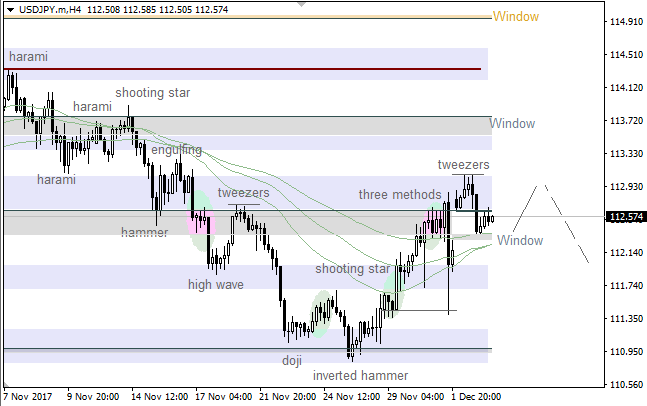
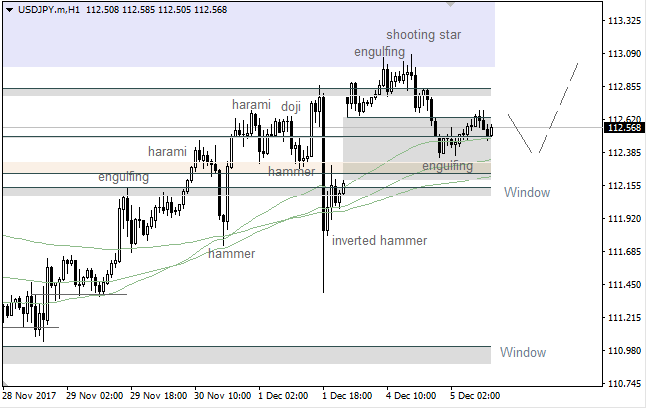
Technical levels: support – 112.25; resistance – 113.00.

Trade recommendations:

Buy — 112.25; SL — 112.00; TP1 — 113.00; TP2 — 113.50.
Reason: bearish Ichimoku Cloud with horizontal Senkou Span A and B; a golden cross of Tenkan-sen and Kijun-sen, with rising Kijun-sen; the market is in consolidation inside a Cloud and may supported by Tenkan and Kijun.

1512460949-3dcc4d3b0e9d38341d309e86e7227f36_1200x1200_q90v3.png


More:
https://fbs.com/analytics/articles/usd-jpy-dollar-returned-into-cloud-5503
 
EUR/USD Daily Analytics
12:16 05.12.2017

1512476094-ad222290767e279ac08a7efa1b234ff5_1200x1200_q90v3.png


Bears faced with support at 1.1826, so the price is consolidating. However, the market is likely going to continue declining towards the next support at 1.1808 - 1.1792. If a pullback from this area happens, we could have an upward correction in the direction of the nearest resistance at 1.1859 - 1.1909.

1512476094-56ff9f91ed6805882c03b34cf9d390b2_1200x1200_q90v3.png


There's a "Double Bottom", so the price is consolidating. The main intraday target is the nearest support at 1.1808 - 1.1792. If a pullback from this area happens little later on, there'll be an opportunity to have a bullish price movement towards the closest resistance at 1.1871 - 1.1890.

More:
https://fbs.com/analytics/articles/eur-usd-double-bottom-5507
 
GBP/USD Daily Analytics
12:19 05.12.2017

1512476094-00974885ea2fb002742c6354b73fe5f0_1200x1200_q90v3.png


We've got a confirmed "Double Top", so the market is likely going to test the nearest support at 1.3363 - 1.3336. Meanwhile, if a pullback from this area happens, we could have another upward price movement towards the next resistance at 1.3454 - 1.3480.

1512476093-55925323c1da08ce4441e647f10f2576_1200x1200_q90v3.png


There's a developing downward correction. The main intraday target is the closest support at 1.3336 - 1.3309. If a pullback from this area happens, bulls will probably try to test another resistance between the levels 1.3408 - 1.3430.

More:
https://fbs.com/analytics/articles/gbp-usd-developing-downward-correction-5508
 
USD/JPY Daily Analytics
12:31 05.12.2017

1512476447-12a633cb579d74df43bf267d9ebdfe16_1200x1200_q90v3.png


There's a bearish "Tweezers" pattern, which has been confirmed. So, the price is likely going to test the nearest Moving Averages. If a pullback from these lines happens little later on, there'll be an opportunity to have a local bullish price movement.

1512476447-655fdff55226f62f0a7856f460f769f0_1200x1200_q90v3.png


We've got a bullish "Engulfing", which has been formed on the 34 Moving Average. However, the market is likely going to test the 55 MA, which could be a departure point for an upward price movement.

More:
https://fbs.com/analytics/articles/usd-jpy-bearish-tweezers-pattern-5510
 
EUR/USD Daily Analytics
12:28 05.12.2017

1512476447-6aea475d53399d6dba58b3ad33311d88_1200x1200_q90v3.png


There's a possible "High Wave" pattern, which has been formed at the last local low. However, the nearest "Window" is acting as resistance, so the 89 Moving Average is likely going to act as support. If so, there'll be an opportunity to have another bullish price movement.

1512476447-e4264b76204e176f971724d7e944401c_1200x1200_q90v3.png


The price is consolidating between the Moving Averages, so the market is likely going to test the upper "Window". If a pullback from this level happens, we could have another decline towards the lower "Window".

More:
https://fbs.com/analytics/articles/eur-usd-high-wave-pattern-5509
 
USD/CHF Daily Analytics
07:03 06.12.2017

Recommendation:

BUY 0.9850

SL 0.9795

TP1 0.993 TP2 0.9975

On the daily chart, USD/CHF bulls managed to keep the pair above important convergence area of 0.9775-0.9800 and counterattacked. A successful test of resistance at 0.9880-0.9890 and 0.9940 will increase the risks of continuation up to 200% target of AB=CD.

1512543753-a5903a7f3cf43bc4f33886526fd841ba_1200x1200_q90v3.png


On H1, USD/CHF reached the targets of “Wolfe waves” pattern. A break of the upper border of the descending trend channel with the following retest create grounds for reaching 88.6% and 113% targets of the “Shark”.

1512543769-351a015a31e5fdb2fee97b43bc66aebc_1200x1200_q90v3.png


More:
https://fbs.com/analytics/articles/usd-chf-wave-saved-franc-from-the-shark-5522
 
GBP/USD Daily Analytics
07:14 06.12.2017
Recommendation:

SELL 1.3520

SL 1.3575

TP1 1.342 TP2 1.332

On the daily chart, the inability of bulls to get above resistance at 1.3520 and 1.3585 points at their weakness. As long as GBP/USD is trading below 1.3605, risks of consolidation are rising. If this level is breached, the possibility of the uptrend’s resumption will go up.

1512544414-b6b56ed02b1869ac79ae2067aff9ca74_1200x1200_q90v3.png


On H1, one may use rebound strategies. If the pair reaches 88.6% target of the “Bat” with the following recoil of the descending channel’s upper border, this will trigger “Three Indians” pattern and be a signal for selling.

1512544444-eaec8f61edb51b022cc992c13c279816_1200x1200_q90v3.png


More:
https://fbs.com/analytics/articles/gbp-usd-bulls-showed-weakness-5524
 
EUR/USD Daily Analytics
12:19 06.12.2017

1512562722-7d84b04e93f612d6ba447b8c16a3b6ea_1200x1200_q90v3.png


There's a new local low, but the price is consolidating between the Moving Averages. The main intraday target is the nearest support at 1.1792 - 1.1756. If a pullback from this area happens little later on, there'll be an opportunity to have an upward price movement towards the closest resistance at 1.1879 - 1.1909.

1512562722-289fb237d9fd77d2d9d78dc1642a18a6_1200x1200_q90v3.png


We've got a "V-Top", which has been formed under the Moving Averages. In this case, the market is likely going to decline towards the next support at 1.1792 during the day. Meanwhile, if we see a pullback from this level, bulls will probably try to test the nearest resistance at 1.1836 - 1.1859.

More:
https://fbs.com/analytics/articles/eur-usd-v-top-under-moving-averages-5527
 
GBP/USD Daily Analytics
12:21 06.12.2017

1512562722-773f9f59ada411bc6f68655afa92bcea_1200x1200_q90v3.png


Bears faced with support at 1.3363, so the price is consolidating. Also, there's a "Double Top" pattern, so the pair is likely going to decline in the direction of the closest support at 1.3336. If we have a pullback from this level, there'll be a moment to have a bullish price movement towards the nearest resistance between the levels 1.3454 - 1.3480.

1512562722-1a17b8b29fc883f33ccd09d8c3c1739c_1200x1200_q90v3.png


The price is consolidating between the 34 & 89 Moving Averages. The main intraday target is the next support at 1.3336. If a pullback from this level happens little later on, we could have an upward price movement towards another resistance at 1.3430 - 1.3454.

More:
https://fbs.com/analytics/articles/gbp-usd-double-top-pattern-5528
 
EUR/USD Daily Analytics
12:24 06.12.2017

1512562971-b334ab863db5a27e605ca4d7a53a0295_1200x1200_q90v3.png


The 34 Moving Average has acted as resistance, but there's still no any reversal pattern. Therefore, the market is likely going to test the 144 MA, which could be a departure point for a bullish price movement towards the nearest "Window".

1512562971-a40b2517614bba13b6cb45b88b523a88_1200x1200_q90v3.png


There's support by the lower "Window", so we could have a local upward correction in the coming hours. Nevertheless, bears are likely going to deliver a new local low afterwards.

More:
https://fbs.com/analytics/articles/eur-usd-34-ma-acted-as-resistance-5529
 
EUR/JPY Daily Analytics
07:10 07.12.2017

Recommendations:

BUY 134.00 SL 133.45 TP1 135 TP2 138

SELL 131.5 SL 132.05 TP1 129 TP2 128.2

On the daily chart, EUR/JPY there are “Shakeout-fakeout” and “Spike and ledge” patterns. Other tests of resistance at 133.95-134 or support at 131.50 will increase the risks of the pair getting to 200% and 88.6% targets of AB=CD and the “Bat”.

1512630446-8afba167b3e7c15d0d5d28d0f3c7b966_1200x1200_q90v3.png


On H1, there are the “Widening wedge” and “Wolfe waves”. To resume the long-term uptrend the pair needs a successful test of resistance at 134. To develop correction the euro should break below 131.50.

1512630481-144c086f9efd0dd7367f2818eb875c0e_1200x1200_q90v3.png


more:
https://fbs.com/analytics/articles/eur-jpy-euro-returned-to-the-corridor-5549
 
USD/JPY Daily Analytics
07:19 07.12.2017
Recommendation:

BUY 113.00

SL 112.35

TP1 113.90 TP2 115.40

On the daily chart, USD/JPY retraced 50% of the wave CD in line with the transformation of the “Shark” into 5-0. Another test of resistance at 113 in case of success will increase the odds of the rally’s continuation towards 113% target of the senior “Shark”.

1512631090-3297c54597baddc0779dab87f73568a2_1200x1200_q90v3.png


On H1, the junior “Shark” pattern is transforming into 5-0. To develop correction to the short-term downtrend with its following break bulls need to conquer resistance at 112.80-113 and at 113.25.

1512631129-1f50b4d918123f905c31c70a9dfda50a_1200x1200_q90v3.png


More:
https://fbs.com/analytics/articles/usd-jpy-sharks-are-around-the-yen-5550
 
GBP/JPY Daily Analytics
09:14 07.12.2017
GBP/JPY reversed from resistance zone
Next sell target - 147.50
GBP/JPY continues to fall inside the minor impulse wave (i) – which belongs to the C-wave of the intermediate ABC correction (B) from the middle of September. The active C-wave started earlier – when the pair reversed down from the resistance zone lying at the intersection of the major resistance level 152.50, upper daily Bollinger Band the resistance trendline of the daily up channel from April. GBP/JPY is expected to fall to the next sell target at the next strong support level 147.50.

GX5ddsh.png


More:
https://fbs.com/analytics/articles/gbp-jpy-reversed-from-resistance-zone-5554
 
EUR/JPY Daily Analytics
09:13 07.12.2017
EUR/JPY reversed from resistance zone
Next sell target - 131.70
EUR/JPY recently reversed down from the resistance zone lying between the strong resistance level 134.50 (which reversed the previous upward waves (i) and (b), as can be seen below) and the upper daily Bollinger Band. The downward reversal from this resistance zone stopped the previous minor impulse wave i. EUR/JPY is expected to fall to the next sell target at the next support level 131.70 (which has been reversing the pair from the end of September).

GX5cLZu.png


More:
https://fbs.com/analytics/articles/eur-jpy-reversed-from-resistance-zone-5553
 
EUR/USD Daily Analytics
11:41 07.12.2017

1512646830-4d7c8d58e0f5582f972a2ab20e30d86b_1200x1200_q90v3.png


Bears faced with support at 1.1772, so the price is consolidating. Nevertheless, the market is likely going to reach the next support at 1.1756 - 1.1734 in the short term. If a pullback from this area happens, there'll be an opportunity to have an upward price movement towards the next resistance at 1.1826 - 1.1859.

1512646830-a8faed94ef61f8fcb5383b21587c7ecb_1200x1200_q90v3.png


The price is consolidating between the levels 1.1772 - 1.1808. Also, there's a "Flag" pattern, so bears are likely going to test the closest support area at 1.1756 - 1.1734. Meanwhile, if a pullback from these levels happens, bulls will probably try to achieve another resistance at 1.1826 - 1.1836.


More:
https://fbs.com/analytics/articles/eur-usd-flag-pattern-5557
 
GBP/USD Daily Analytics
11:44 07.12.2017

1512646830-89a3abc0533d0f9b7229e34cca33834d_1200x1200_q90v3.png


The price is consolidating along the 34 Moving Average. Considering that there's a "Double Top" pattern, the market is likely going to test the closest support at 1.3336. If a pullback from this level happens little later on, we could have an upward price movement towards the next resistance at 1.3430 - 1.3454.

1512646829-c960202be754e01ea46ce9c84d889e25_1200x1200_q90v3.png


There's a "Pennant" pattern, so the pair is likely going to test the nearest support at 1.3336. However, if we have a pullback from this level, there'll be an opportunity to have a bullish price movement in the direction of the closest resistance at 1.3408 - 1.3430.

More:
https://fbs.com/analytics/articles/gbp-usd-pennant-pattern-5558
 
EUR/USD Daily Analytics
11:47 07.12.2017

1512647205-89877798acf1e51e8d61e32bacc9c95c_1200x1200_q90v3.png


There's still no any reversal pattern, cause all the last candles are bearish. So, the pair is likely going to continue moving down towards the closest support area, which could be a departure point for another upward price movement.

1512647205-d08fdc06f7c02d076fa27e20e794d137_1200x1200_q90v3.png


We've got a bearish "Three Methods" pattern, which pushed the market lower. So, the price is likely going to continue declining until any reversal pattern forms.

More:
https://fbs.com/analytics/articles/eur-usd-all-the-last-candles-are-bearish-5559
 
USD/JPY Daily Analytics
11:50 07.12.2017

1512647205-f5b12ff5ec005d4bf2a6409560226f8e_1200x1200_q90v3.png


The last "High Wave" pattern led to the current upward price movement. Meanwhile, if a pullback from the nearest resistance happens, we could have a downward correction towards the Moving Averages.

1512647205-824bd14f1f3d53d01a589cc82fdfe4d3_1200x1200_q90v3.png


There's still no any reversal pattern, so bulls are likely going to test the upper "Window" in the coming hours. If a pullback from this level happens afterwards, there'll be an opportunity to have a bearish correction

More:
https://fbs.com/analytics/articles/usd-jpy-high-wave-pattern-5560
 
Top