• The Forex, Binary Options Forum - welcomes you to our Community!

    DigitalCashPalace Forum is dedicated to discussions about Forex, Binary Options, commodities, stocks related.

    Please take a look around, and feel free to .

Market analysis and trade recommendations by FBS

EUR/USD Daily Analytics
07:41 17.11.2017
Recommendation:

BUY 1.1860

SL 1.1805 TP1 1.1960

TP2 1.2050

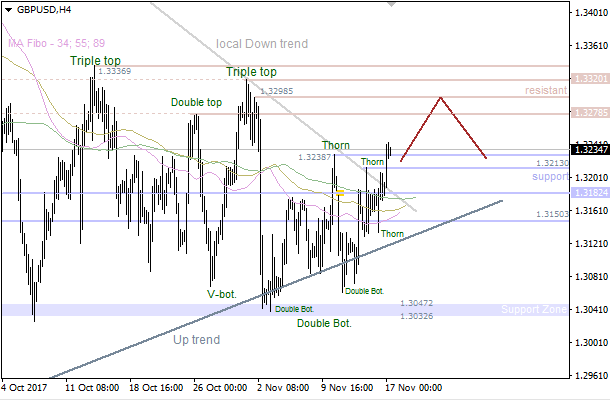
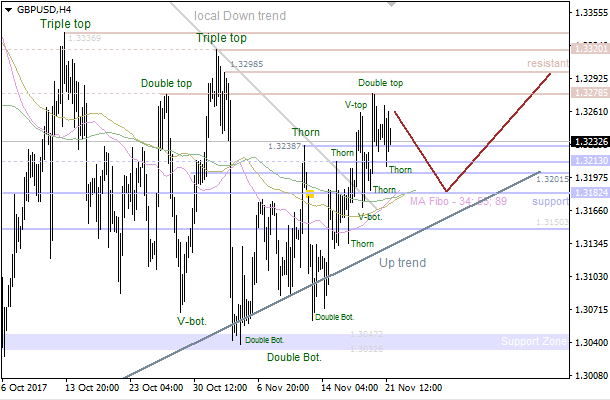
On the daily chart, bulls managed to lead the pair outside of the descending trend. If they manage to continue the attack and redraw November high, risks of 88.6% target of an inverted “Shark” pattern will significantly increase. It’s located near 1.2050.

1510904337-8afba167b3e7c15d0d5d28d0f3c7b966_1200x1200_q90v3.png


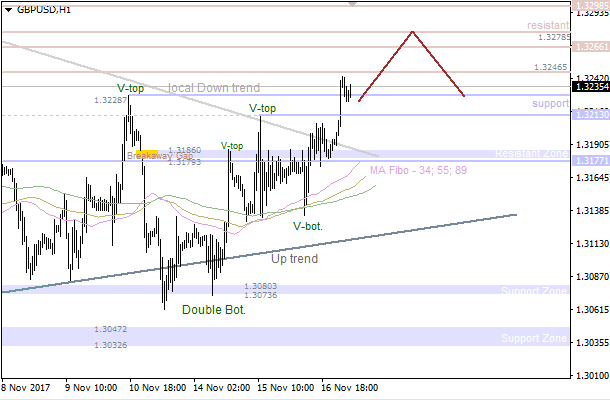
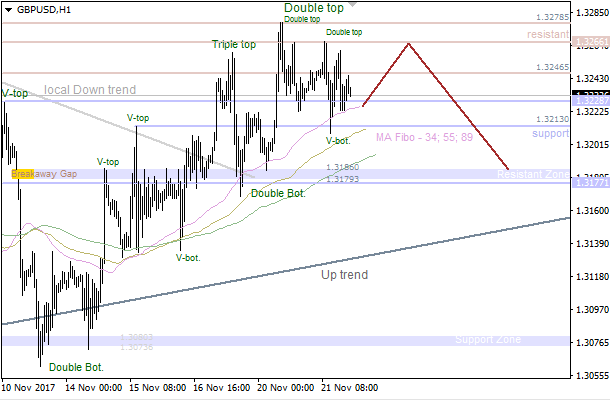
On H1, EUR/USD keeps forming a “Widening wedge”. Pullback towards 23.6% of the wave 4-5 allowed to form longs. A break of resistance at 1.1860 will provide an opportunity to add to bullish positions.

More:
https://fbs.com/analytics/articles/eur-usd-euro-is-returning-to-the-game-5143
 
EUR/GBP Daily Analytics
08:07 17.11.2017
Recommendation:

BUY 0.8875

SL 0.882

TP1 0.8975 TP2 91

On the daily chart, pin bar stopped the bulls’ attack for some time. Never the less, as long as the quotes are above the upper border of the uptrend, chances for the formation of a “Dragon” pattern are still high. To begin with, buyers should renew high at 0.9020.

1510905955-bc1ce4ebdd72b71af2881b8edc2b5fe5_1200x1200_q90v3.png


On H1, EUR/GBP keeps forming a “Crab”. Pullbacks to 50% of the last bullish wave with the following rebound of the uptrend channel’s lower border will be a signal for opening long positions.

1510905975-311438cdc50bb0f634d8ee27e47a0113_1200x1200_q90v3.png


More:
https://fbs.com/analytics/articles/eur-gbp-bulls-prepare-a-counterattack-5144
 
EUR/USD Daily Analytics
09:25 17.11.2017

1510910618-68b27dbec5dad18759faca723fa8568d_1200x1200_q90v3.png


Bears faced with support at 1.1767, so there's a bullish "V-Bottom" pattern, which pushed the price to the nearest resistance at 1.1836. The main intraday target is the next resistance at 1.1857, which could be a departure point for a bearish correction.

1510910618-8fbac18a55b5e4be68b1a886a19c8da8_1200x1200_q90v3.png


The 89 Moving Average has acted as support, so there's a "Triple Bottom" pattern, which led to the current consolidation. In this case, the pair is likely going to reach the closest resistance at 1.1836 - 1.1859 in the short term. If a pullback from this area happens a little later on, we could have a decline towards the nearest support at 1.1787 - 1.1767.

More:
https://fbs.com/analytics/articles/eur-usd-triple-bottom-pattern-5146
 
GBP/USDDaily Analytics
09:28 17.11.2017

1510910618-f52495cc1e082536841aeba60c2a4f88_1200x1200_q90v3.png


There's a bullish "Thorn", which led to forming a new local high. The main intraday target is the next resistance at 1.3278 - 1.3298. Meanwhile, if a pullback from these levels arrives afterwards, bears will probably try to reach another support at 1.3238 - 1.3213.

1510910618-2ef482238653d77f99d7c103cee22db4_1200x1200_q90v3.png


Bulls have broken the local downtrend line, so the price is rising. It's likely that the pair is going to achieve the next resistance at 1.3278 - 1.3298 during the day. This area could be a departure point for a bearish correction in the direction of the closest support at 1.3238 - 1.3213.

More:
https://fbs.com/analytics/articles/gbp-usd-bullish-thorn-5147
 
EUR/USD Daily Analytics
11:07 17.11.2017

1510916634-b26b08ffd96c36d7255be457f268c7c6_1200x1200_q90v3.png


There's a bullish "Doji", which has been confirmed, so the price is likely going to test the nearest resistance. If a pullback from this level happens, we could have just another decline towards the 89 Moving Average.

1510916633-286d3780d277cf770db5b13580c53130_1200x1200_q90v3.png


The upper "Window" has acted as resistance, so we've got a local decline. At the same time, there's a bullish "Doji", which means, the "Window" is likely going to be tested once again during the day.

More:
https://fbs.com/analytics/articles/eur-usd-bullish-doji-5150
 
USD/JPY Daily Analytics
11:10 17.11.2017

1510916634-69a8ce5fcf59145ebb250bd8ada0ae7f_1200x1200_q90v3.png


There's a bullish "Hammer", which has been formed at the last local low. The Moving Averages are acting as resistance. So, we could have just bullish correction and the following decline afterwards.

1510916634-3d75fc904add325153f593fb30d28f91_1200x1200_q90v3.png


We've got an "Inverted Hammer", but confirmation of this pattern is a quite weak. Therefore, the market is likely going to test the upper "Window" in the short term. If a pullback from this level happens, there'll be an opportunity to have just another decline.

More:
https://fbs.com/analytics/articles/usd-jpy-inverted-hammer-5151
 
EUR/USD Daily Analytics
11:18 17.11.2017

1510917430-80971c87cbd47ed92d76cbb51c2e7de4_1200x1200_q90v3.png


There's a developing bullish impulse, which could be wave . Also, we've got a pullback from 5/8 MM Level, so there's an opportunity to have wave (v) of . The main intraday target is 7/8 MM Level, which could be a departure point for wave [ii].

1510917430-0a8508b0ce9b94dd91b68095ca07d26f_1200x1200_q90v3.png


The 34 Moving Average has acted as support once again, so wave (iv) might have been formed. In this case, bulls are likely going to deliver wave (v) of in the coming hours. In this case, the high of wave (iii) will be broken pretty soon.

More:
https://fbs.com/analytics/articles/eur-usd-developing-bullish-impulse-5153
 
EUR/USD Daily Analytics
05:26 20.11.2017

1511155503-febc6acf7a838f325fd06b76d25b1f03_1200x1200_q90v3.png


There's a pullback from 6/8 MM Level, so wave might have been formed. In this case, we could have wave [ii] soon. If a pullback from 4/8 MM Level happens little later on, there'll be a green light for wave [iii].

1511155503-6fc9aef8a972244f8d049b07fc47c2c9_1200x1200_q90v3.png


Wave [ii] is likely going to take the form of a zigzag. If the market fixates above 4/8 MM Level during the day, bulls are likely going to deliver wave (i) of [iii].

More:
https://fbs.com/analytics/articles/eur-usd-pullback-from-6-8-mm-level-5180
 
NZD/USD Daily Analytics
07:46 20.11.2017
Recommendation:

SELL 0.6870

SL 0.6925

TP1 0.677 TP2 0.6625

On the daily chart, the inability of bulls to settle above 0.6907 and 0.6823 points at their weakness. The downtrend towards targets at 127.2% and 161.8% of the “Crab” pattern continues. A condition necessary for its break is the pair’s return to resistance at 0.6980.

1511163873-fb9be1d9d65d6402746f6573306cf53b_1200x1200_q90v3.png


On H1, NZD/USD triggering of the “Bat” pattern with the following test of resistance at 0.6825 will increase the risks of a move to 88.6%. At that level, it will be sensible to sell the pound.

1511163893-3696dc2326705fd45dfa7b732beb8b1e_1200x1200_q90v3.png


More:
https://fbs.com/analytics/articles/nzd-usd-kiwi-is-falling-in-the-abyss-5183
 
AUD/USD Daily Analytics
08:13 20.11.2017
Recommendation:

BUY 0.7495

SL 0.7440

TP1 0.7606 TP2 0.765

On the daily chart, AUD/USD after reaching 88.6% target of the “Shark” and a pullback to 23.6% of the wave CD, there was a resumption of a downtrend. The Australian dollar is heading to convergence area at $0.7495-0.7500 (113target of the “Shark” + 78.6% correction level), at which there are odds of a rebound.

1511165544-1db64c049cc9775b27418fd0e6b0833a_1200x1200_q90v3.png


On H1, an advance to 224% target of AB=CD creates an opportunity for aggressive longs. Conservative entry requires confirmation.

1511165556-ef00342837a633bda01cab6a3fe3e88f_1200x1200_q90v3.png


More:
https://fbs.com/analytics/articles/aud-usd-is-catching-falling-knives-5184
 
EUR/USD Daily Analytics
04:40 21.11.2017

1511238853-077c3b63ff6bb5a63120ec6a80df378b_1200x1200_q90v3.png


There's a pullback from 6/8 MM Level, so wave might have been formed. Therefore, the price is declining in wave [ii]. The main intraday target is 3/8 MM Level, which could be a departure point for wave [iii].

1511238853-a5c8a6d84ffc80ebd7e2e05bf4e66ef6_1200x1200_q90v3.png


As we can see on the one-hour chart, wave [ii] is taking the form of a zigzag, so wave (c) is likely going to move on towards 3/8 MM Level. In this case, we could have a new local low during the day.

More:
https://fbs.com/analytics/articles/eur-usd-wave-ii-taking-form-of-zigzag-5209
 
AUD/USD Daily Analytics
08:41 21.11.2017
Technical levels: support – 0.7480; resistance – 0.7560

Trade recommendations:

Sell — 0.7540; SL — 0.7560; TP1 — 0.7500; TP2 — 0.7480.
Buy — 0.7480; SL — 0.7460; TP1 — 0.7530; TP2 — 0.7550.
Reason: expanding bearish Ichimoku Cloud with falling Senkou Span A and B; a dead cross of Tenkan-sen and Kijun-sen, falling Tenkan-sen; the prices are made a new lows, but there is a strong support on 0.7480.

1511253705-42a68b4bfa2f0515dfbaa054e9dbae66_1200x1200_q90v3.png


More:
https://fbs.com/analytics/articles/aud-usd-aussie-reached-new-lows-but-near-main-support-5215
 
EUR/USD Daily Analytics
00:10 22.11.2017

1511309303-d7de3d93570e1056bd89773cb718c4f8_1200x1200_q90v3.png


There's a "Double Top" pattern, which has been confirmed, so the price is consolidating. The main intraday target is the 55 Moving Average. If a pullback from this line happens little later on, bulls will probably try to reach another resistance at 1.1743 - 1.1767.

1511309318-42603d3e81aab657bef28b7e0fc70598_1200x1200_q90v3.png


The price is consolidating between the Moving Averages, so there's a confirmed "Double Bottom" pattern. In this case, the market is likely going to reach the nearest resistance at 1.1767. This level could be a departure point for a decline towards the next support at 1.1712 - 1.1689.

More:
https://fbs.com/analytics/articles/eur-usd-double-top-pattern-5235
 
GBP/USD DAily Analytics
00:13 22.11.2017

1511309319-56fe7f2fb47064297f4c235bae99730e_1200x1200_q90v3.png


There's a consolidation, which is taking place between the levels 1.3278 - 1.3213. Also, we've got a bearish "Double Top", so the pair is likely going to test the closest support at 1.3201 - 1.3182 in the short term. If we have a pullback from these levels, there'll be an opportunity to have another upward price movement towards the next resistance at 1.3278 - 1.3298.

1511309319-9fe6a6a25bd1dfc8e412ff888d4c55f5_1200x1200_q90v3.png


The price is consolidating between the levels 1.3278 - 1.3213. The 34 Moving Average has acted as support, so the market is likely going to test the nearest resistance at 1.3246 - 1.3266. Meanwhile, if we see a pullback from this area, bears will probably try to test the closest support at 1.3186 - 1.3179.

More:
https://fbs.com/analytics/articles/gbp-usd-34-moving-average-acted-as-support-5236
 
[/B]EUR/USD Daily Analytics[/B]
01:48 22.11.2017

1511315232-4448dd85c18172069961be9ffa7bda85_1200x1200_q90v3.png


The 34 & 55 Moving Averages are acting as support, but there isn't any reversal pattern so far. In this case, the price is likely going to test the nearest support area once again. If a bullish pattern forms little later on, there'll be an opportunity to have an upward correction.

1511315232-a1579a45c0d4f621fbd09140898ecd25_1200x1200_q90v3.png


The price is consolidating between the Moving Averages. At the same time, there's a bearish "High Wave" pattern, so the price is likely going to break the last low in the coming hours.

More:
https://fbs.com/analytics/articles/eur-usd-34---55-ma-acting-as-support-5237
 
USD/JPY Daily analytics
01:51 22.11.2017

1511315232-a2e5ac30d591223c66c19453027d88c8_1200x1200_q90v3.png


The upper "Window" is acting as resistance, but there's a bullish "High Wave" pattern. In this case, the market is likely going to test the 55 Moving Average, which could be a departure point for another decline.

1511315232-5e62d18216c04358fbc5da4968a1ecc3_1200x1200_q90v3.png


There's a bullish "Engulfing", which has been formed at the last local low, but confirmation of this pattern isn't enough. The main intraday target is the 144 Moving Average, which could act as resistance soon.

More:
https://fbs.com/analytics/articles/usd-jpy-bullish-engulfing-pattern-5238
 
EUR/USD Daily Analytics
06:42 22.11.2017

1511332877-1acecde01c1e07248bb67ce100ba5a29_1200x1200_q90v3.png


Wave [ii] is still underway, so we should keep an eye on 3/8 MM level as the next bearish target. If a pullback from this level happens little later on, there'll be an opportunity to have an impulse in wave [iii].

1511332878-82c174b687644d9462a161c69dce2345_1200x1200_q90v3.png


There's a possible leading diagonal in wave (a). In this case, we could have wave (b) during the day. Nevertheless, bears are likely going to deliver wave (c) of [ii] afterwards.

More:
https://fbs.com/analytics/articles/eur-usd-leading-diagonal-in-wave-a-5242
 
USD/CHF Daily Analytics
07:08 22.11.2017
Recommendations:

BUY 0.9945

SL 0.989

TP1 1.0005 TP2 1.0045 TP3 1.0145

On the daily chart, USD/CHF came to the lowest border of the uptrend trade channel and important support in the 0.9882-0.9891 area. If bulls manage to push the pair above these levels, risks of the uptrend’s resumption towards 161.8% of AB=CD will increase.

1511334375-a5903a7f3cf43bc4f33886526fd841ba_1200x1200_q90v3.png


On H1, USD/CHF is retesting the neckline of “Head and Shoulders”. The pullback with the following successful test of resistance at 0.9940-0.9945 will trigger a “Crab” pattern with the target at 161.8%.

1511334404-351a015a31e5fdb2fee97b43bc66aebc_1200x1200_q90v3.png


More:
https://fbs.com/analytics/articles/usd-chf-bulls-are-in-defense-5243
 
GBP/USD Daily Analytics
07:24 22.11.2017
Recommendation:

BUY 1.3295

SL 1.3240

TP1 1.3415 TP2 1.352 TP3 1.3585

On The daily chart, GBP/USD approached the upper border of the 1.3045-1.3320 range, formed within “Spike and ledge” pattern. A successful test of resistance at 1.3320 will increase the risks of growth towards 1.3520 and 1.3585 with the following resumption of an uptrend.

1511335373-b6b56ed02b1869ac79ae2067aff9ca74_1200x1200_q90v3.png


On H1, GBP/USD reached the targets of the junior “Widening wedge”. A pullback to 38.2% of the wave 4-5 with the following return to 23.6% is usually used for buying. The test of resistance at 1.3295 will allow increasing longs.

1511335392-2cf183d9aa99dd882e50bd88c66a58cb_1200x1200_q90v3.png


More:
https://fbs.com/analytics/articles/gbp-usd-pound-is-cramped-in-the-corridor-5244
 
Top