Daily Forex Preview – 06/01
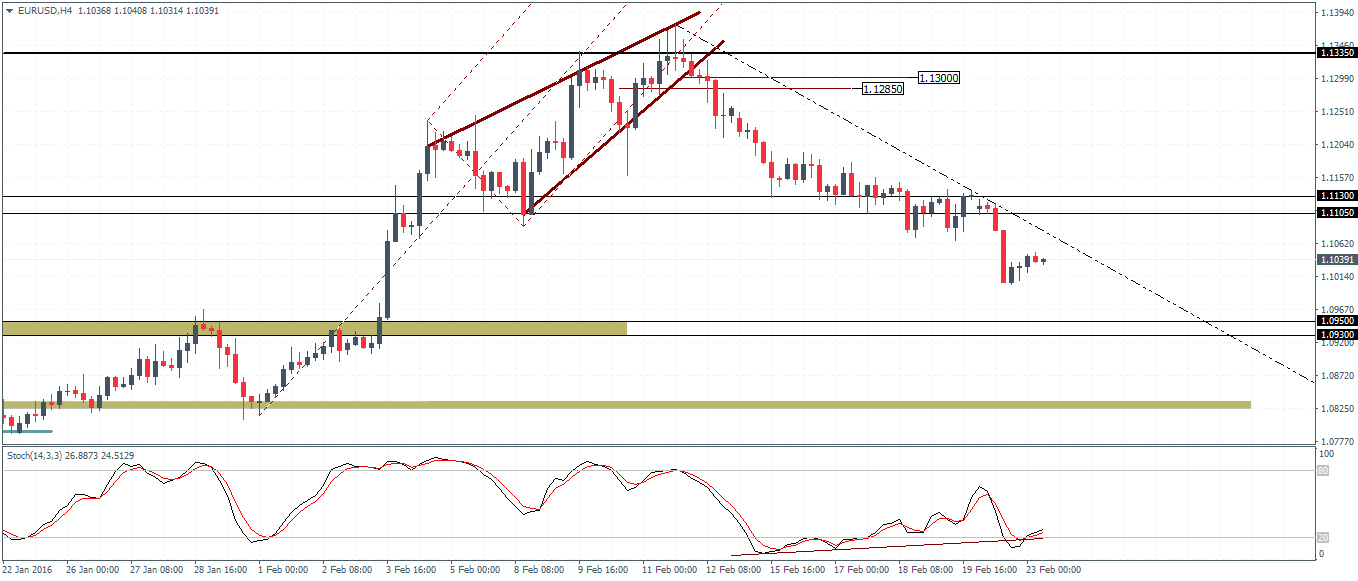
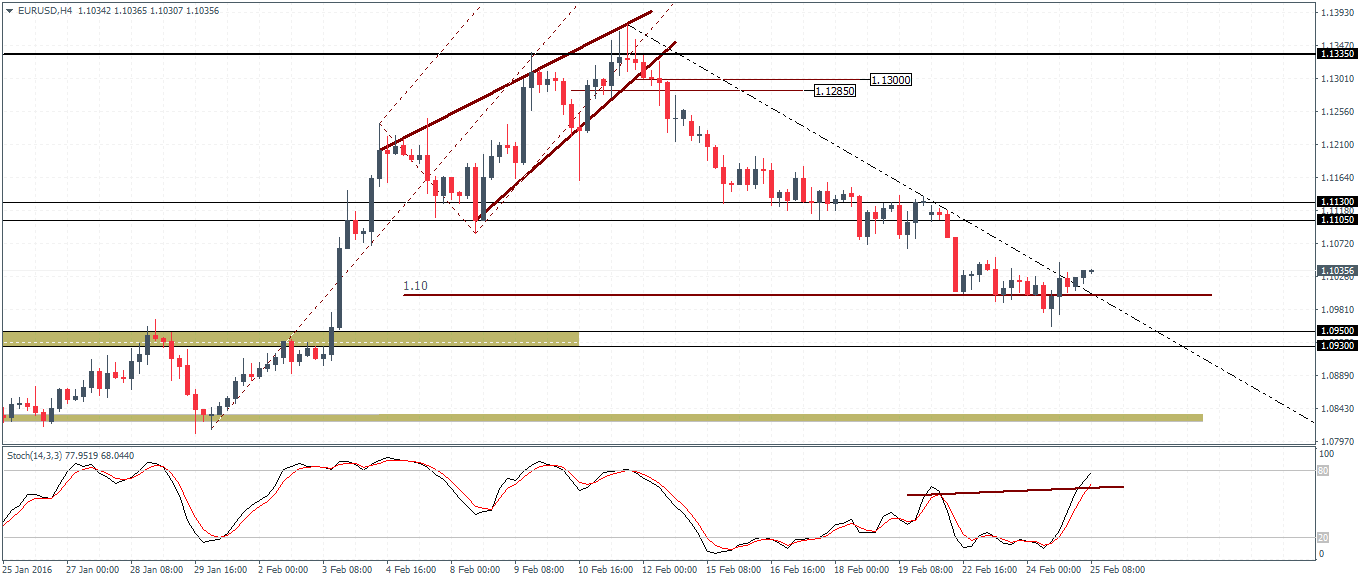
EURUSD Daily Pivots
R3 1.0948
R2 1.0893
R1 1.0820
Pivot 1.0765
S1 1.0692
S2 1.0637
S3 1.0564

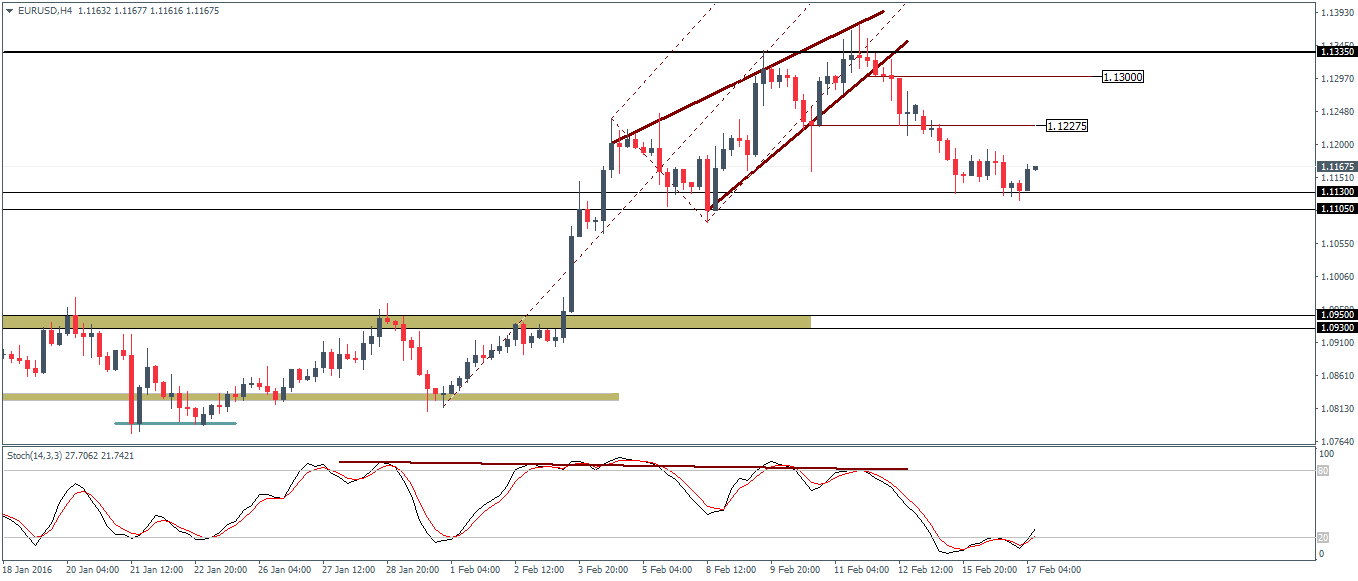
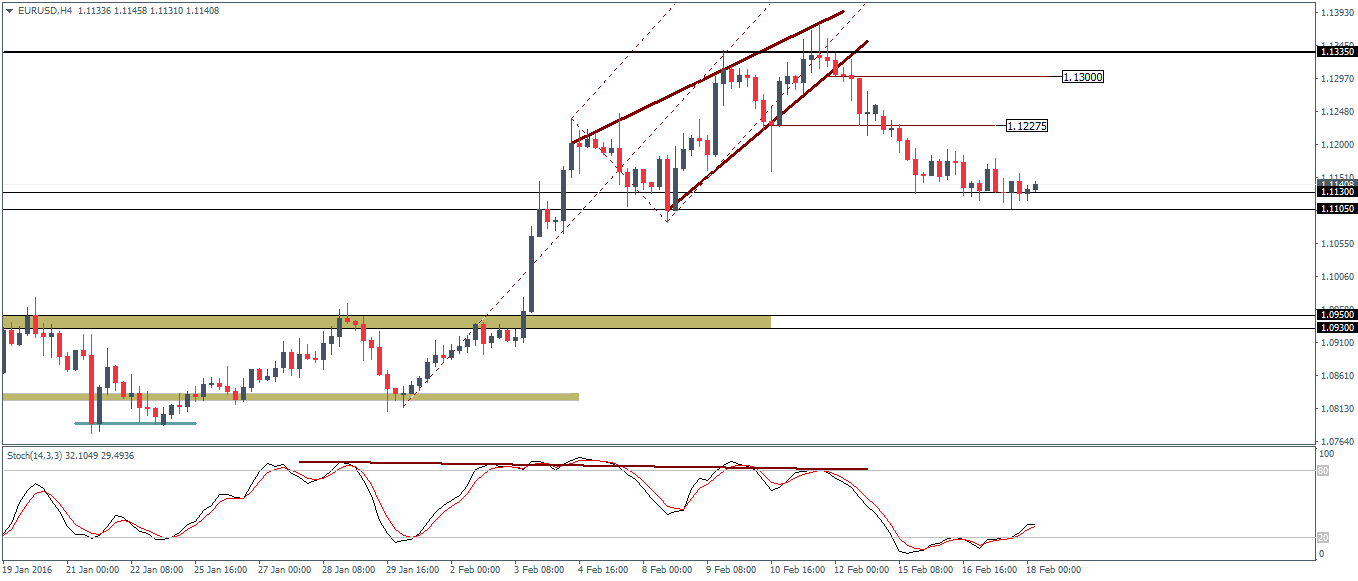
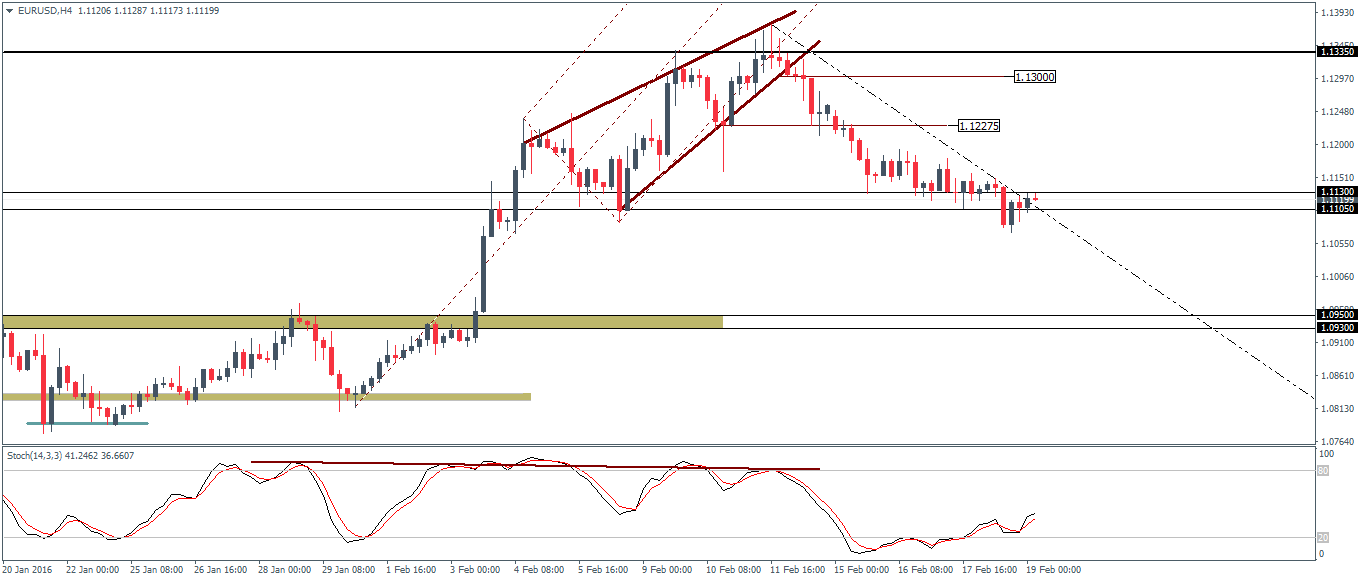
EURUSD (1.07): The EURUSD is now into its fourth day of declines after prices fell through off 1.093 level of resistance earlier on 31st December. With the support near 1.07 now a key level, price action could be looking to post a modest pull back to 1.0837 ahead of further declines. With the neckline of the head and shoulders being breached, the pull back to 1.0815 - 1.0837 could mark a retest of the neckline which could signal a continued move lower. Support near 1.0633 - 1.06 is key to the downside. A break below this support could, however, push EURUSD steeper into losses with 1.054 being the next level of support that could be tested. To the upside, in the event prices fail to be capped near the neckline support turned resistance, a move higher could potentially invalidate the head and shoulders pattern.
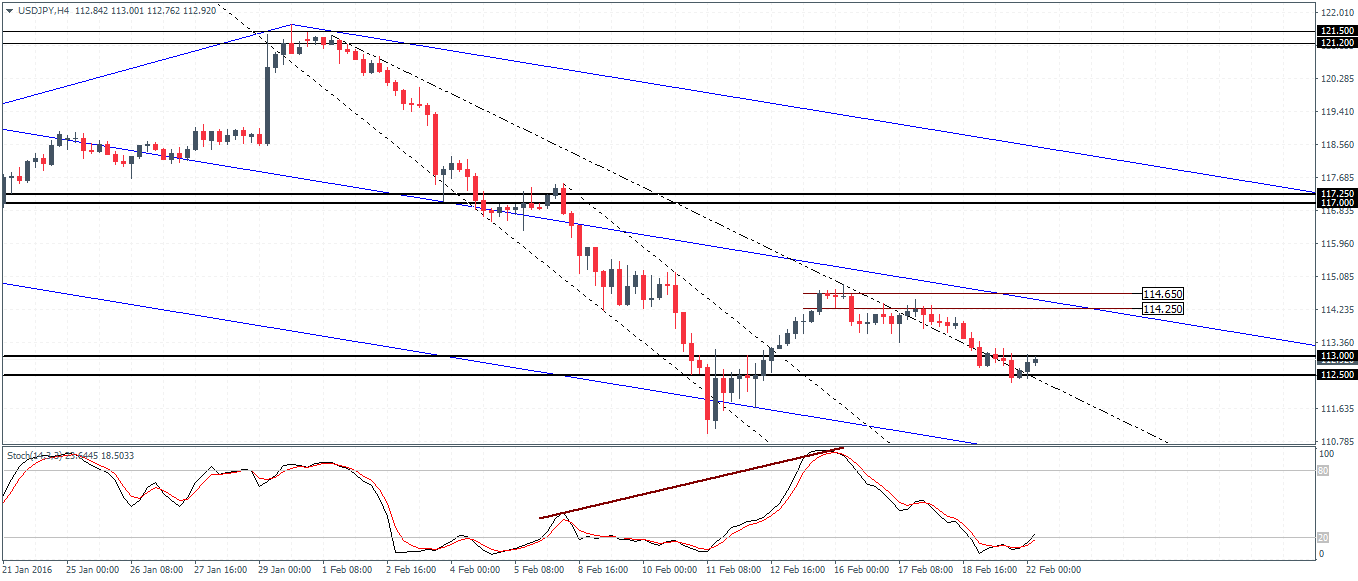
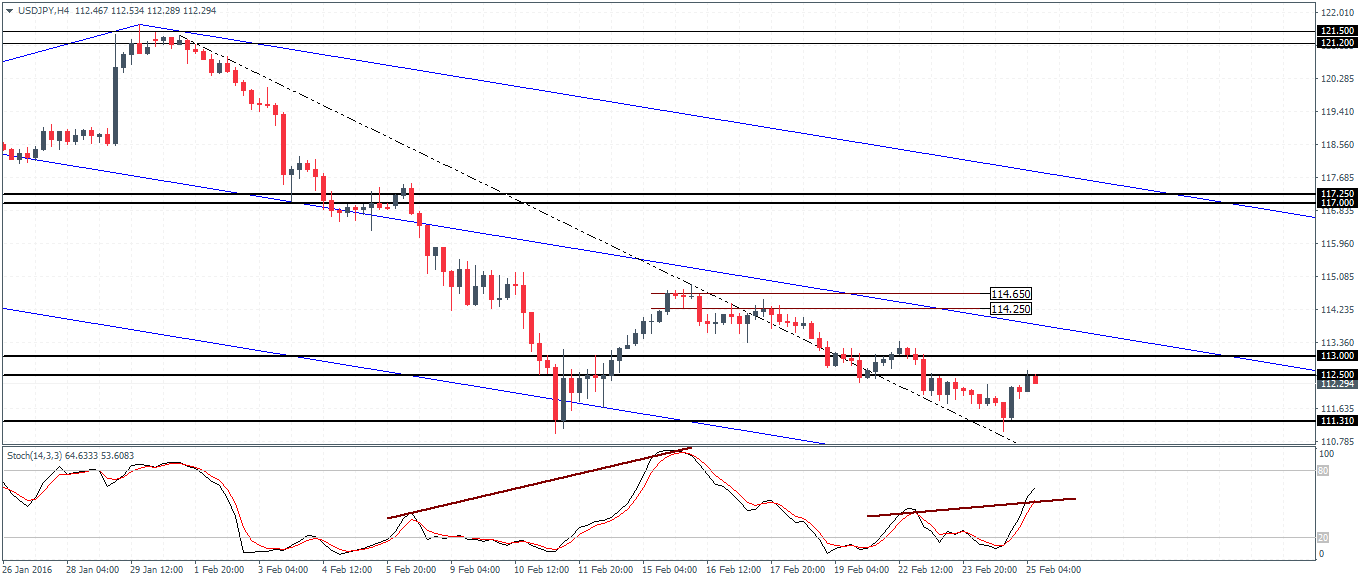
USDJPY Daily Pivots
R3 120.480
R2 120.084
R1 119.573
Pivot 119.178
S1 118.667
S2 118.271
S3 117.759

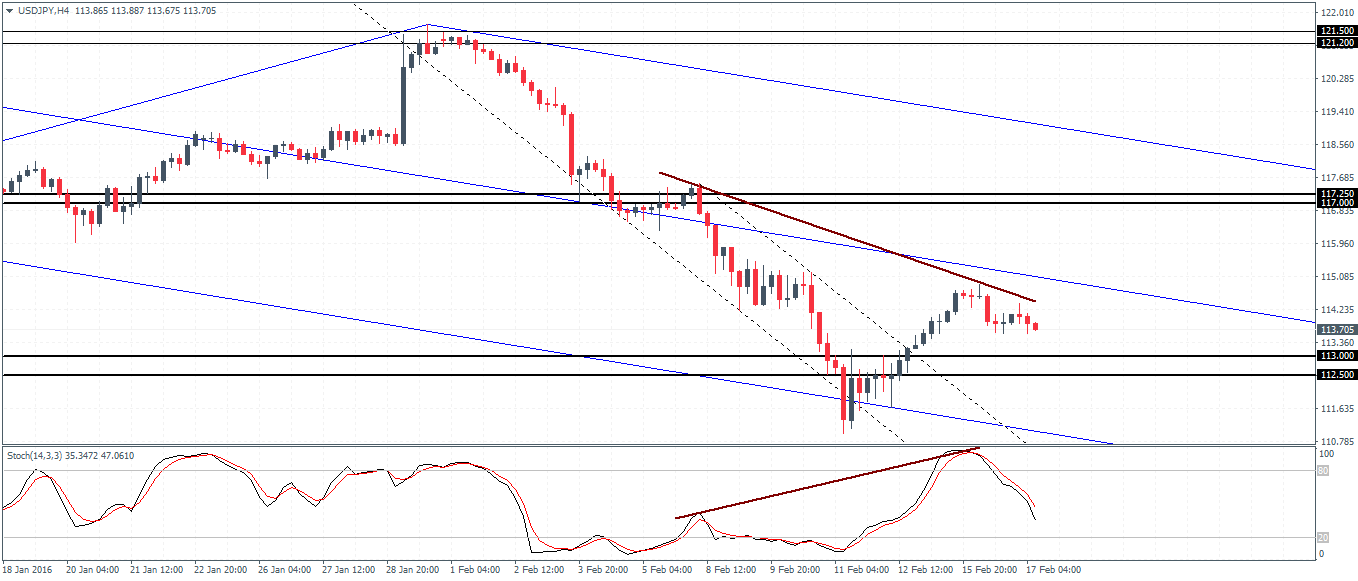
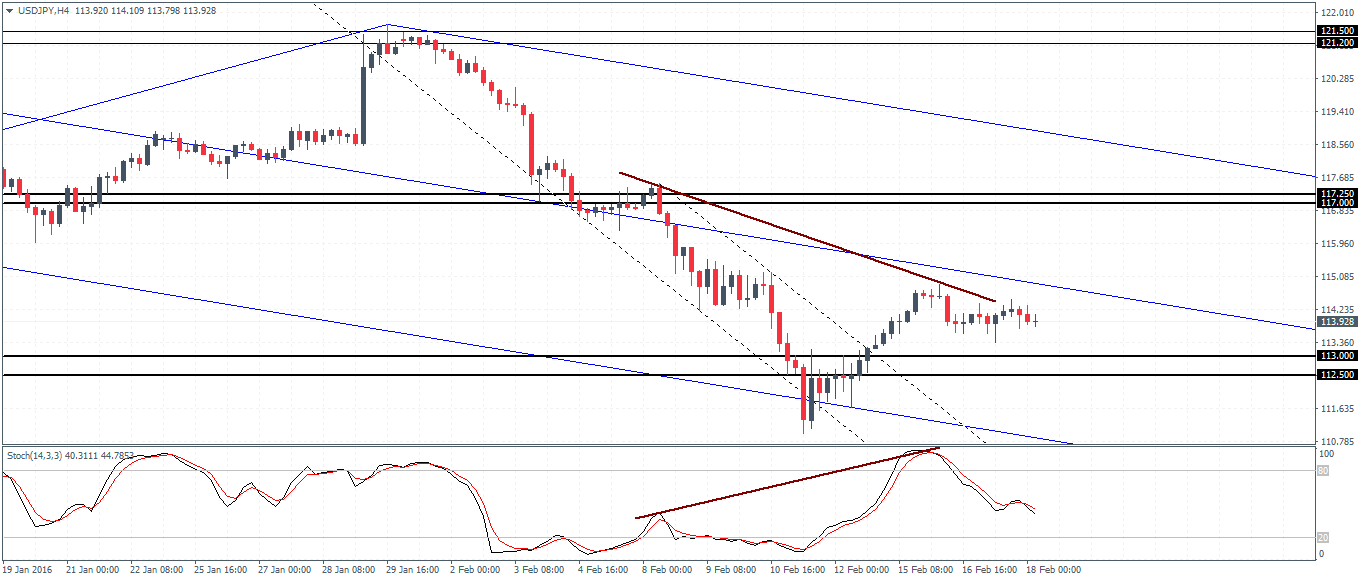
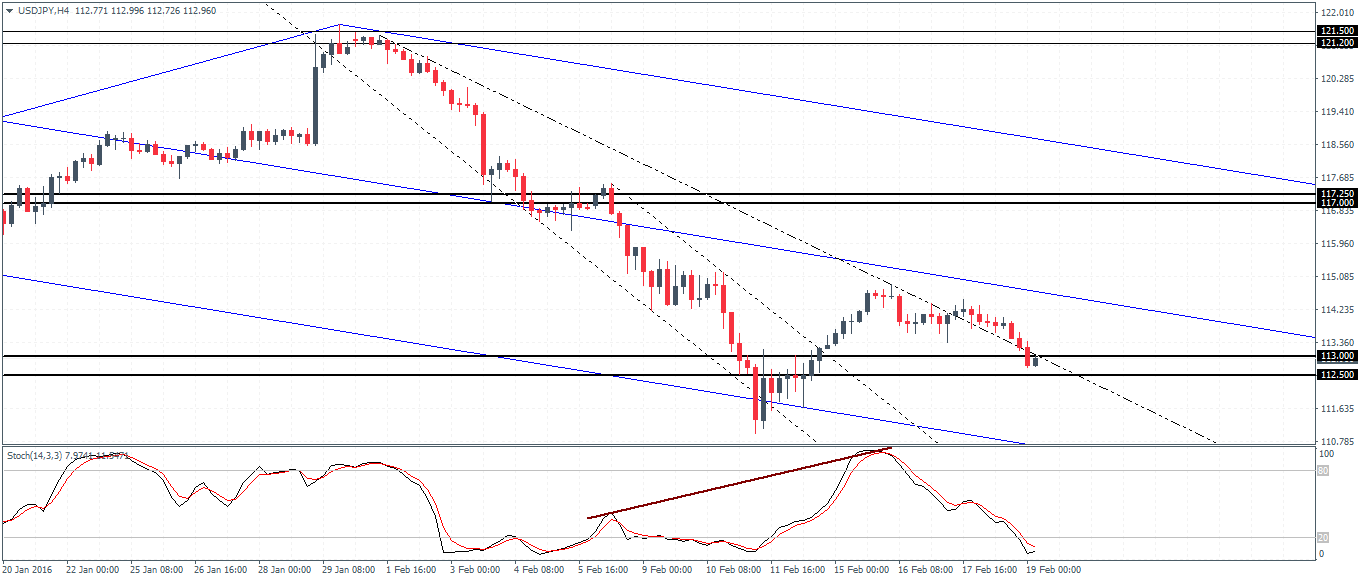
USDJPY (118.6): USDJPY posted another day of declines, marking a straight four days of a bearish momentum after prices posted a brief consolidation above 120.1. Support at 118.4 - 118.07 will be key as a break below this level on the daily chart could signal further downside. Plotting the new price channel, USDJPY has managed to post some bounces off the lower trend line of the price channel. However, a move above 119.145 is essential for any correction to be valid. The Stochastics still remains in the oversold area and the bearish divergence is starting to show up. Above 119.145 support, a move to 120.815 - 121.4 remains a key level to watch for.
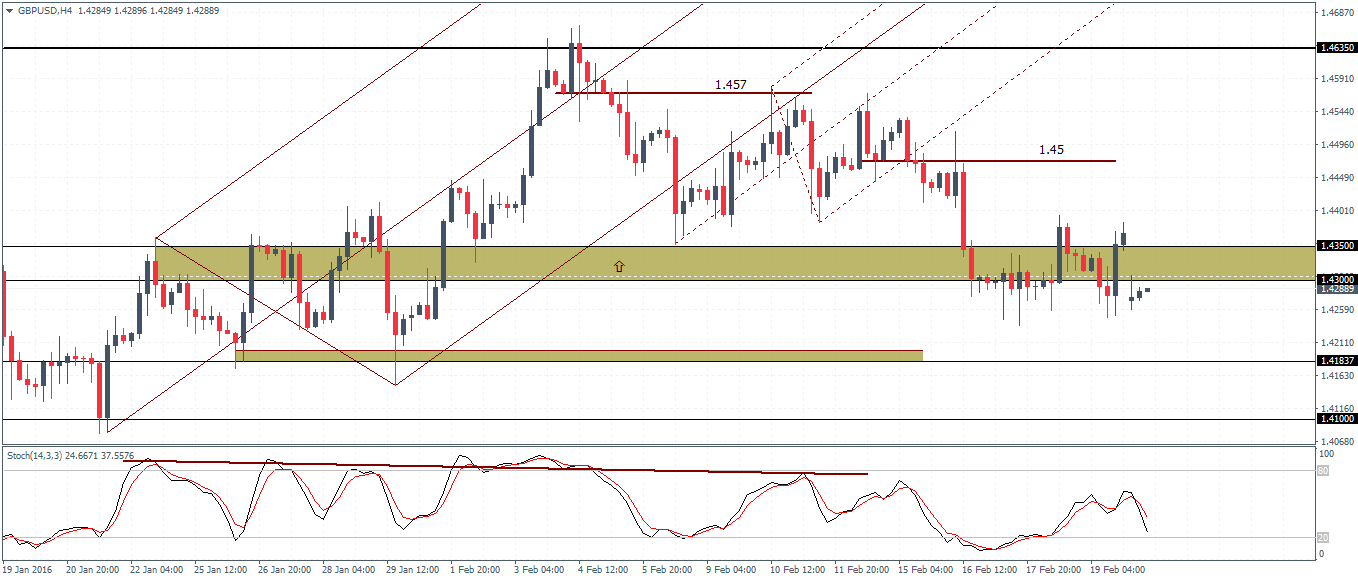
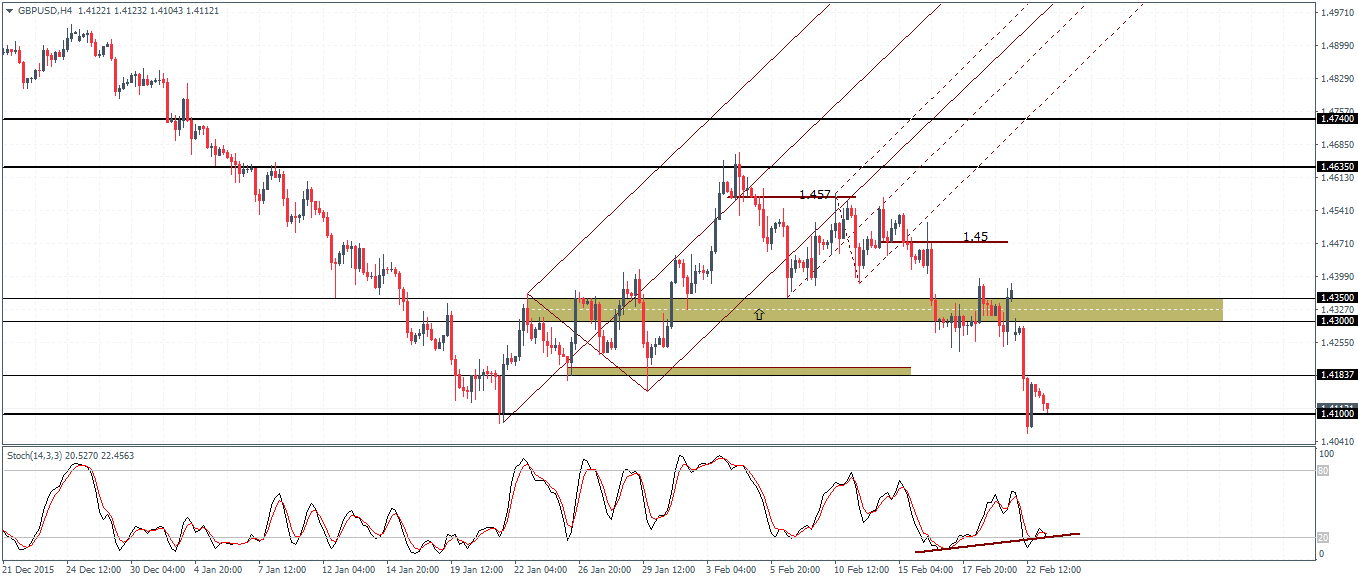
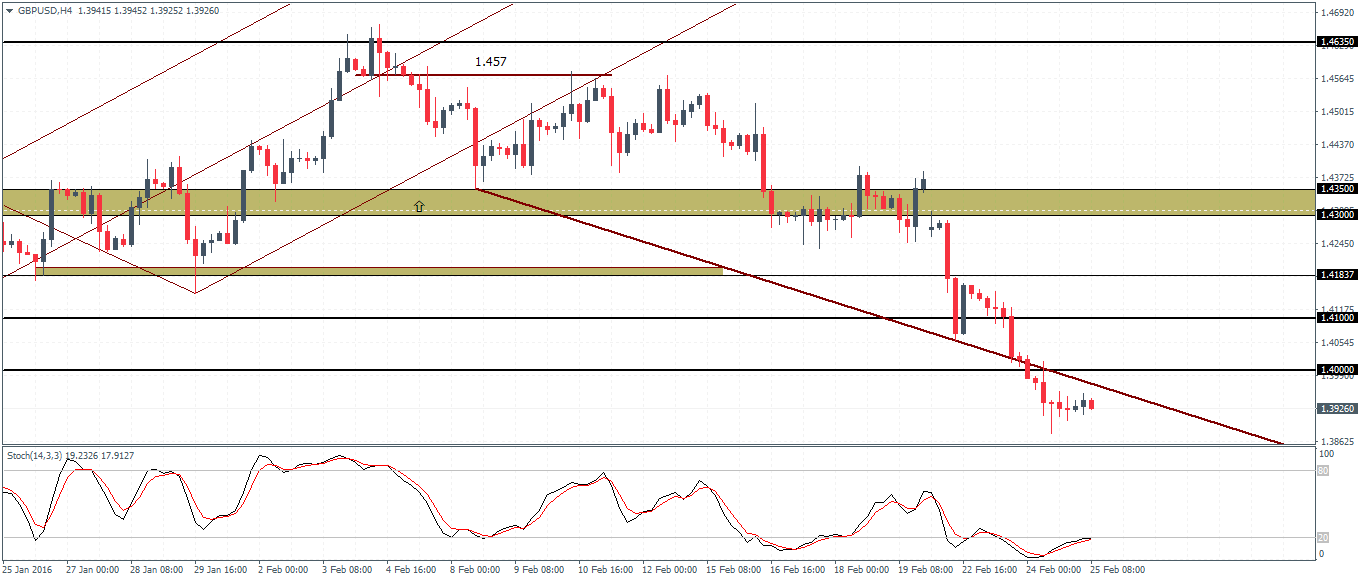
GBPUSD Daily Pivots
R3 1.4808
R2 1.4765
R1 1.4720
Pivot 1.4679
S1 1.4632
S2 1.4590
S3 1.4545

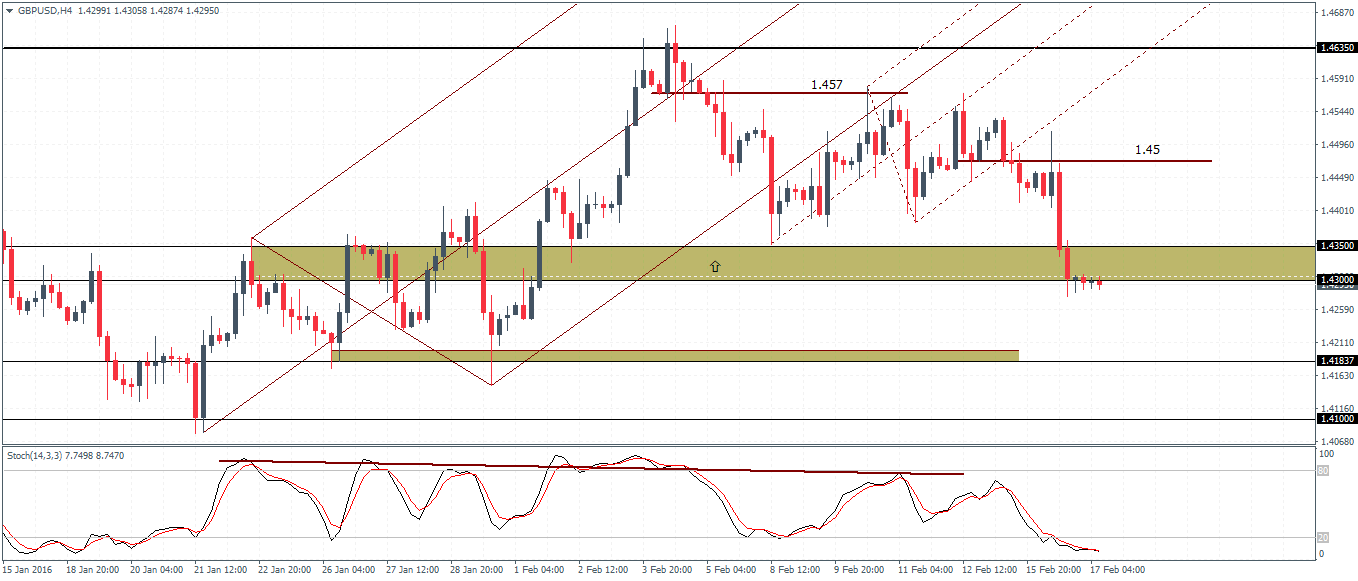
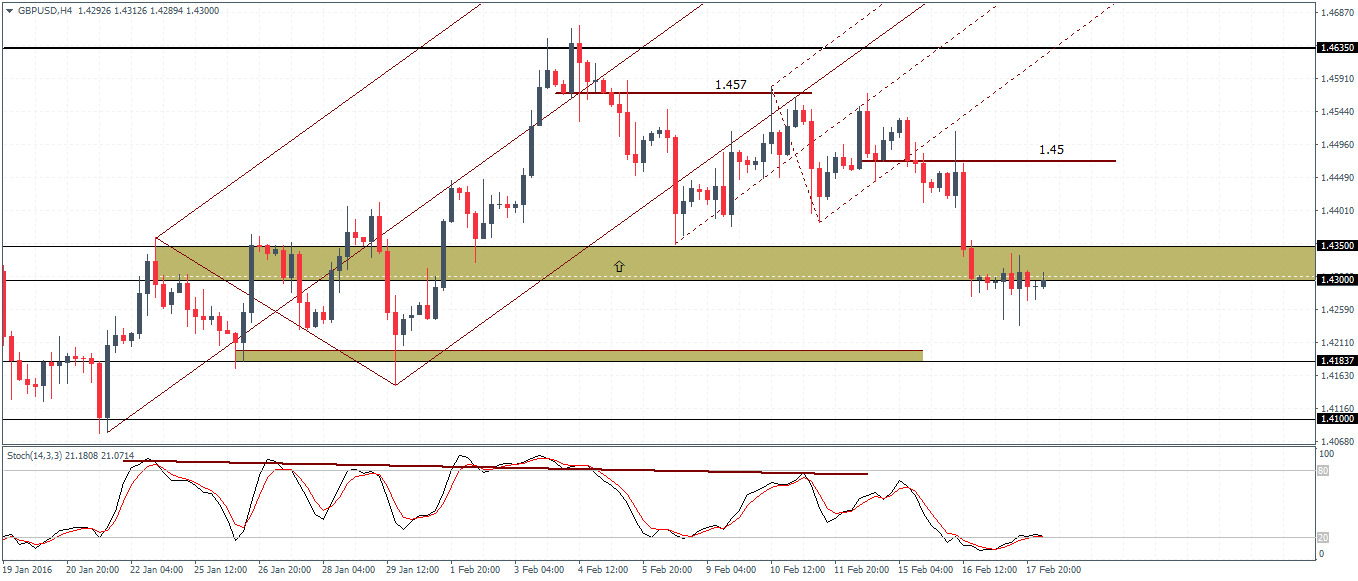
GBPUSD (1.46): GBPUSD is now trading near March 2015 lows at 1.465 in a steady decline and so far no evidence of any correction. Price action is however inside the support zone of 1.47 - 1.4635 which could offer some longer term bounce to the upside. The lows in price are not being confirmed by the Stochastics on the 4-hour chart, which could point to a move to the upside in the near term. 1.494 - 1.496 remains a key level to watch which could be tested for resistance if price manages to close above 1.47. To the downside, a break below 1.4635 could see prices test the next main round number at 1.46.
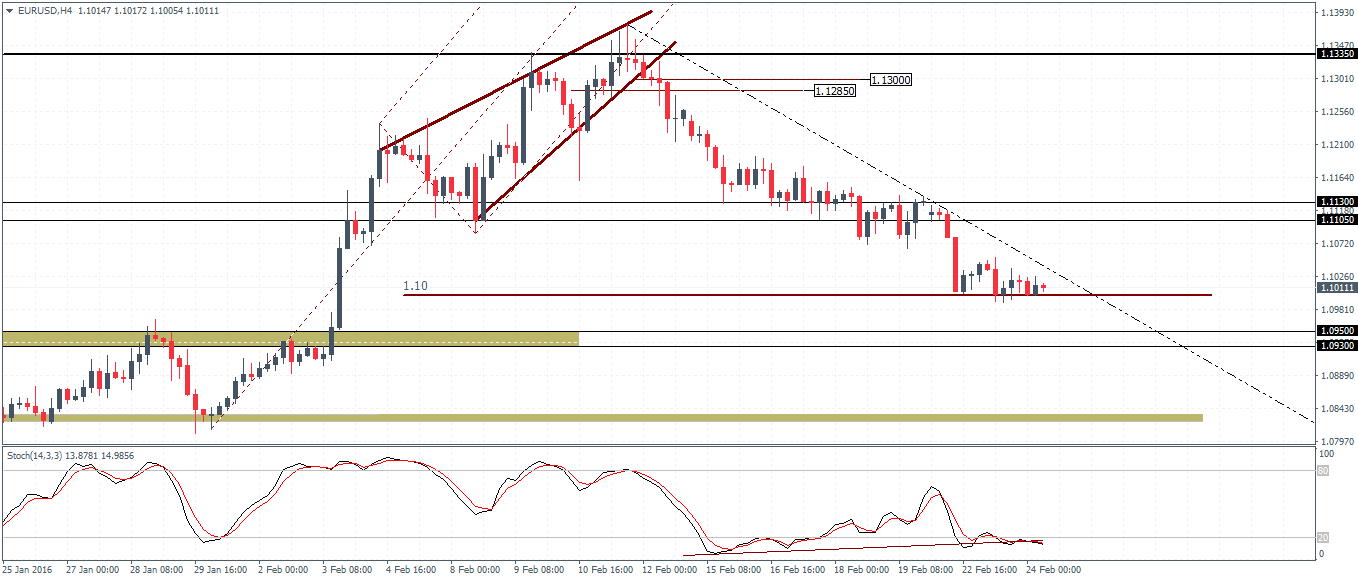
EURUSD Daily Pivots
R3 1.0948
R2 1.0893
R1 1.0820
Pivot 1.0765
S1 1.0692
S2 1.0637
S3 1.0564
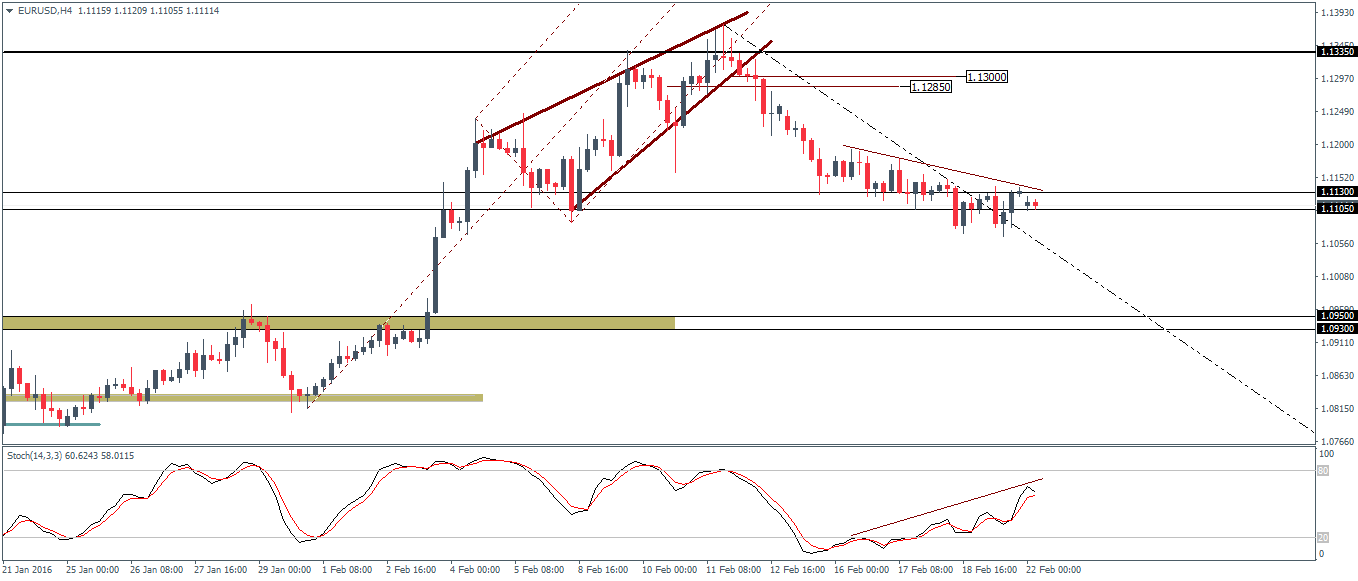
EURUSD (1.07): The EURUSD is now into its fourth day of declines after prices fell through off 1.093 level of resistance earlier on 31st December. With the support near 1.07 now a key level, price action could be looking to post a modest pull back to 1.0837 ahead of further declines. With the neckline of the head and shoulders being breached, the pull back to 1.0815 - 1.0837 could mark a retest of the neckline which could signal a continued move lower. Support near 1.0633 - 1.06 is key to the downside. A break below this support could, however, push EURUSD steeper into losses with 1.054 being the next level of support that could be tested. To the upside, in the event prices fail to be capped near the neckline support turned resistance, a move higher could potentially invalidate the head and shoulders pattern.
USDJPY Daily Pivots
R3 120.480
R2 120.084
R1 119.573
Pivot 119.178
S1 118.667
S2 118.271
S3 117.759
USDJPY (118.6): USDJPY posted another day of declines, marking a straight four days of a bearish momentum after prices posted a brief consolidation above 120.1. Support at 118.4 - 118.07 will be key as a break below this level on the daily chart could signal further downside. Plotting the new price channel, USDJPY has managed to post some bounces off the lower trend line of the price channel. However, a move above 119.145 is essential for any correction to be valid. The Stochastics still remains in the oversold area and the bearish divergence is starting to show up. Above 119.145 support, a move to 120.815 - 121.4 remains a key level to watch for.
GBPUSD Daily Pivots
R3 1.4808
R2 1.4765
R1 1.4720
Pivot 1.4679
S1 1.4632
S2 1.4590
S3 1.4545
GBPUSD (1.46): GBPUSD is now trading near March 2015 lows at 1.465 in a steady decline and so far no evidence of any correction. Price action is however inside the support zone of 1.47 - 1.4635 which could offer some longer term bounce to the upside. The lows in price are not being confirmed by the Stochastics on the 4-hour chart, which could point to a move to the upside in the near term. 1.494 - 1.496 remains a key level to watch which could be tested for resistance if price manages to close above 1.47. To the downside, a break below 1.4635 could see prices test the next main round number at 1.46.