DJIA: positive fundamental background
16/01/2020
Despite the fact that the signing of the “first phase” trade agreement between the United States and China has largely been won back by markets, investors enthusiastically welcomed this event.
US President Donald Trump called the deal a crucial and unprecedented step in relations with China, leading to "fair and mutually beneficial trade".
Speaking to reporters, Trump's economic adviser Larry Kudlow called the signed agreement the best deal ever made between the United States and China.
The United States agreed to lower duties on Chinese goods worth $ 120 billion to 7.5% and to cancel the previously planned introduction of new duties on imports from China.
Meanwhile, as Trump had previously stated, the remaining fees will be used in working out the “second phase” agreement.
If, in the course of fulfilling the obligations undertaken, one of the parties violates them, then the infringed party will be entitled to take “proportional measures of protection”, which, in essence, means the restoration of duties.
So far, markets have ignored the likelihood of possible complications during the elaboration of the “second stage” of the trade agreement.
As the Beige Book published last Wednesday, the U.S. economy continued to grow at a moderate pace in the last six weeks of 2019. “Expectations regarding short-term prospects remain moderately favorable in the country”, the Fed said.
Thus, the fundamental factor speaks in favor of the further growth of US stock indices and the DJIA index as well.
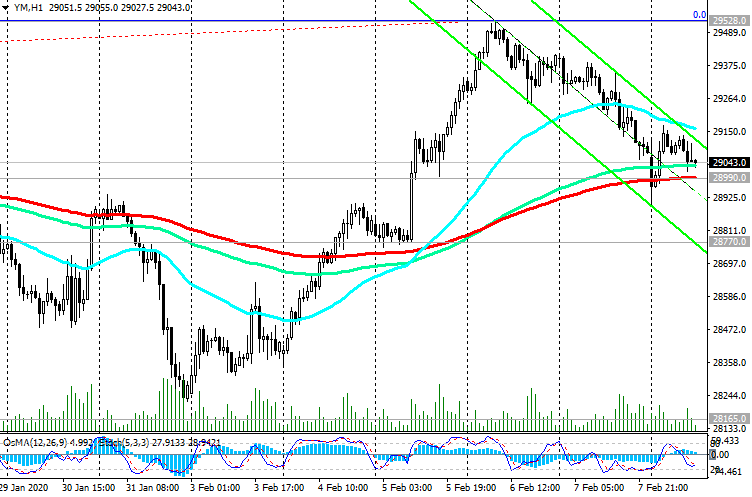
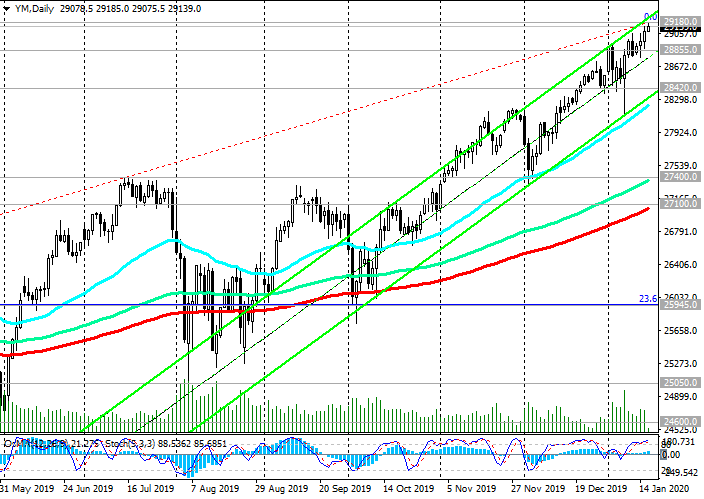
In an alternative scenario, the first signal for sales will be a breakdown of the short-term support level of 28855.0 (EMA200 on the 1-hour chart). In case of further decline, the targets will be the support levels 28420.0 (EMA200 on the 4-hour chart), 27400.0 (EMA144 on the daily chart), 27100.0 (EMA200 on the daily chart). Above the key support levels of 27400.0, 27100.0, the long-term upward dynamics of the DJIA remains.
Support Levels: 28855.0, 28420.0, 28000.0, 27400.0, 27100.0, 25945.0, 25050.0, 24600.0, 23970.0
Resistance Levels: 29180.0
Trading Scenarios
Buy Stop 29205.0. Stop-Loss 28850.0. Take-Profit 29300.0, 30000.0
Sell Stop 28850.0. Stop-Loss 29205.0. Take-Profit 28420.0, 28000.0, 27400.0

*) For up-to-date and detailed analytics and news on the forex market visit Tifia Forex Broker website tifia.com
16/01/2020
Despite the fact that the signing of the “first phase” trade agreement between the United States and China has largely been won back by markets, investors enthusiastically welcomed this event.
US President Donald Trump called the deal a crucial and unprecedented step in relations with China, leading to "fair and mutually beneficial trade".
Speaking to reporters, Trump's economic adviser Larry Kudlow called the signed agreement the best deal ever made between the United States and China.
The United States agreed to lower duties on Chinese goods worth $ 120 billion to 7.5% and to cancel the previously planned introduction of new duties on imports from China.
Meanwhile, as Trump had previously stated, the remaining fees will be used in working out the “second phase” agreement.
If, in the course of fulfilling the obligations undertaken, one of the parties violates them, then the infringed party will be entitled to take “proportional measures of protection”, which, in essence, means the restoration of duties.
So far, markets have ignored the likelihood of possible complications during the elaboration of the “second stage” of the trade agreement.
As the Beige Book published last Wednesday, the U.S. economy continued to grow at a moderate pace in the last six weeks of 2019. “Expectations regarding short-term prospects remain moderately favorable in the country”, the Fed said.
Thus, the fundamental factor speaks in favor of the further growth of US stock indices and the DJIA index as well.
In an alternative scenario, the first signal for sales will be a breakdown of the short-term support level of 28855.0 (EMA200 on the 1-hour chart). In case of further decline, the targets will be the support levels 28420.0 (EMA200 on the 4-hour chart), 27400.0 (EMA144 on the daily chart), 27100.0 (EMA200 on the daily chart). Above the key support levels of 27400.0, 27100.0, the long-term upward dynamics of the DJIA remains.
Support Levels: 28855.0, 28420.0, 28000.0, 27400.0, 27100.0, 25945.0, 25050.0, 24600.0, 23970.0
Resistance Levels: 29180.0
Trading Scenarios
Buy Stop 29205.0. Stop-Loss 28850.0. Take-Profit 29300.0, 30000.0
Sell Stop 28850.0. Stop-Loss 29205.0. Take-Profit 28420.0, 28000.0, 27400.0
*) For up-to-date and detailed analytics and news on the forex market visit Tifia Forex Broker website tifia.com