• The Forex, Binary Options Forum - welcomes you to our Community!

    DigitalCashPalace Forum is dedicated to discussions about Forex, Binary Options, commodities, stocks related.

    Please take a look around, and feel free to .

Market analysis and trade recommendations by FBS

USD/CAD: LOONIE IS BREAKING THE TREND
07:34 05.10.2017

Recommendation:

BUY 1.2595

SL 1.254

TP1 1.2715 TP2 1.292 TP3 1.325

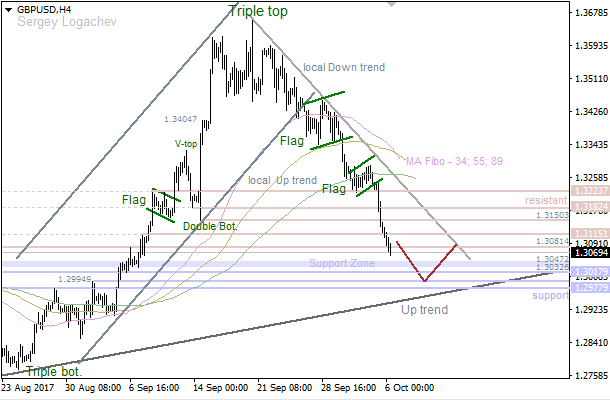
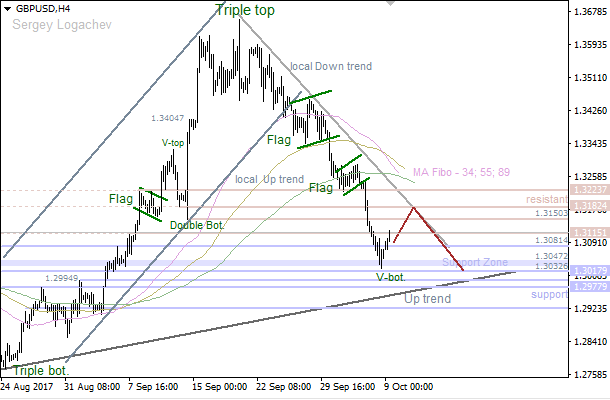
On the daily chart, USD/CAD bulls managed to overcome resistance at 1.2462. If they manage to conquer the level of 1.2717, the risks of an inverted “Shark” pattern will significantly increase. Its 88.6% target is at 1.3250.

1507188790-1430b06b52ccdf0a9e951da31344610e_1200x1200_q90v3.png


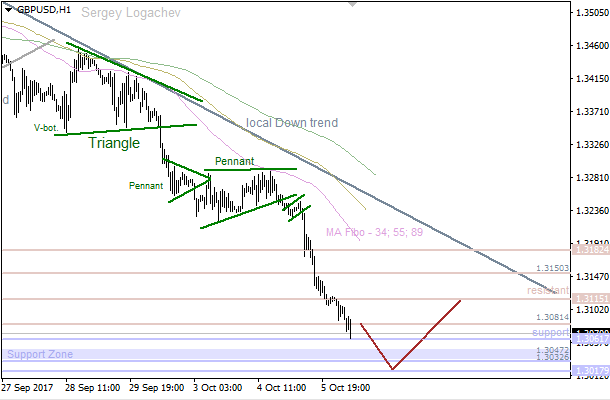
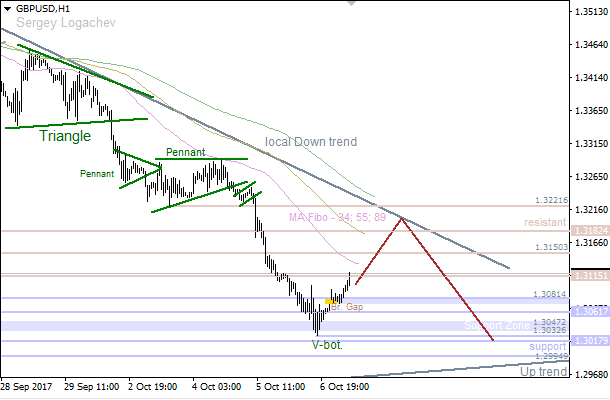
On H1, a break of resistance at 1.2533 will open the way to 1.2595 (88.6% of the last descending wave + 161.8% target of AB=CD). A successful test of this level will allow bulls to continue the rally.

1507188806-5c726ce87bf89e31cdcfbd4c37b26a4a_1200x1200_q90v3.png


More:
https://fbs.com/analytics/articles/usd-cad-loonie-is-breaking-the-trend-4201
 
EUR/USD: PRICE GOING TO REACH 89 MA
08:43 05.10.2017

1507192901-4938ebec59430e105af4bd49c6c3d66e_1200x1200_q90v3.png


The price is consolidating between the levels 1.1739 - 1.1793. It's likely that the market is going to test the 34 Moving Average during the day. If a pullback from this line happens later on, we could have just another decline towards the nearest support area at 1.1714 - 1.1688.

1507192901-1ad939a737431b8c3c31ed3f9cecb03b_1200x1200_q90v3.png


The 55 Moving Average has acted as resistance, so the price is consolidating. However, the price is likely going to reach the 89 MA, which could be a departure point for another decline.

More:
https://fbs.com/analytics/articles/eur-usd-price-going-to-reach-89-ma-4202
 
GBP/USD: "PENNANT" PATTERN
08:45 05.10.2017

1507192901-987d19d723a49f6df29828d5f0cd1b25_1200x1200_q90v3.png


Bears faced with support at 1.3223, so the price is consolidating near the 89 Moving Average. Also, there's a "Flag" pattern, so the market is likely going to reach the nearest support st 1.3182 - 1.3150 in the short term. If a pullback from these levels happens little later on, there'll be an opportunity to have an upward price movement towards the next resistance at 1.3278.

1507192901-382982e2f43883bd5ea49bac53e4e457_1200x1200_q90v3.png


We've got a "Pennant" pattern, which lower side has been broken. So, the pair is likely going to achieve the next support at 1.3182 - 1.3150. However, if we see a pullback from this area, bulls will probably try to test the 34 Moving Average.

More:
https://fbs.com/analytics/articles/gbp-usd-pennant-pattern-4203
 
EUR/USD: LEADING DIAGONAL IN WAVE (I)
08:53 05.10.2017

1507193548-9239f1fd487b817621f49c4e17b98474_1200x1200_q90v3.png


The price faced with support on 0/8 MM Level, so wave 4 may have been ended as a zigzag pattern. In this case, we're likely going to have an upward impulse in wave , so we should keep an eye on 3/8 MM Level as the nearest bullish target.

1507193548-0169c4f5ccb2d95e2e62d79ad5ce916c_1200x1200_q90v3.png


There's a leading diagonal in wave (i), but wave (ii) hasn't been finished yet. So, the pair is likely going to test 0/8 MM Level, which could be a departure point for wave (iii) of .

More:
https://fbs.com/analytics/articles/eur-usd-leading-diagonal-in-wave-i-4204
 
USD/JPY: 144 MA GOING TO ACT AS SUPPORT
11:49 05.10.2017

1507204127-3835456c32d22c378aa6361867af9a3e_1200x1200_q90v3.png


The price is consolidating above the "Window", which is likely going to act as support once again soon. If a pullback from the 34 Moving Average happens, there'll be an opportunity to have another upward price movement.

1507204128-0e06201180c4bc75479a08b88adaae05_1200x1200_q90v3.png


There's a "Shooting Star", so the price is declining. Also, there isn't any reversal pattern so far. The 144 Moving Average is likely going to act as support. If so, bulls will probably try to deliver another rally.

More;
https://fbs.com/analytics/articles/usd-jpy-144-ma-going-to-act-as-support-4205
 
EUR/USD: DEVELOPING "THREE BLACK CROWS"
11:51 05.10.2017

1507204127-4e57fb0e6f4b923b7abebcc657ed0671_1200x1200_q90v3.png


There's a bullish "Engulfing", which has been confirmed by the last "Three Methods" pattern. So, the 34 Moving Average is likely going to act as resistance in the short term. If a pullback from this line happens, we could have another decline soon.

1507204127-ae928d518ea7ea539d16c7cdf7d67443_1200x1200_q90v3.png


It's likely that there's a developing "Three Black Crows" pattern. If it confirms, bears are likely going to test the closest support area, which could be a departure point for an upward price movement towards the Moving Averages.

More:
https://fbs.com/analytics/articles/eur-usd-developing-three-black-crows-4206
 
EUR/USD IS BUILDING A FORTRESS
07:17 06.10.2017
Recommendation:

BUY 1.1595

SL 1.1540

TP 1.1710

On the daily chart, EUR/USD fell below 1.17 (88.6% target of the “Shark” pattern). Bulls are ready to test support at 1.1685 (23.6% of the last bullish wave). Success will open the way to 113% target of the “Shark”

1507274178-8afba167b3e7c15d0d5d28d0f3c7b966_1200x1200_q90v3.png


On H1, a break below an important support at 1.1710 increased the risks of continuation to the downside to 1.1595-1.1605 (200% and 113% of AB=CD and “Shark”). If the euro gets there, it will create grounds for a pullback.

1507274192-144c086f9efd0dd7367f2818eb875c0e_1200x1200_q90v3.png


More:
https://fbs.com/analytics/articles/eur-usd-is-building-a-fortress-4226
 
EUR/GBP: BULLS ARE RESUMING THE TREND
07:39 06.10.2017

Recommendation:

BUY 0.8945

SL 0.889

TP1 0.902 TP2 0.9085

On the daily chart, EUR/GBP keeps forming the invested “Shark” pattern and resuming the uptrend. A break of diagonal resistance and settling above 0.8929 will increase the risks of reaching 88.6% and 113% targets.

1507275468-bc1ce4ebdd72b71af2881b8edc2b5fe5_1200x1200_q90v3.png


On H1, EUR/GBP after reaching the targets of the reversal pattern “Widening wedge” started an uptrend. A beak of resistance at 0.8945 will be a signal for continuation to the upside towards the targets marked at the senior timeframe.

1507275501-311438cdc50bb0f634d8ee27e47a0113_1200x1200_q90v3.png


More:
https://fbs.com/analytics/articles/eur-gbp-bulls-are-resuming-the-trend-4228
 
EUR/USD: PRICE GOING TO TEST NEAREST SUPPORT
09:05 06.10.2017

1507280663-cae9c567b90faa6d5dfcd99ed9e4a329_1200x1200_q90v3.png


The price is consolidating near the 34 Moving Average, so bears are likely going to reach the nearest support at 1.1661 - 1.1612. If a pullback from this area happens, we could have another upward price movement towards the closest resistance at 1.1688 - 1.1714.

1507280663-f1df67da9d626643fa9fbd6bc65c8867_1200x1200_q90v3.png


There's a consolidation, which is taking place between the levels 1.1688 - 1.1714. It's likely that the pair is going to test the next support at 1.1661 - 1.1639 during the day. Meanwhile, if we see a pullback from these levels, bulls will probably try to achieve another resistance at 1.1688 - 1.1695.

More:
https://fbs.com/analytics/articles/eur-usd-price-going-to-test-nearest-support-4230
 
GBP/USD: BEARS CAN'T STOP
09:08 06.10.2017

1507280663-899df55621060d3deb995c9ff859e150_1200x1200_q90v3.png


Bears faced with support at 1.3081, but the market is likely going to test the next support at 1.3017 - 1.2994 in the short term. If a pullback from this area happens, we could have a bullish price movement towards the nearest resistance area at 1.3081 - 1.3115.

1507280663-0664cd4cf460926680c14b9eaf8f957d_1200x1200_q90v3.png


The price is still declining. The main bearish target is the nearest support at 1.3017 - 1.2994. If a pullback from this area happens little later on, there'll be an opportunity to have a bullish price movement in the direction of the closest resistance at 1.3081 - 1.3115.

More:
https://fbs.com/analytics/articles/gbp-usd-bears-cant-stop-4231
 
US NONFARM PAYROLLS: FORECASTS FROM BANKS
10:28 06.10.2017

The United States will release labor market data at 15:30 MT time today. According to the consensus forecast, American economy added in September only 88K of new jobs after gaining 156K in August. The reason for weak expectations in the Harvey hurricane. Apart from NFP, America will also release average hourly earnings and unemployment rate. Let’s see what outcome do the major banks envisage.

1507285654-c4aa45cf9797a892ee3799c5658059b7_1200x1200_q90v3.png


More:
https://fbs.com/analytics/articles/us-nonfarm-payrolls-forecasts-from-banks-4232
 
EUR/USD: "ENGULFING" AND "HAMMER"
12:12 06.10.2017

1507291883-90c0e2ef77e3283cbeb6575edf9bada1_1200x1200_q90v3.png


We've got a bullish "High Wave", which hasn't been confirmed enough. So, we could have just a local upward correction in the short term. If a pullback from the nearest resistance happens, bears are likely going to break the last low.

1507291883-8cdb700aaedd579baf62a7bec3b4a261_1200x1200_q90v3.png


We've got bullish patterns such an "Engulfing" and a "Hammer", which both have been confirmed. So, the 55 Moving Average is likely going to act as resistance during the day.

More;
https://fbs.com/analytics/articles/eur-usd-engulfing-and-hammer-4233
 
USD/JPY: "WINDOW" ACTING AS SUPPORT
12:14 06.10.2017

1507291883-c19a715279e563be846c9cb97bf5fbcc_1200x1200_q90v3.png


The "Window" is acting as support, so we've got an "Engulfing" pattern. Therefore, the market is likely going to reach the nearest resistance area pretty soon.

1507291883-11041d62511bd9a6a829a69040bd6b43_1200x1200_q90v3.png


There's a bearish "High Wave", which has been confirmed. So, the price is likely going to get support on the 55 Moving Average. If a pullback from this line happens, we could have just another bullish rally.

More:
https://fbs.com/analytics/articles/usd-jpy-window-acting-as-support-4234
 
EUR/AUD: TARGETING THE 1.5140 LEVEL
00:08 09.10.2017

EUR/AUD has gained momentum around the 65% Fibonacci retracement level at 1.4962 and now it’s targeting the -23.6% Fibo zone at 1.5138. During Friday’s session, it made a pull back in an effort to correct recent gains in the pair. If it manages to break above Friday’s highs, such target could be reached, while a pull back should take the pair to re-test the 200 SMA around the 38.2% Fibo level.

RSI indicator remains in the positive territory, favoring to the bulls.

1507507713-2d31d46924fd2bb6b6f019e8dff68798_1200x1200_q90v3.png


More:
https://fbs.com/analytics/articles/eur-aud-targeting-the-15140-level-4253
 
EUR/USD: EURO FIXED POSITIONS OVER KIJUN-SEN
05:20 09.10.2017

Technical levels: support – 1.1725, 1.1700; resistance – 1.1760/70.

Trade recommendations:

Sell — 1.1750; SL — 1.1770; TP1 — 1.1700; TP2 – 1.1650
Reason: bearish Ichimoku Cloud, but horizontal Senkou Span A and B; a new dead cross of Tenkan-sen and Kijun-sen with falling Tenkan-sen; the prices are breakout the Kijun’s resistance, but there is a stronger resistance of the Cloud.

1507526389-5974574d0f06c411e972e24d898d2405_1200x1200_q90v3.png


More:
https://fbs.com/analytics/articles/eur-usd-euro-fixed-positions-over-kijun-sen-4255
 
GBP/USD: POUND MADE A NEW LOWS
05:21 09.10.2017

Technical levels: support – 1.3060, 1.3000; resistance – 1.3150.

Trade recommendations:

Sell — 1.3150; SL — 1.3170; TP1 — 1.3060; TP2 — 1.3000.
Reason: bearish Ichimoku Cloud with falling Senkou Span A; a new dead cross of Tenkan-sen and Kijun-sen, falling Tenkan-sen; the prices are tested the support of 1.3020 and returned to Kijun-sen.

1507526389-5838ef800660551113de2aff99712827_1200x1200_q90v3.png


More:
https://fbs.com/analytics/articles/gbp-usd-pound-made-a-new-lows-4256
 
NZD/USD: BEARS RETURNED HOME
07:20 09.10.2017

Recommendation:

SELL 0.7145 SL 0.72 TP1 0.6045 TP2 0.6965

BUY 0.6965 SL 0.691 TP1 0.7065 TP2 0.7145

On the daily chart, NZD/USD keeps forming Gartley pattern. Its 78.6% target is near the lower border of the uptrend channel. This increases the risks of a pullback. After that, buyers may try to resume the uptrend.

1507533555-fb9be1d9d65d6402746f6573306cf53b_1200x1200_q90v3.png


On H1, there’s the short-term downtrend. The nearest resistance is close to 0.7145. The inability of bulls to overcome it will signal buyers’ weakness.

1507533579-3696dc2326705fd45dfa7b732beb8b1e_1200x1200_q90v3.png


More:
https://fbs.com/analytics/articles/nzd-usd-bears-returned-home-4261
 
AUD/USD RAN INTO SHARKS
07:38 09.10.2017

Recommendation:

SELL 0.773 SL 0.7785 TP 0.76

SELL 0.786 SL 0.7915 TP1 0.773 TP2 0.76

On the daily chart, AUD/USD keeps going to 161.8% and 88.6% targets of the junior “Crab” pattern and the senior “Shark” pattern. They are situated around 0.76. The trend remains descending, so the pullbacks may be used for selling.

1507534651-1db64c049cc9775b27418fd0e6b0833a_1200x1200_q90v3.png


On H1, AUD/USD can trigger the inverted “Shark” pattern and correct towards its target at 88.6%. To do this, bears need to break the diagonal resistance in the form of the upper border of the downtrend channel.

1507534665-ef00342837a633bda01cab6a3fe3e88f_1200x1200_q90v3.png


More:
https://fbs.com/analytics/articles/aud-usd-ran-into-sharks-4262
 
EUR/USD: "THORN" PATTERN PUSHED PRICE HIGHER
09:16 09.10.2017

1507540502-fcf2075df340adfa90a00bafa4b48f9b_1200x1200_q90v3.png


There's a "Thorn" pattern, which pushed the price higher, but bulls faced with resistance at 1.1739. In this case, the market is likely going to test the nearest support at 1.1688, which could be a departure point for an upward price movement towards the next resistance at 1.1772 - 1.1793.

1507540502-528db4be49f2fb4eb6bb7d17bebee212_1200x1200_q90v3.png


The price is consolidating near the 55 Moving Average. Also, there's a local "Triple Top" pattern, so bears are likely going to reach the closest support at 1.1695 - 1.1688. If a pullback from this area happens, there'll be an opportunity to have an upward price movement in the direction of another resistance at 1.1772 - 1.1793.

More:
https://fbs.com/analytics/articles/eur-usd-thorn-pattern-pushed-price-higher-4266
 
GBP/USD: "V-BOTTOM" PATTERN
09:17 09.10.2017

1507540502-82157f0cda42ec293f4d22a2ad7f5734_1200x1200_q90v3.png


Bears faced with support at 1.3017, so we've got a "V-Bottom" pattern. In this case, the pair is likely going to achieve the nearest resistance at 1.3182 in the short term. However, if we have a pullback from this level, there'll be an option to have another decline towards the closest support area at 1.3017 - 1.2994.

1507540502-2d9ff561dba0155ac8f0ff7d61bc55f9_1200x1200_q90v3.png


The price has been rising since a "V-Bottom" pattern was formed. The main intraday target is the nearest resistance at 1.3182 - 1.3221. Meanwhile, if we see a pullback from these levels, bears will probably try to reach the next support at 1.3017 - 1.2994 soon.

More:
https://fbs.com/analytics/articles/gbp-usd-v-bottom-pattern-4267
 
Top