• The Forex, Binary Options Forum - welcomes you to our Community!

    DigitalCashPalace Forum is dedicated to discussions about Forex, Binary Options, commodities, stocks related.

    Please take a look around, and feel free to .

Market analysis and trade recommendations by FBS

EUR/USD: TWO PULLBACKS FROM 0/8 MM LEVEL
13:06 28.09.2017

1506603955-1cf44e8e7098782e26c836c1138f8d1c_1200x1200_q90v3.png


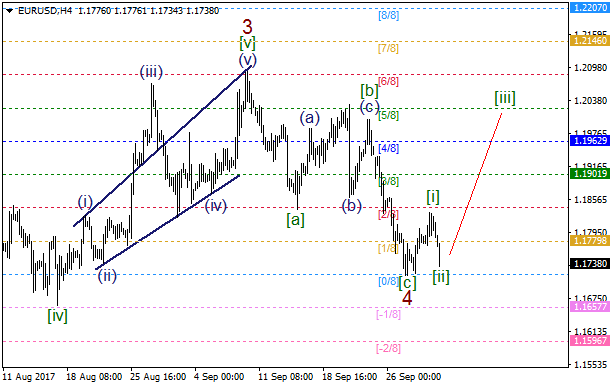
Wave 4 may have been formed like a zigzag, cause there's a pullback from 0/8 MM Level. Therefore, we're likely going to have an upward impulse in wave 5 soon.

1506603955-cf5a9963aa5c15e3db2dc4025422a27d_1200x1200_q90v3.png


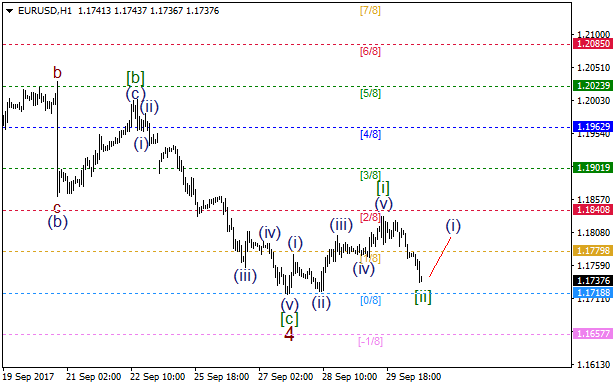
There are two pullbacks from 0/8 MM Level in a row, so the price is rising. It's likely that we've got developing wave . If so, wave (iii) is going to move on in the short term.

More:
https://fbs.com/analytics/articles/eur-usd-two-pullbacks-from-0-8-mm-level-4054
 
GBP/USD: POUND SUPPORTED INSIDE CLOUD
06:47 29.09.2017

Technical levels: support – 1.3310, 1.3380; resistance – 1. 3560.

Trade recommendations:

Buy — 1.3400; SL — 1.3380; TP1 — 1.3510; TP2 — 1.3560.
Reason: narrow bullish Ichimoku Cloud with falling Senkou Span A; a dead cross of Tenkan-sen and Kijun-sen with the falling Kijun-sen; the prices are on the strong support inside a Cloud.

1506667624-5838ef800660551113de2aff99712827_1200x1200_q90v3.png


More:
https://fbs.com/analytics/articles/gbp-usd-pound-supported-inside-cloud-4065
 
AUD/USD: AUSSIE REACHED MAIN SUPPORT
06:48 29.09.2017

Technical levels: support – 0.7800, 0.7830; resistance – 0.7880, 0.7900.

Trade recommendations:

Buy — 0.7840; SL — 0.7820; TP1 — 0.7880; TP2 — 0.7900.
Reason: bearish Ichimoku Cloud with falling Senkou Span A; a dead cross of Tenkan-sen and Kijun-sen; the prices are in the oversold area yet, but entered into the channel of Tenkan-Kijun and can grow to Kijun’s levels.

1506667625-42a68b4bfa2f0515dfbaa054e9dbae66_1200x1200_q90v3.png


More:
https://fbs.com/analytics/articles/aud-usd-aussie-reached-main-support-4066
 
EUR/USD: EURO PAINTED A WEDGE
07:31 29.09.2017

Recommendation:

SELL 1.1870 SL 1.1925 TP 1.1755

SELL 1.1910 SL 1.1965 TP 1.1790

On the daily chart, EUR/USD keeps forming “Shark” pattern and “Head and Shoulders”. Further fate of the pair will depend on the test of the neckline. There’s an important resistance at 1.1860-1.1865.

1506670245-8afba167b3e7c15d0d5d28d0f3c7b966_1200x1200_q90v3.png


On H1, EUR/USD is finishing “Widening wedge” pattern. A successful test of resistance at 1.1805 will trigger the “Dragon” pattern and increase the odds of growth towards 50%, 61.8% and 78,6% of the wave 4-5. The sellers will take it from there.

1506670259-144c086f9efd0dd7367f2818eb875c0e_1200x1200_q90v3.png


More:
https://fbs.com/analytics/articles/eur-usd-euro-painted-a-wedge-4068
 
EUR/GBP: BULLS COUNTERATTACKED
07:41 29.09.2017

Recommendations:

BUY 0.881 SL 0.8755 TP1 0.891 TP2 0.9

SELL 0.8755 SL 0.881 TP 0.8655

On the daily chart, EUR/GBP bulls are trying to hold at the lower border of the 0.8775-0.8900 consolidation range. If they fail, a formation of the “Shark” and “Shakeout-Fakeout” pattern will increase the risks of the pair’s advance above 0.9000.

1506670805-56123217670f454135dc08eee35d0551_1200x1200_q90v3.png


On H1, EUR/GBP is in the final stage of the “Widening wedge”. A break of resistance at 0.8795 (23.6% of the wave 4-5) and 0.8810 will open the way to the upside. Selling the pair will become a good idea below support at 0.8755.

1506670820-311438cdc50bb0f634d8ee27e47a0113_1200x1200_q90v3.png


More:
https://fbs.com/analytics/articles/eur-gbp-bulls-counterattacked-4069
 
EUR/USD: "DOUBLE BOTTOM"
09:14 29.09.2017

1506676415-9e6489d0933af31b2ffd26b9dfaf5a02_1200x1200_q90v3.png


There's a "Double Bottom", so the price reached the nearest resistance at 1.1793. Meanwhile, the market is likely going to continue moving up towards the next resistance at 1.1822 - 1.1837. If a pullback from this area happens, we could have a decline in the direction of the closest support at 1.1793 - 1.1772.

1506676415-d0adcc2420ad6f4a63982c707ff053a8_1200x1200_q90v3.png


The price is consolidating between the levels 1.1772 - 1.1793. Also, we've got a "Pennant" pattern, which has been broken. So, we bulls are likely going to reach the next resistance at 1.1822 - 1.1837 in the coming hours. If we have a pullback from these levels, bears will probably try to deliver a downward correction.

More:
https://fbs.com/analytics/articles/eur-usd-double-bottom-4073
 
GBP/USD: "PENNANT" PATTERN
09:17 29.09.2017

1506676415-fe643e743a47f7e577516988b1816a54_1200x1200_q90v3.png


The market is consolidating between the levels 1.3444 - 1.3328. At the same time, there's a downward "Wedge", so the pair is likely going to reach the nearest resistance at 1.3479 - 1.3533 in the short term. If a pullback from this area happens, we could have a decline towards the closest support at 1.3444 - 1.3374.

1506676415-921e6f3abed336006efafa34846edd7c_1200x1200_q90v3.png


There's a downward "Wedge", so the price is consolidating. Also, we've got a "Pennant" pattern, so bulls are likely going to achieve the next resistance at 1.3479 - 1.3513 during the day. However, if we have a pullback from this area, there'll be an opportunity to have a downward price movement in the direction of support at 1.3404 - 1.3374.

More:
https://fbs.com/analytics/articles/gbp-usd-pennant-pattern-4074
 
EUR/USD: BULLISH "THREE METHODS"
12:30 29.09.2017

1506688151-25eaad07399ed342357bc53c8d48a305_1200x1200_q90v3.png


The last "Inverted Hammer" and "Engulfing" patterns led to the current bullish price movement. Also, there's a "Three Methods", so we could have the price even higher. However, if a pullback from the nearest resistance happens little later on, we could have another decline.

1506688151-28d241ed07d13022d9832bc4942c1331_1200x1200_q90v3.png


There's a bullish "Three Methods", which has been confirmed. So, the 89 Moving Average is likely going to act as resistance in the coming hours.

More:
https://fbs.com/analytics/articles/eur-usd-bullish-three-methods-4076
 
USD/JPY: PRICE GOING TO TEST 55 MA
12:32 29.09.2017

1506688151-cc58da585b3846145b6fb56ae0aa3beb_1200x1200_q90v3.png


We've got a bearish "Engulfing" pattern, which is still on the table. So, the price is likely going to test the 55 Moving Average, which could be a departure point for another upward price movement.

1506688151-1b829e1d91fd02e324b6c37635154276_1200x1200_q90v3.png


There's a bullish "Harami", which has been formed on the 55 Moving Average. However, this pattern hasn't been confirmed enough. In this case, the pair is likely going to test the nearest "Window" during the day. If a pullback from this level happens, we could have a decline towards the last low.

More:
https://fbs.com/analytics/articles/usd-jpy-price-going-to-test-55-ma-4077
 
EUR/USD: PULLBACK FROM 0/8 MM LEVEL
12:47 29.09.2017

1506689195-48cecc89124a665a18da4704ba981aa1_1200x1200_q90v3.png


There's a pullback from 0/8 MM Level, so wave 4 may have been formed. The price is rising and it seems like wave is about to end. So, if 2/8 MM Level acts as resistance, we could have wave [ii].

1506689195-7a84ffba58c7e276a8b8b3256ae0c3f4_1200x1200_q90v3.png


We've got a developing bullish impulse, which could be wave . The main target for wave (v) is 2/8 MM Level, which could be a departure point for a local bearish correction.

More:
https://fbs.com/analytics/articles/eur-usd-pullback-from-0-8-mm-level-4078
 
GOLD (XAU/USD) LOOKING TO MAKE A STRONG REBOUND
19:30 01.10.2017

Bears have been the headliners in the Gold’s price action across the board and according to the H4 chart, XAU/USD is expected to finish a correction started since three weeks ago. Between the 1280.95 and 1258.04 we’re expecting a demand zone to be found in order to gather momentum in favor of the bulls. If that happens, then we might expect a rally towards the -23.6% at 1393.38 level.

RSI indicator remains in the positive territory and invalidation zone for our outlook in the yellow metal is placed at the 1237.27 level.

1506886240-d5eb9b05cbcbc3f839b5c5fece960530_1200x1200_q90v3.png


More:
https://fbs.com/analytics/articles/gold-xau-usd-looking-to-make-a-strong-rebound-4090
 
EUR/USD: EURO MAY RETURN TO CLOUD
06:49 02.10.2017

Technical levels: support – 1.1725, 1.1750; resistance – 1.1800, 1.1825.

Trade recommendations:

Buy — 1.1750; SL — 1.1730; TP1 — 1.1800; TP2 – 1.1825.
Reason: bearish Ichimoku Cloud with horizontal Senkou Span A and B; a golden cross of Tenkan-sen and Kijun-se with rising Tenkan-sen; the market is on the support of the daily Cloud.

1506926950-5974574d0f06c411e972e24d898d2405_1200x1200_q90v3.png


More:
https://fbs.com/analytics/articles/eur-usd-euro-may-return-to-cloud-4096
 
GBP/USD: POUND WILL TEST SSB’S SUPPORT
06:50 02.10.2017

Technical levels: support – 1.3280; resistance – 1. 3410.

Trade recommendations:

Buy — 1.3280; SL — 1.3260; TP1 — 1.3410; TP2 — 1.3460.
Reason: narrow bullish Ichimoku Cloud with falling Senkou Span A; a dead cross of Tenkan-sen and Kijun-sen with the falling Kijun-sen, but rising Tenkan-sen; the prices are on the strong support inside a Cloud.

1506926950-5838ef800660551113de2aff99712827_1200x1200_q90v3.png


More:
https://fbs.com/analytics/articles/gbp-usd-pound-will-test-ssb’s-support-4097
 
NZD/USD: WILL KIWI RETURN TO BEARS?
06:59 02.10.2017

Recommendations:

BUY 0.7225 SL 0.728 TP1 0.728 TP2 0.737

SELL 0.7175 SL 0.7105 TP2 0.705

On the daily chart, the inability of bulls to hold the pair above the lower border of the bullish trend channel increases the risks of the pair’s advance to 127.2% target of AB=CD.

1506927496-fb9be1d9d65d6402746f6573306cf53b_1200x1200_q90v3.png


On H1, NZD/USD formed a “Widening wedge” pattern within consolidation to the short-term downtrend. The pair’s return to 23.6% of the wave 4-5 will create grounds for a reversal. On the other hand, decline below 88.6% of the wave 4-5 will be a signal of the bearish trend resumption.

1506927509-3696dc2326705fd45dfa7b732beb8b1e_1200x1200_q90v3.png


More:
https://fbs.com/analytics/articles/nzd-usd--will-kiwi-return-to-bears-4098
 
AUD/USD: BEARS MADE A STOP
07:05 02.10.2017

Recommendation:

SELL 0.781 SL 0.7865 TP 0.7725 TP2 0.761

BUY 0.786 SL 0.7805 TP1 0.7915 TP2 0.7935

On the daily chart, AUD/USD reached 88.6% target of the “Bat” pattern. This increases the odds of the pair’s growth. On the other hand, if the Aussie returns to September low the “Bat” will start transforming into “Crab” with the target at 161.8%.

1506927862-1db64c049cc9775b27418fd0e6b0833a_1200x1200_q90v3.png


On H1, AUD/USD is consolidating within the short-term downtrend. A break of its lower border will allow bears to continue the decline. On the other hand, successful test of resistance at 0.7860 will be a signal for bulls to counterattack.

1506927875-ef00342837a633bda01cab6a3fe3e88f_1200x1200_q90v3.png


More:
https://fbs.com/analytics/articles/aud-usd-bears-made-a-stop-4099
 
EUR/USD: BROKEN UPWARD "WEDGE"
07:50 02.10.2017

1506930552-a4648bd22c3ac52217ee04aaed0cb4a1_1200x1200_q90v3.png


There's a "V-Top" pattern, so the price reached the nearest support at 1.1772. In this case, the market is likely going to continue declining towards the next support at 1.1739 - 1.1714. If a pullback from this area happens, we could have an upward correction in the direction of the closest resistance at 1.1772 - 1.1793.

1506930552-be237c3731cd85251fe23939242885d4_1200x1200_q90v3.png


We've got an upward "Wedge", which has been broken, so the price is declining. Therefore, we should keep an eye on the nearest support at 1.1739 - 1.1714 as an intraday target. However, we have a pullback from these levels, there'll be an opportunity to see a bullish price movement towards the closest resistance at 1.1772 - 1.1793.

More:
https://fbs.com/analytics/articles/eur-usd-broken-upward-wedge-4100
 
GBP/USD: MOVING AVERAGES ACTED AS RESISTANCE
07:52 02.10.2017

1506930551-ccac85e59d219f0b990c82c123c08125_1200x1200_q90v3.png


The price is consolidating in a range of the developing "Wedge". So, the upper side of this pattern is likely going to be broken soon. The main intraday target is the nearest resistance at 1.3479 - 1.3533, which could be a departure point for another decline.

1506930551-456bf34c492cfab89d5cfd70952c4151_1200x1200_q90v3.png


The Moving Averages have acted as resistance, so the price is declining. Meanwhile, if we see a pullback from the nearest support at 1.3328, bulls are likely going to break the local uptrend. If so, the price could achieve the closest resistance at 1.3404 - 1.3444.

More:
https://fbs.com/analytics/articles/gbp-usd-moving-averages-acted-as-resistance-4101
 
EUR/USD: PULLBACK FROM 0/8 MM LEVEL
08:22 02.10.2017

1506932477-6f20fb53ce863ebb9fd2058eee4f4d42_1200x1200_q90v3.png


Wave 4 has been finished, cause there's a pullback from 0/8 MM Level. Also, there's an upward impulse in wave , so we've got developing wave [ii], which is about to end. In this case, we're likely going to have another upward impulse in wave [iii] of 5 soon.

1506932477-2e57faeb9ce8515f188f36b724143f2b_1200x1200_q90v3.png


There's a local decline, which could be wave [ii]. However, this bullish wave count will be unconfirmed until a bullish impulse in wave (i) arrives.

More:
https://fbs.com/analytics/articles/eur-usd-pullback-from-0-8-mm-level-4103
 
USD/JPY: "HAMMER" ON 34 MOVING AVERAGE
11:58 02.10.2017

1506945364-e111318bbc75c8c4229f5d1b23c13980_1200x1200_q90v3.png


The 34 Moving Average has acted as support, so we've got a "Hammer" in this line. Therefore, bulls are likely going to test the upper "Window" in the short term. If a pullback from this level happens later on, we could have a downward correction.

1506945364-e36e1000f599a3429de9b9620132da37_1200x1200_q90v3.png


There's a bearish "Engulfing", which has been formed at the last local high. So, there's an opportunity to have a downward correction in the coming hours. If a pullback from the 55 Moving Average arrives afterwards, bulls will probably try to deliver another upward price movement.

More:
https://fbs.com/analytics/articles/usd-jpy-hammer-on-34-moving-average-4112
 
EUR/USD: "SHOOTING STAR" AT THE LOCAL HIGH
11:56 02.10.2017

1506945364-066febb8260995a80ad51b17d701a5f1_1200x1200_q90v3.png


There's a "Shooting Star", which has been formed at the last local high. This pattern has been confirmed, so the pair is likely going to decline towards the nearest support level.

1506945364-6d497dc5f68df7567c207621d9484312_1200x1200_q90v3.png


The last bearish "Three Methods" pattern led to the current decline. Also, there isn't any reversal pattern so far. In this case, the market is likely going to continue moving down during the day.

More:
https://fbs.com/analytics/articles/eur-usd-shooting-star-at-the-local-high-4111
 
Top