• The Forex, Binary Options Forum - welcomes you to our Community!

    DigitalCashPalace Forum is dedicated to discussions about Forex, Binary Options, commodities, stocks related.

    Please take a look around, and feel free to .

Market analysis and trade recommendations by FBS

XAU/USD: BEARS ARE ATTACKING
06:53 03.10.2017

Recommendation:

BUY $1254

SL $1240

TP1 $1281 TP2 $1300 TP2 $1315

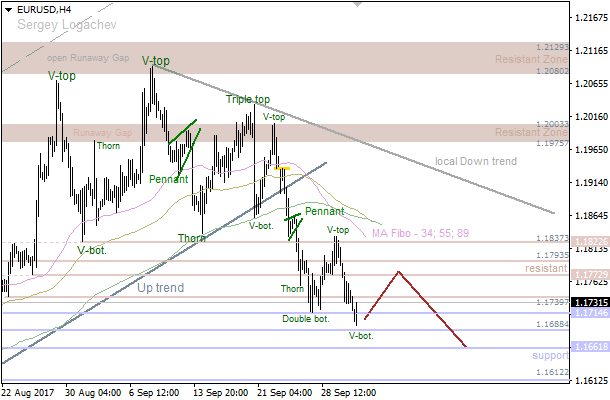
On the daily chart, XAU/USD went to an important support at $1267.6 an ounce. If bears manage to conquer it, risks of continuation towards the lower border of uptrend channel will significantly increase. On the other hand, recoil to the downside will allow consolidation in the $1265-1315 range.

1507013601-20c6ebb86722ac92f8a505b7903a964b_1200x1200_q90v3.png


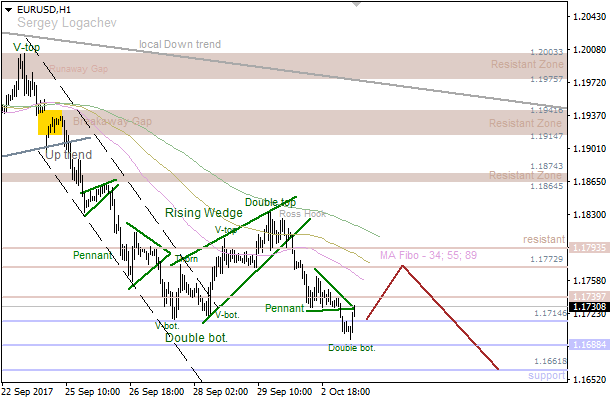
On H1, XAU/USD is heading towards $1254. Near it there’s a lower border of the downtrend channel, 224% target of AB=CD and historic support. This increases the risks of a pullback.

1507013615-e12a637cc937326a9c7981d6dfc46909_1200x1200_q90v3.png


More:
https://fbs.com/analytics/articles/xau-usd-bears-are-attacking-4132
 
USD/CAD: LOONIE IS BREAKING THE TREND
07:38 03.10.2017

Recommendation:

BUY 1.2595

SL 1.254

TP1 1.2715 TP2 1.292 TP3 1.325

On the daily chart, USD/CAD bulls managed to overcome resistance at 1.2462. If they manage to conquer 1.2717 with ease, the odds of triggering the “Shark” patter will significantly increase. Its 88.6% target corresponds to 1.3250.

1507016259-1430b06b52ccdf0a9e951da31344610e_1200x1200_q90v3.png


On H1, increase above resistance at 1.2533 will open the way to 1.2595 (88.6% of the last descending wave + 161.8% target of AB=CD). A successful test of this level will allow bulls to continue the rally.

1507016288-c19703868bbc85441b3abba113bcb318_1200x1200_q90v3.png


More:
https://fbs.com/analytics/articles/usd-cad-loonie-is-breaking-the-trend-4133
 
GBP/USD: POUND BOUNCED FROM SSB’S
07:38 03.10.2017

Technical levels: support – 1.3250/80; resistance – 1.3340, 1. 3410.

Trade recommendations:

Buy — 1.3270; SL — 1.3250; TP1 — 1.3340; TP2 — 1.3410.
Reason: narrowing bullish Ichimoku Cloud, but rising Senkou Span B; a dead cross of Tenkan-sen and Kijun-sen with the horizontal Tenkan-sen and Kijun-sen; the prices are reached the SSB’s support and bounced inside Cloud.

1507016327-5838ef800660551113de2aff99712827_1200x1200_q90v3.png


More:
https://fbs.com/analytics/articles/gbp-usd-pound-bounced-from-ssb’s-4134
 
AUD/USD: AUSSIE MAY RETURN TO CLOUD
07:39 03.10.2017

Technical levels: support – 0.7800; resistance – 0.7880, 0.7900.

Trade recommendations:

Buy — 0.7820; SL — 0.7800; TP1 — 0.7880; TP2 — 0.7900.
Reason: bearish Ichimoku Cloud with falling Senkou Span A and B; a dead cross of Tenkan-sen and Kijun-sen with falling lines; the prices are on the strong support on the daily timeframe.

1507016327-42a68b4bfa2f0515dfbaa054e9dbae66_1200x1200_q90v3.png


More:
https://fbs.com/analytics/articles/aud-usd-aussie-may-return-to-cloud-4135
 
EUR/USD: CONFIRMED "DOUBLE BOTTOM"
12:10 03.10.2017

1507032552-07485d8a7f5ea623ed458ad7fdf3c67b_1200x1200_q90v3.png


Bears faced with support at 1.1688, so we've got a "V-Bottom". In this case, the market is likely going to reach the nearest resistance at 1.1772 - 1.1793 in the coming hours. If a pullback from this area happens, we could have a decline towards the closest support at 1.1688 - 1.1661.

1507032552-8503571a8c9edc63c29edc6a3e3d9a13_1200x1200_q90v3.png


There's a "Double Bottom", which has been confirmed, so the price is likely going to reach the nearest resistance at 1.1772 - 1.1793 in the coming hours. If we see a pullback from these levels, there'll be an opportunity to have a downward price movement towards another support at 1.1688 - 1.1661.

More:
https://fbs.com/analytics/articles/eur-usd-confirmed-double-bottom-4143
 
GBP/USD: "V-BOTTOM" PATTERN
12:12 03.10.2017

1507032552-f30f43a47b8a41cacd3b26aabca13bf9_1200x1200_q90v3.png


We've got a "V-Bottom", so there's an opportunity to have a local bullish correction. Meanwhile, bears are likely going to test the next support at 1.3182 - 1.3150 afterwards. If we have a pullback from this area, bulls will probably try to deliver an upward price movement.

1507032552-269afc4002b0ec18d5e14b4ec8b3d8cf_1200x1200_q90v3.png


There's a "Double Bottom", which has been confirmed. So, the main intraday target is the nearest resistance at 1.3328. However, if a pullback from this level happens, we could have another decline.

More:
https://fbs.com/analytics/articles/gbp-usd-v-bottom-pattern-4144
 
EUR/USD: BULLISH "ENGULFING"
12:25 03.10.2017

1507033464-bc32be03685e832e7d1dd632c64a6c2c_1200x1200_q90v3.png


There's a bullish "Engulfing", which has been formed at the last local low. Considering confirmation of this pattern, the market is likely going to test the Moving Averages. If a pullback from these lines happens, we could have another decline.

1507033465-e8950dbb89c19816527d85a23b5e61d6_1200x1200_q90v3.png


We've got a "Tower" and a "Doji", so the 34 Moving Average is likely going to act as resistance. So, there's an opportunity to have a local correction if a pullback from this line happens in the coming hours.

More:
https://fbs.com/analytics/articles/eur-usd-bullish-engulfing-4146
 
USD/JPY: "WINDOW" ACTING AS SUPPORT
12:27 03.10.2017

1507033465-955325a306ba57159486663f5facafc0_1200x1200_q90v3.png


The nearest "Window" is acting as support, which is likely going to be tested once again in the short term. If we have another pullback from the "Window", bulls will probably try to deliver a new local high.

1507033464-21c912bfd9a72b6c84a05578b9661bbb_1200x1200_q90v3.png


We've got a bearish "Tower", which has been formed right below the upper "Window". So, the pair is likely going to test the 89 Moving Average during the day.

more:
https://fbs.com/analytics/articles/usd-jpy-window-acting-as-support-4147
 
USD/JPY: DOLLAR WILL TEST CLOUD’S SUPPORT
05:41 04.10.2017


Technical levels: support – 112.30/40; resistance – 113.00, 113.30.

Trade recommendations:

Buy — 112.60; SL — 112.40; TP1 — 113.30; TP2 — 114.00.
Reason: bullish Ichimoku Cloud with rising Senkou Span A; a golden cross of Tenkan-sen and Kijun-sen, but the horizontal Tenkan-sen and Kijun-sen; the prices are breaking down the Kijun’s support and going to Cloud.

1507095649-3dcc4d3b0e9d38341d309e86e7227f36_1200x1200_q90v3.png


More;
https://fbs.com/analytics/articles/usd-jpy-dollar-will-test-cloud’s-support-4164
 
USD/CHF: FRANC WENT OFF THE ROAD
07:27 04.10.2017

Recommendations:

SELL 0.971 SL 0.9765 TP1 0.9585 TP2 0.954
SELL 0.9645 SL 0.97 TP1 0.9585 TP2 0.954
On the daily chart, the inability of bulls to settle above 0.9760 points at their weakness. If bears manage to use the pin bar, the odds of decline to 88.6% and 113% targets of the “Shark” pattern will increase.

1507101970-a5903a7f3cf43bc4f33886526fd841ba_1200x1200_q90v3.png


On H1, there’s a combination of reversal patterns “Three Indians” and “Widening wedge”. Aggressive selling involves opening positions on the break of the lower border of the uptrend channel. Conservative sellers can open positions on a successful break of support at 0.9645.

1507101992-351a015a31e5fdb2fee97b43bc66aebc_1200x1200_q90v3.png


More:
https://fbs.com/analytics/articles/usd-chf-franc-went-off-the-road-4167
 
GBP/USD: BEARS CREATED A TRAP
07:52 04.10.2017

Recommendation:

SELL 1.332 SL 1.3375 TP 1.321 TP2 1.3105

SELL 1.338 SL 1.3435 TP1 1.328 TP2 1.321

On the daily chart, after GBP/USD formed AB=CD and “Three Indians” patterns, there was a pullback. Bulls are currently trying to return in the game and resume the uptrend. For a start, they have to overcome 1.3290.

1507103480-b6b56ed02b1869ac79ae2067aff9ca74_1200x1200_q90v3.png


On H1, GBP/USD reached 88.6% target of the “Shark” pattern. After this, the “Shark” started transforming into 5-0. Pullbacks towards 23.6%, 38.2% and 50% of the wave CD, as usual, are used for forming short positions.

1507103500-2cf183d9aa99dd882e50bd88c66a58cb_1200x1200_q90v3.png


More;
https://fbs.com/analytics/articles/gbp-usd-bears-created-a-trap-4169
 
EUR/USD: "PENNANT" LED TO FORM NEW HIGH
08:58 04.10.2017

1507107416-a3b5b2e98c6adc06a3c56564725916ab_1200x1200_q90v3.png


There's a "V-Bottom" pattern, so the price reached the nearest resistance at 1.1772. Nevertheless, the market is likely going to achieve the 89 Moving Average in the short term. If a pullback from this line happens, we could have a decline towards the closest support at 1.1714 - 1.1688

1507107416-a8f37eee1e7dea87ccc537e5921ae21e_1200x1200_q90v3.png


The last "Pennant" pattern led to form a new local high. Also, we've got a bullish "Flag", so the pair is likely going to reach another resistance at 1.1831 in the coming hours. However, if a pullback from this level happens, there'll be an opportunity to have a decline in the direction of the nearest support at 1.1739 - 1.1714.

More:
https://fbs.com/analytics/articles/eur-usd-pennant-led-to-form-new-high-4170
 
GBP/USD: "TRIPLE BOTTOM"
09:00 04.10.2017

1507107416-f5e0036674592fdc2733e57953cdd14b_1200x1200_q90v3.png


Bears faced with support at 1.3223, so there's a "Triple Bottom", which pushed the price to the closest resistance at 1.3278. Meanwhile, the market is likely going to continue moving up towards the 34 Moving Average. If this line acts as resistance little later on, bears will try to reach another support at 1.3223 - 1.3182.

1507107416-03718938af5febfd6ec3f5835286fd2a_1200x1200_q90v3.png


We've got a "Triple Bottom", so the price is consolidating. The main intraday target is the 89 Moving Average, which could be a departure point for another decline in the direction of the last low.

More:
https://fbs.com/analytics/articles/gbp-usd-triple-bottom-4171
 
EUR/USD: POSSIBLE EXTENSION IN THE THIRD WAVE
10:27 04.10.2017

1507112781-f9696f68c73fe5816dc700fbc8131201_1200x1200_q90v3.png


There's a pullback from 0/8 MM Level, so wave 4 may have been formed. Therefore, there's an opportunity to have an upward impulse in wave . The main intraday target is 2/8 MM Level, which could be a departure point for a downward correction.

1507112781-6124603546f99c7aeda3685b8c8095ef_1200x1200_q90v3.png


As we can see on the one-hour chart, there's a possible extension in the third wave inside wave . So, the market is likely going to continue moving up, which means we could have a new local high pretty soon.

More:
https://fbs.com/analytics/articles/eur-usd-possible-extension-in-the-third-wave-4178
 
USD/JPY: "TOWER" LED TO DECLINE
11:24 04.10.2017

1507116215-10cd06bb61f6009f80fe3ee2bcd2a86f_1200x1200_q90v3.png


The price is still consolidating. Also, there's a "Hanging Man", which has been formed at the last local high. So, the 34 Moving Average is likely going to act as support. If so, we could have another bullish rally afterwards.

1507116215-d598739c6e97055a1d0f4024503b0c37_1200x1200_q90v3.png


The last "Tower" pattern led to the current decline. Meanwhile, if any bullish pattern forms on the lower "Window", there'll be an opportunity to have an upward price movement towards the nearest resistance area.

More:
https://fbs.com/analytics/articles/usd-jpy-tower-led-to-decline-4179
 
EUR/USD: BULLISH "ENGULFING"
11:28 04.10.2017

1507116215-b41ed7911d6ed349069a74e0ff4a8f1b_1200x1200_q90v3.png


There's a bullish "Engulfing", which has been confirmed enough. So, the market is likely going to continue moving up towards the nearest resistance area, which could be a departure point for another decline.

1507116215-a856a580601b1a5c40891d89c62388e1_1200x1200_q90v3.png


We've got a bullish "Hammer", but confirmation of this pattern is still on the way. Therefore, we could have a local bearish correction during the day. However, if a pullback from the closest support happens little later on, there'll be an opportunity to have an upward price movement in the direction of the last high.

More:
https://fbs.com/analytics/articles/eur-usd-bullish-engulfing-4180
 
GBP/USD: BREAKDOWN OF SUPPORT
07:13 05.10.2017

Technical levels: support – 1.3200, 1.3090; resistance – 1.3280.

Trade recommendations:

Sell — 1.3190; SL — 1.3210; TP1 — 1.3090; TP2 — 1.3050.
Reason: expanding bearish Ichimoku Cloud, but rising Senkou Span B; a dead cross of Tenkan-sen and Kijun-sen with falling Tenkan-sen and Kijun-sen; the prices are breakdown the main support of the Cloud and entered into the negative area.

1507187572-5838ef800660551113de2aff99712827_1200x1200_q90v3.png


More:
https://fbs.com/analytics/articles/gbp-usd-breakdown-of-support-4197
 
AUD/USD: AUSSIE TESTED CLOUD’S RESISTANCE
07:13 05.10.2017

Technical levels: support – 0.7800; resistance – 0.7880.

Trade recommendations:

Buy — 0.7830; SL — 0.7810; TP1 — 0.7880; TP2 — 0.7900.
Reason: bearish Ichimoku Cloud with rising Senkou Span A; a new golden cross of Tenkan-sen and Kijun-sen with rising Tenkan-sen; the prices are returned to the support of Tenkan-sen and Kijun-sen.

1507187572-42a68b4bfa2f0515dfbaa054e9dbae66_1200x1200_q90v3.png


More:
https://fbs.com/analytics/articles/aud-usd-aussie-tested-cloud’s-resistance-4198
 
[B[EUR/JPY: THE TRUCE HAS RUN OVER TIME[/B]
07:16 05.10.2017

Recommendations:

BUY 133.05 SL 132.5 TP1 134.05 TP2 135

SELL 132 SL 132.55 TP1 131.25 TP2 130.4 TP3 129.8

On the daily chart, EUR/JPY is consolidating within a bullish trend. A break of its lower border and exit outside the uptrend channel will increase the risks of a pullback to 129.80.

1507187662-151f939c6df1fdb4a28b3d5785d898f1_1200x1200_q90v3.png


On H1, EUR/JPY got stuck between 132 and 133.05. A successful test of its lower border will allow triggering of AB=CD pattern with a target at 200%. On the other hand, a break of resistance at 133.05 creates room for the uptrend’s resumption.

1507187691-b35d7fb0c22de42ad09055593ba2f9a4_1200x1200_q90v3.png


More:
https://fbs.com/analytics/articles/eur-jpy-the-truce-has-run-over-time-4199
 
Top