ETHUSD and LTCUSD Technical Analysis – 10th FEB, 2022

ETHUSD: Bullish Pennant Pattern Above $3,000
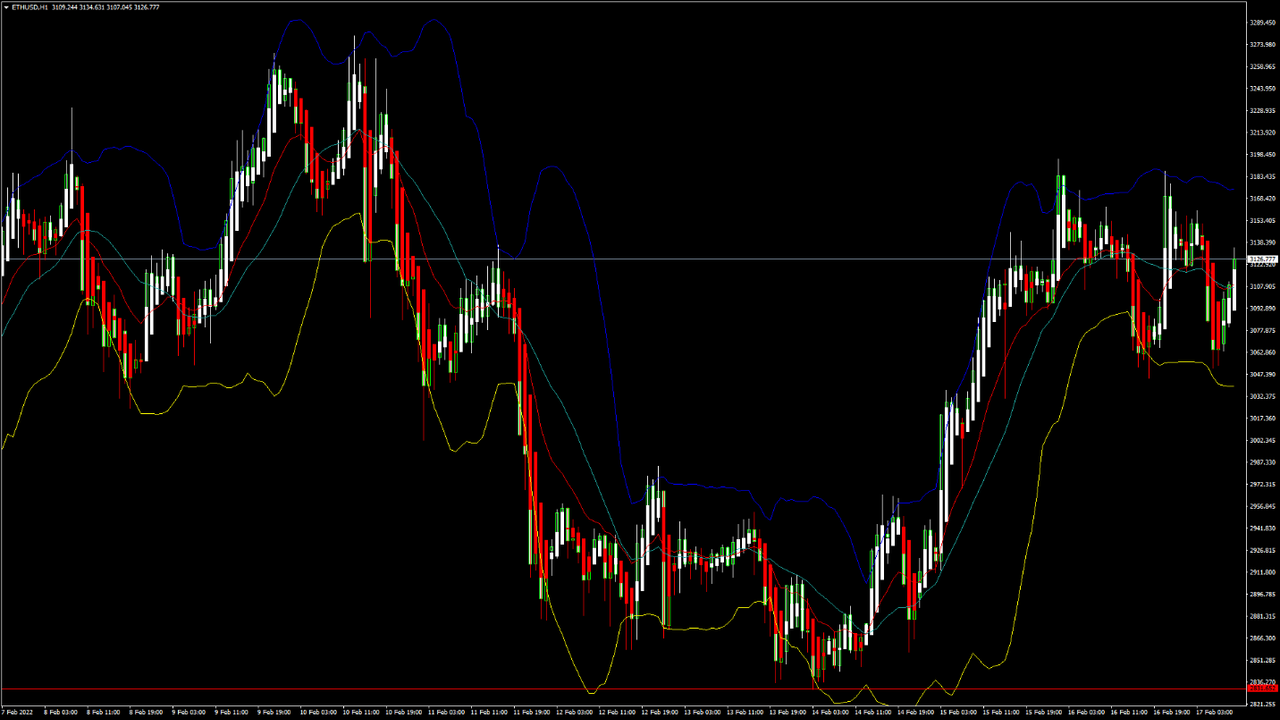
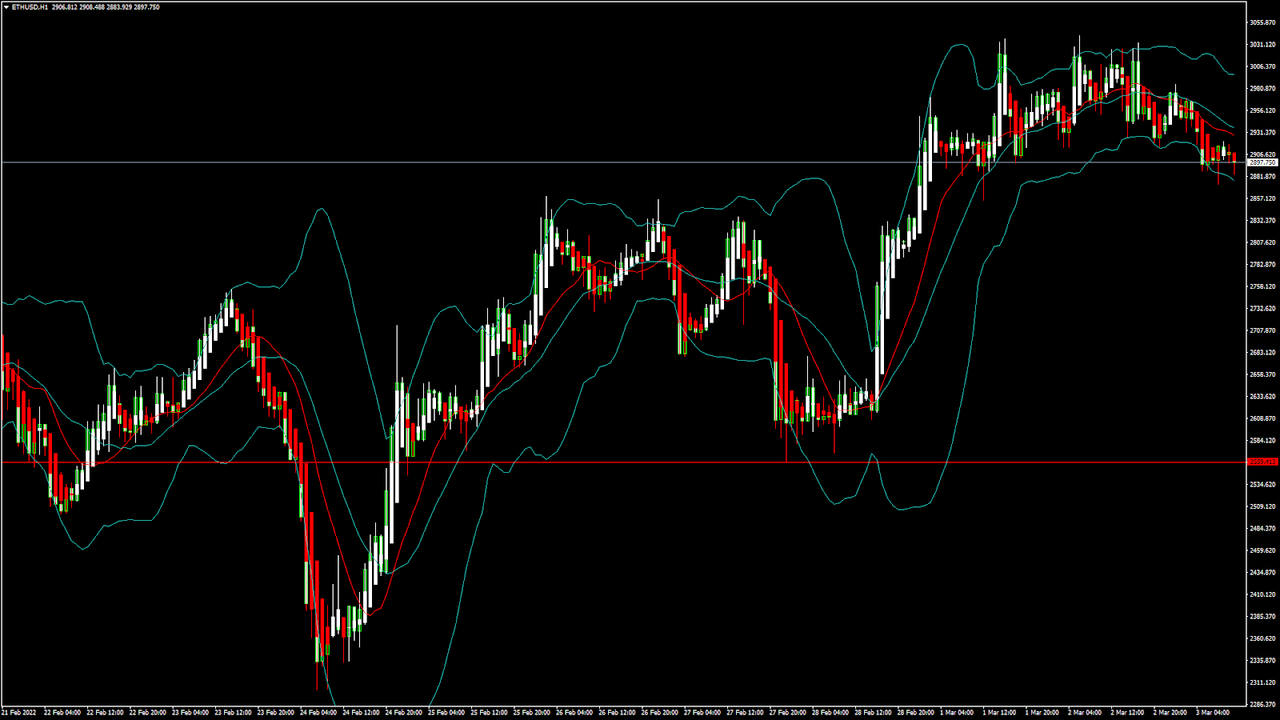
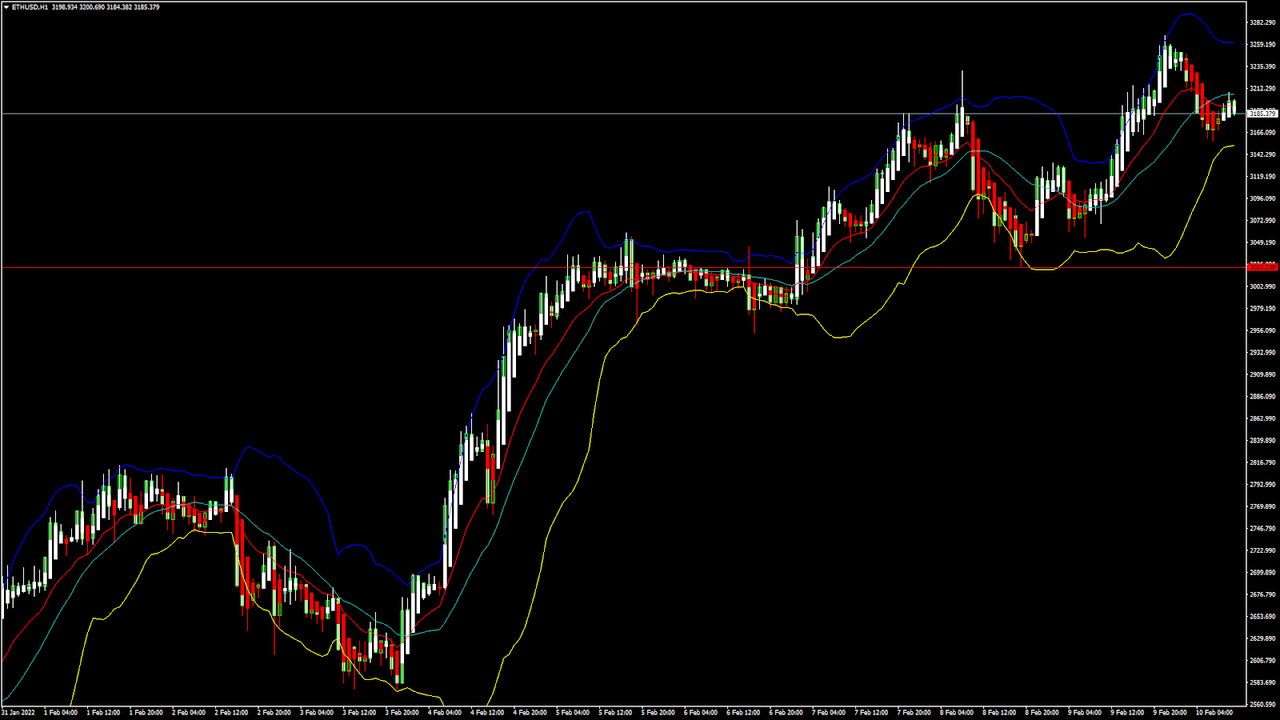
This week, Ethereum continues its bullish momentum after touching a low of $2,575 on February 3rd. On February 8th, we saw Ethereum making a strong bullish move in the form of a rally and crossing the level of $3,000.
ETHUSD continues to maintain its consolidation above the level of $3,000 and is currently trading at $3,194 in the European trading session.
We can clearly see a bullish pennant pattern above the $3,000 handle which is a bullish pattern and signifies a bullish continuation, forming an uptrend.
ETH is now trading just above its pivot level of $3,187 and moving in a consolidation channel. The price of ETHUSD is now testing its classic resistance level of $3,196 and Fibonacci resistance level of $3,202 after which the path towards $3,400 will get cleared.
The relative strength index is at 53 indicating a NEUTRAL market sentiment which is expected to shift towards the bullish sentiment.
Some of the technical indicators are giving a BUY market signal.
ETH is now trading above its 100 hourly and 200 hourly simple moving averages.
Ether: Bullish Momentum Seen Above $3,000
ETHUSD continues to move in a bullish channel above the $3,000 handle in today’s European trading session.
The price of Ethereum has crossed the 50-day simple moving average at $3,142, indicating a bullish outlook, and we are now looking at the targets of 3,300 and 3,500.
The Stoch and rate of price change are indicating a short-term correction which is expected at levels below 3,200.
The daily RSI is printing at 59 which also indicates a stronger demand for Ethereum in the long-time frame.
The bullish line formation above its 100-day simple moving average of 3106 indicates that we are heading towards $3,500.
The key support level to watch is $3,000, and as of now, the price remains above this levels.
ETH has gained 3.17% with a price change of 98.32$ in the past 24hrs, and has a trading volume of 13.426 billion USD.
We can see a decrease of 7.54% in the total trading volume in the last 24 hrs, which appears to be normal.
The Week Ahead
Ethereum continues to move in a strongly bullish momentum after touching a low of $2,199 on 24th January. The price has jumped by more than 40% in the form of a rally, and now we are observing a consolidation in its levels.
If the price of ETHUSD continues to remain above the $3,000 handle, as seen today, it will start the next leg of its bullish move towards the $3,500 handle the next week.
The immediate short-term outlook for Ether has turned BULLISH, the medium-term outlook is strongly BULLISH, and the long term outlook for Ether is BULLISH towards the $3,500 handle.
We have detected an MA5 crossover pattern above 3,181,which signifies a bullish move in the short-term.
This week, Ether is expected to move in a range between $3,200 and $3,400, while next week, Ether is expected to trade at levels above $3,500.
Technical Indicators:
Moving averages convergence divergence (12,26): at 11.10 indicating a BUY
Average Directional Change (14-day): at 40.85 indicating a BUY
Bull/Bear Power(13-day): at 7.94 indicating a BUY
StochRSI (14-day): at 22.77 indicating an OVERSOLD market
Read Full on FXOpen Company Blog...
ETHUSD: Bullish Pennant Pattern Above $3,000
This week, Ethereum continues its bullish momentum after touching a low of $2,575 on February 3rd. On February 8th, we saw Ethereum making a strong bullish move in the form of a rally and crossing the level of $3,000.
ETHUSD continues to maintain its consolidation above the level of $3,000 and is currently trading at $3,194 in the European trading session.
We can clearly see a bullish pennant pattern above the $3,000 handle which is a bullish pattern and signifies a bullish continuation, forming an uptrend.
ETH is now trading just above its pivot level of $3,187 and moving in a consolidation channel. The price of ETHUSD is now testing its classic resistance level of $3,196 and Fibonacci resistance level of $3,202 after which the path towards $3,400 will get cleared.
The relative strength index is at 53 indicating a NEUTRAL market sentiment which is expected to shift towards the bullish sentiment.
Some of the technical indicators are giving a BUY market signal.
ETH is now trading above its 100 hourly and 200 hourly simple moving averages.
- Ether bullish momentum is seen above the $3,000 mark
- Short-term range appears to be mildly BULLISH
- Commodity channel index is indicating a NEUTRAL market
- Average true range is indicating LESS market volatility
Ether: Bullish Momentum Seen Above $3,000
ETHUSD continues to move in a bullish channel above the $3,000 handle in today’s European trading session.
The price of Ethereum has crossed the 50-day simple moving average at $3,142, indicating a bullish outlook, and we are now looking at the targets of 3,300 and 3,500.
The Stoch and rate of price change are indicating a short-term correction which is expected at levels below 3,200.
The daily RSI is printing at 59 which also indicates a stronger demand for Ethereum in the long-time frame.
The bullish line formation above its 100-day simple moving average of 3106 indicates that we are heading towards $3,500.
The key support level to watch is $3,000, and as of now, the price remains above this levels.
ETH has gained 3.17% with a price change of 98.32$ in the past 24hrs, and has a trading volume of 13.426 billion USD.
We can see a decrease of 7.54% in the total trading volume in the last 24 hrs, which appears to be normal.
The Week Ahead
Ethereum continues to move in a strongly bullish momentum after touching a low of $2,199 on 24th January. The price has jumped by more than 40% in the form of a rally, and now we are observing a consolidation in its levels.
If the price of ETHUSD continues to remain above the $3,000 handle, as seen today, it will start the next leg of its bullish move towards the $3,500 handle the next week.
The immediate short-term outlook for Ether has turned BULLISH, the medium-term outlook is strongly BULLISH, and the long term outlook for Ether is BULLISH towards the $3,500 handle.
We have detected an MA5 crossover pattern above 3,181,which signifies a bullish move in the short-term.
This week, Ether is expected to move in a range between $3,200 and $3,400, while next week, Ether is expected to trade at levels above $3,500.
Technical Indicators:
Moving averages convergence divergence (12,26): at 11.10 indicating a BUY
Average Directional Change (14-day): at 40.85 indicating a BUY
Bull/Bear Power(13-day): at 7.94 indicating a BUY
StochRSI (14-day): at 22.77 indicating an OVERSOLD market
Read Full on FXOpen Company Blog...