BTCUSD and XRPUSD Technical Analysis – 05th APR 2022

BTCUSD: Double Bottom Pattern Above $44,000
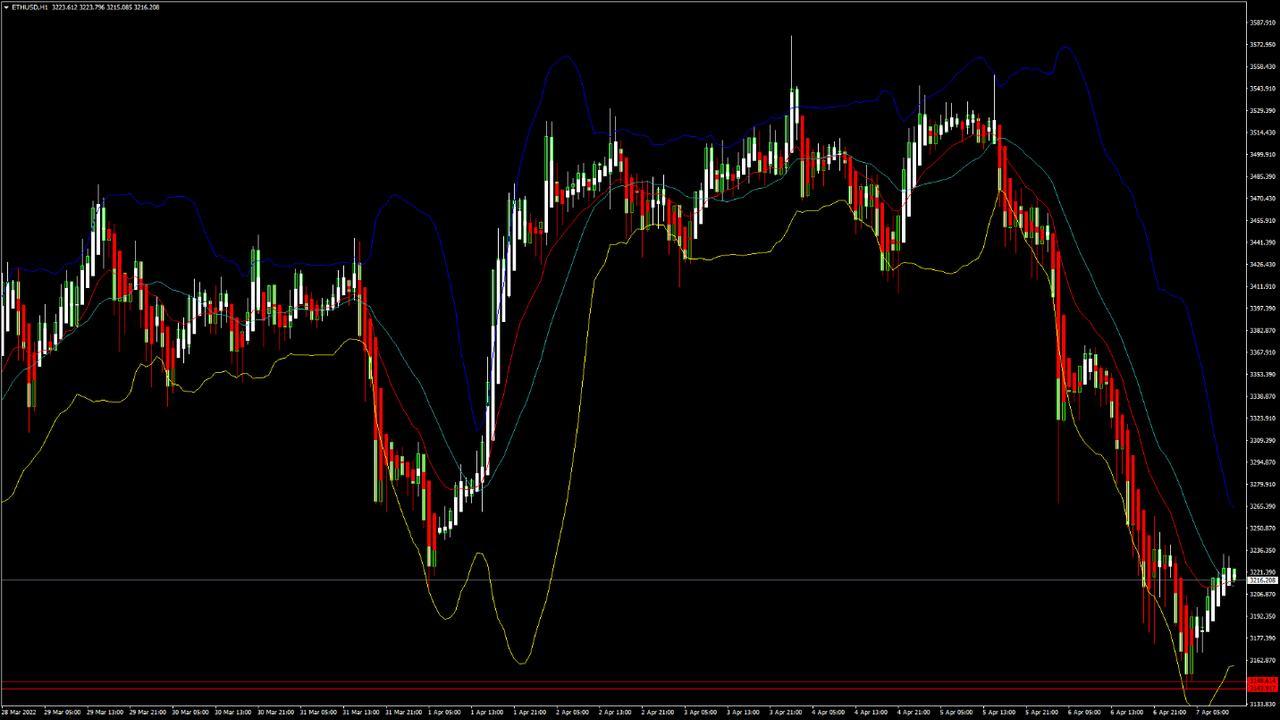
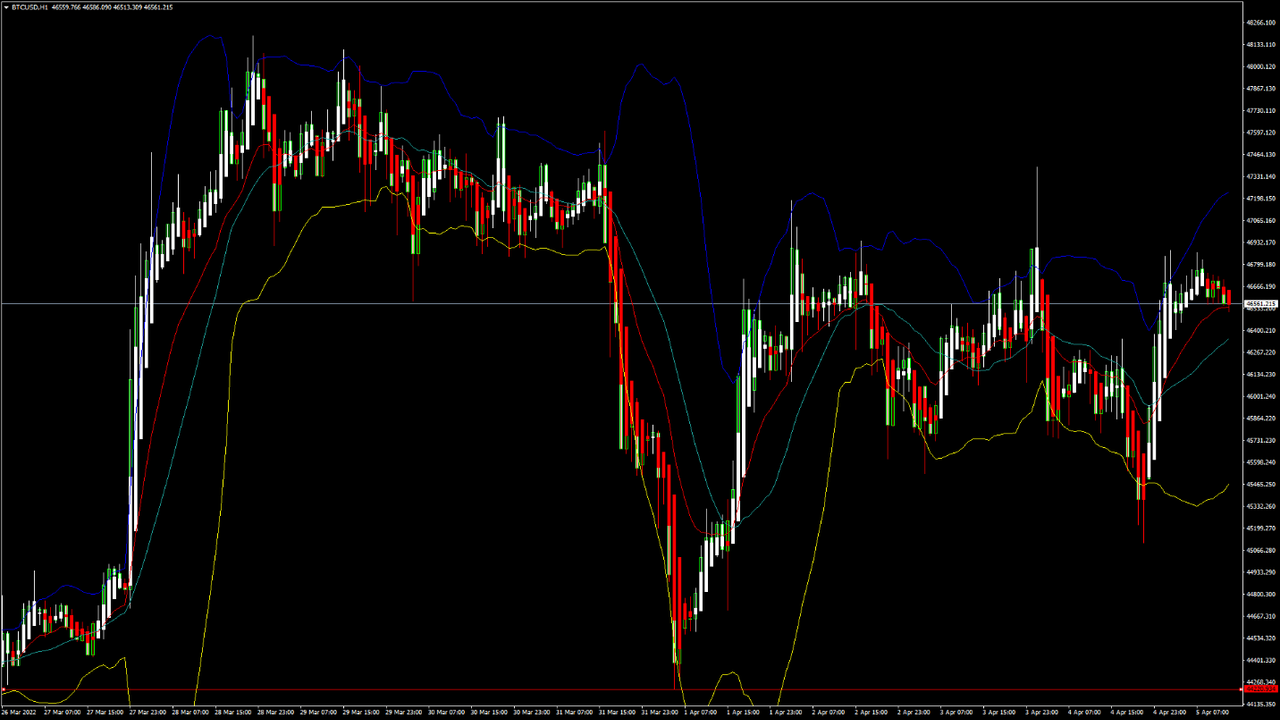
Bitcoin touched a high of $48,164 on March 28th , after which we saw some correction that pushed its price below the $45,000 handle.
We can see fresh buying pressure coming back into the markets, and bitcoin is trading above the $46,000 handle in the European trading session today.
We can see a rising trend channel in the medium term, which is expected to push the prices of BTCUSD towards the $50,000 handle.
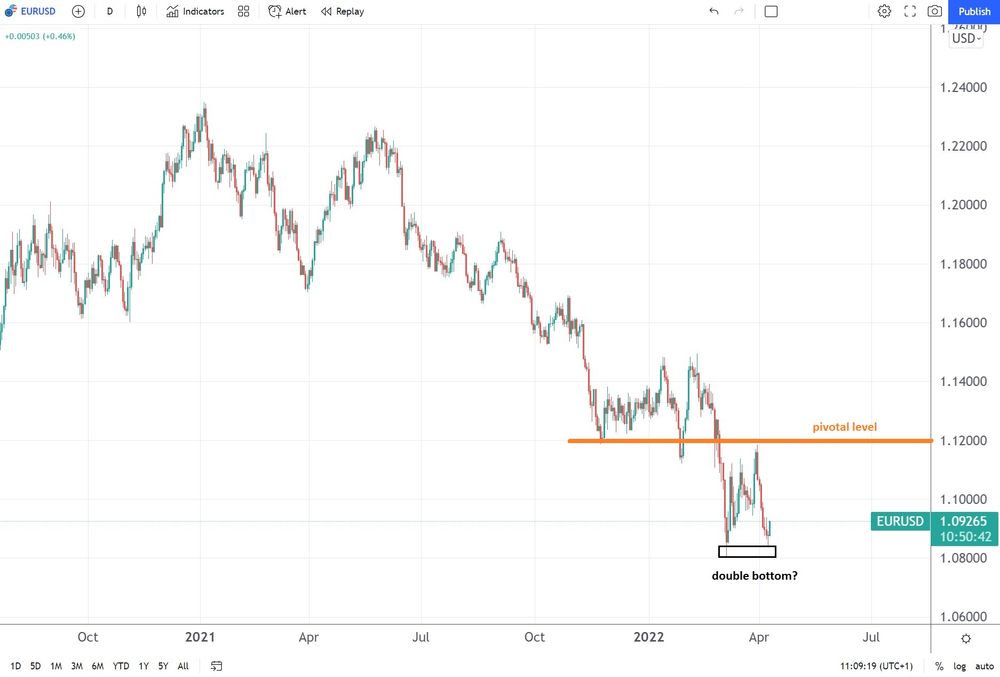
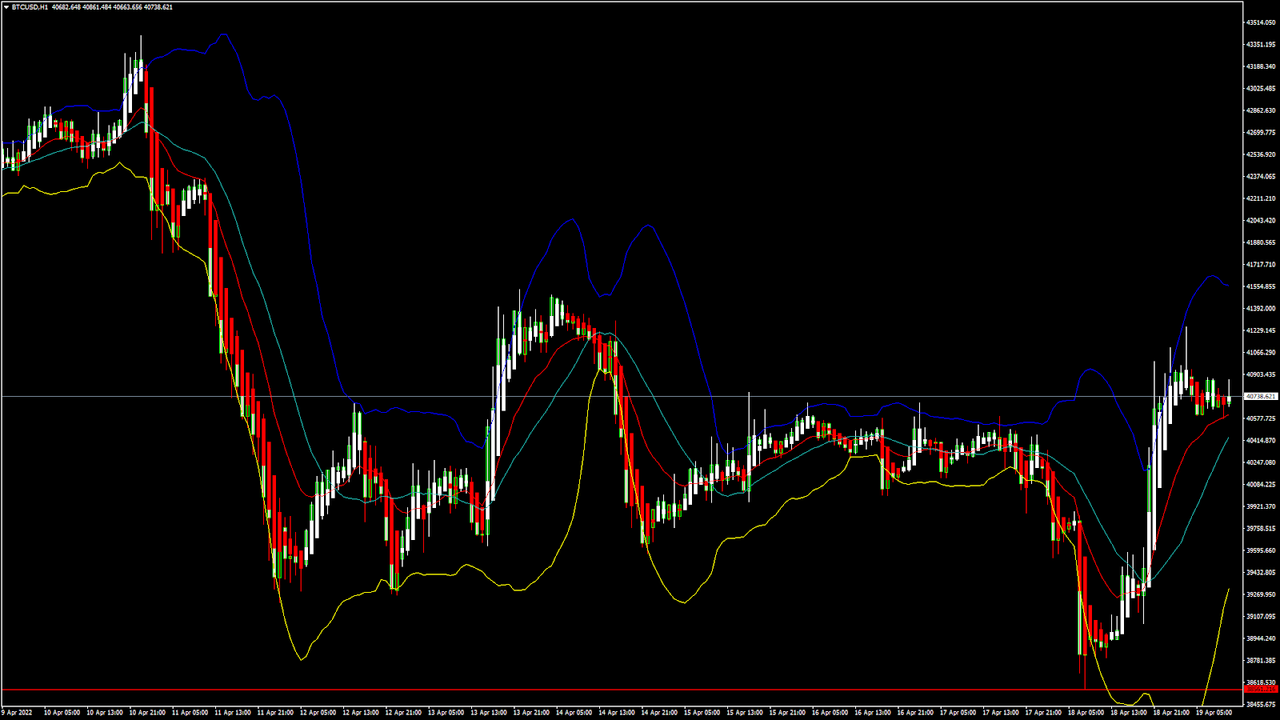
We can clearly see a double bottom pattern above the $44,000 handle, which is a bullish reversal pattern because it signifies the end of a downtrend and a shift towards an uptrend.
The Stoch and the Williams percent range are indicating an overbought level, which means that in the immediate short term, a decline in the price is expected.
The relative strength index is at 55, indicating a STRONG demand for bitcoin at the current market levels.
Bitcoin is now moving above its 100 hourly simple Ma, and its 200 hourly exponential MA.
All of the major technical indicators are giving a BUY signal, which means that in the immediate short term, we are expecting targets of 48,000 and 50,000.
The average true range is indicating a LESSER market volatility with a strong bullish momentum.
Bitcoin: Bullish Reversal Seen Above $44,000
Bitcoin continues to move in a mildly bullish momentum with an upwards projection towards the level of 48,000 in the European trading session today.
In the immediate short term, we are expecting a continuation of this bullish trend, with the prices of bitcoin ranging between $48,000 and $49,000 as it has entered into a consolidation phase now.
The drop in the level of BTCUSD that we saw last week happened due to the profit-taking by short-term investors.
The immediate short-term outlook for bitcoin is mildly bullish; the medium-term outlook is bullish; and the long-term outlook remains neutral under present market conditions.
The price of BTCUSD is now facing its classic resistance level of 46,735, and Fibonacci resistance level of 46,802, after which the path towards 48,000 will get cleared.
We can see that the daily RSI is also printing at 62 which indicates that in the medium-term, the prices are expected to appreciate further.
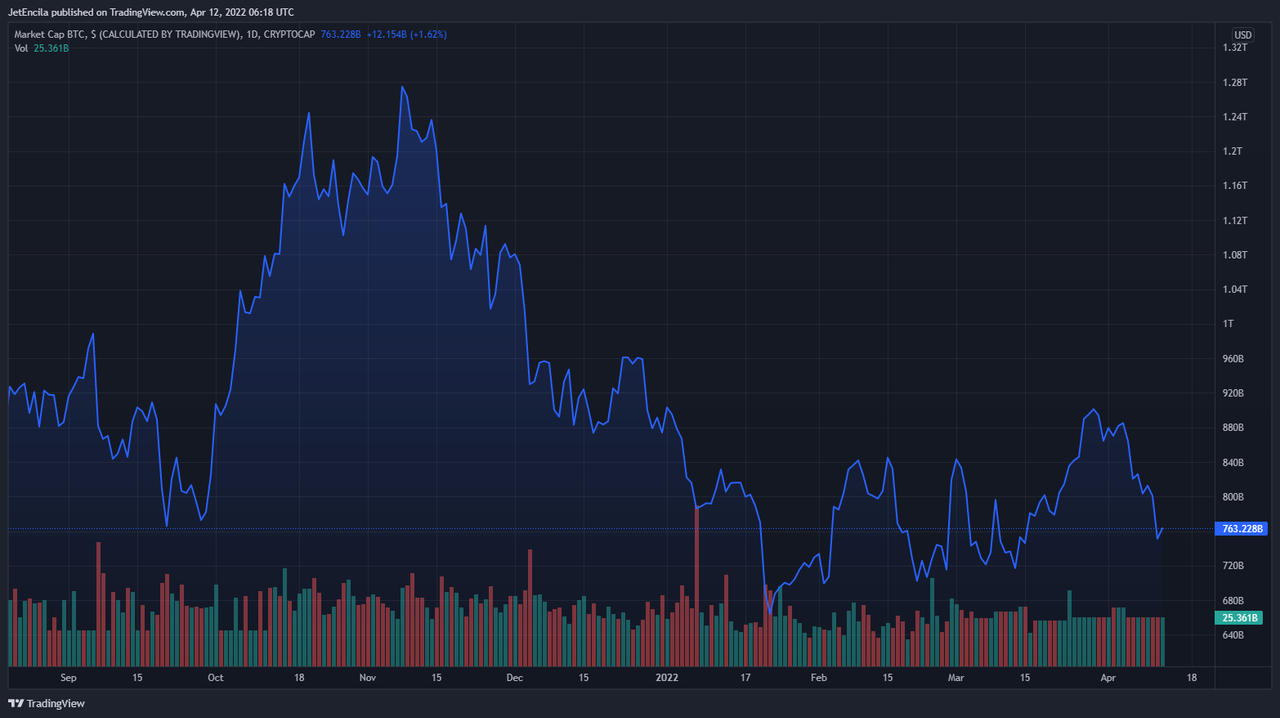
In the last 24hrs, BTCUSD has gone UP by 1.51% with a price change of $692, and has a 24hr trading volume of USD 30.612 billion. We can see an increase of 8.03% in the trading volume as compared to yesterday, which appears to be normal.
The Week Ahead
The price of bitcoin is now moving into a consolidation phase below $48,000. We can see some range-bound movements in the levels between $46,000 to $48,000.
The hourly RSI has also confirmed the rising trend channel which indicates that in the medium-term, prices are expected to move closer to the level of $50,000.
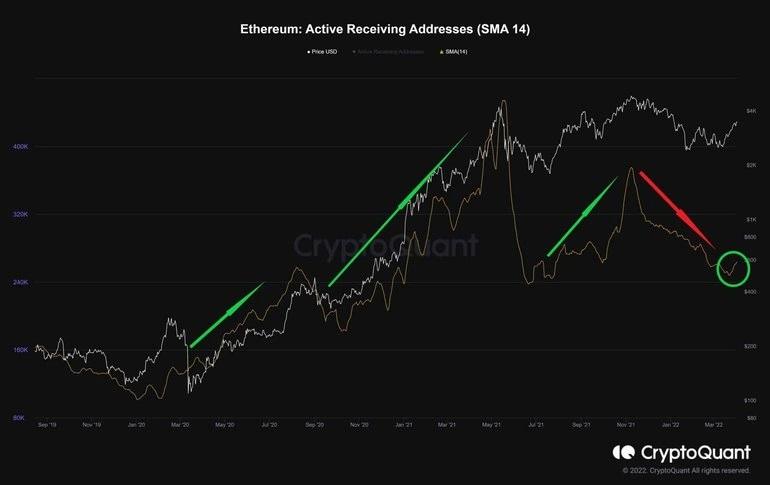
The on-chain metrics are also suggesting that after the present consolidation phase is over, we are aiming towards crossing the $50,000 handle.
In the immediate short term, bitcoin’s bullish momentum is expected to continue pushing above the $49,000 handle this week.
The prices of BTCUSD will need to remain above the important support level of $47,500 this week.
Weekly outlook is projected at $50,000 with a consolidation zone of $48,500.
Technical Indicators:
The rate of price change: at 10.13 indicating a BUY
The ultimate oscillator: at 51.55 indicating a BUY
Bull/Bear power(13-day): at 2289 indicating a BUY
The moving averages convergence divergence (12,26): at 1490 indicating a BUY
Read Full on FXOpen Company Blog...
BTCUSD: Double Bottom Pattern Above $44,000
Bitcoin touched a high of $48,164 on March 28th , after which we saw some correction that pushed its price below the $45,000 handle.
We can see fresh buying pressure coming back into the markets, and bitcoin is trading above the $46,000 handle in the European trading session today.
We can see a rising trend channel in the medium term, which is expected to push the prices of BTCUSD towards the $50,000 handle.
We can clearly see a double bottom pattern above the $44,000 handle, which is a bullish reversal pattern because it signifies the end of a downtrend and a shift towards an uptrend.
The Stoch and the Williams percent range are indicating an overbought level, which means that in the immediate short term, a decline in the price is expected.
The relative strength index is at 55, indicating a STRONG demand for bitcoin at the current market levels.
Bitcoin is now moving above its 100 hourly simple Ma, and its 200 hourly exponential MA.
All of the major technical indicators are giving a BUY signal, which means that in the immediate short term, we are expecting targets of 48,000 and 50,000.
The average true range is indicating a LESSER market volatility with a strong bullish momentum.
- A bullish reversal is seen in bitcoin above $44,000
- The StochRSI is indicating an OVERSOLD level
- The price is now trading just below its pivot level of $46,663
- All of the moving averages are giving a BUY market signal
Bitcoin: Bullish Reversal Seen Above $44,000
Bitcoin continues to move in a mildly bullish momentum with an upwards projection towards the level of 48,000 in the European trading session today.
In the immediate short term, we are expecting a continuation of this bullish trend, with the prices of bitcoin ranging between $48,000 and $49,000 as it has entered into a consolidation phase now.
The drop in the level of BTCUSD that we saw last week happened due to the profit-taking by short-term investors.
The immediate short-term outlook for bitcoin is mildly bullish; the medium-term outlook is bullish; and the long-term outlook remains neutral under present market conditions.
The price of BTCUSD is now facing its classic resistance level of 46,735, and Fibonacci resistance level of 46,802, after which the path towards 48,000 will get cleared.
We can see that the daily RSI is also printing at 62 which indicates that in the medium-term, the prices are expected to appreciate further.
In the last 24hrs, BTCUSD has gone UP by 1.51% with a price change of $692, and has a 24hr trading volume of USD 30.612 billion. We can see an increase of 8.03% in the trading volume as compared to yesterday, which appears to be normal.
The Week Ahead
The price of bitcoin is now moving into a consolidation phase below $48,000. We can see some range-bound movements in the levels between $46,000 to $48,000.
The hourly RSI has also confirmed the rising trend channel which indicates that in the medium-term, prices are expected to move closer to the level of $50,000.
The on-chain metrics are also suggesting that after the present consolidation phase is over, we are aiming towards crossing the $50,000 handle.
In the immediate short term, bitcoin’s bullish momentum is expected to continue pushing above the $49,000 handle this week.
The prices of BTCUSD will need to remain above the important support level of $47,500 this week.
Weekly outlook is projected at $50,000 with a consolidation zone of $48,500.
Technical Indicators:
The rate of price change: at 10.13 indicating a BUY
The ultimate oscillator: at 51.55 indicating a BUY
Bull/Bear power(13-day): at 2289 indicating a BUY
The moving averages convergence divergence (12,26): at 1490 indicating a BUY
Read Full on FXOpen Company Blog...