ETHUSD and LTCUSD Technical Analysis – 23rd DEC, 2021

ETHUSD: Head and Shoulders Pattern Below $4,000
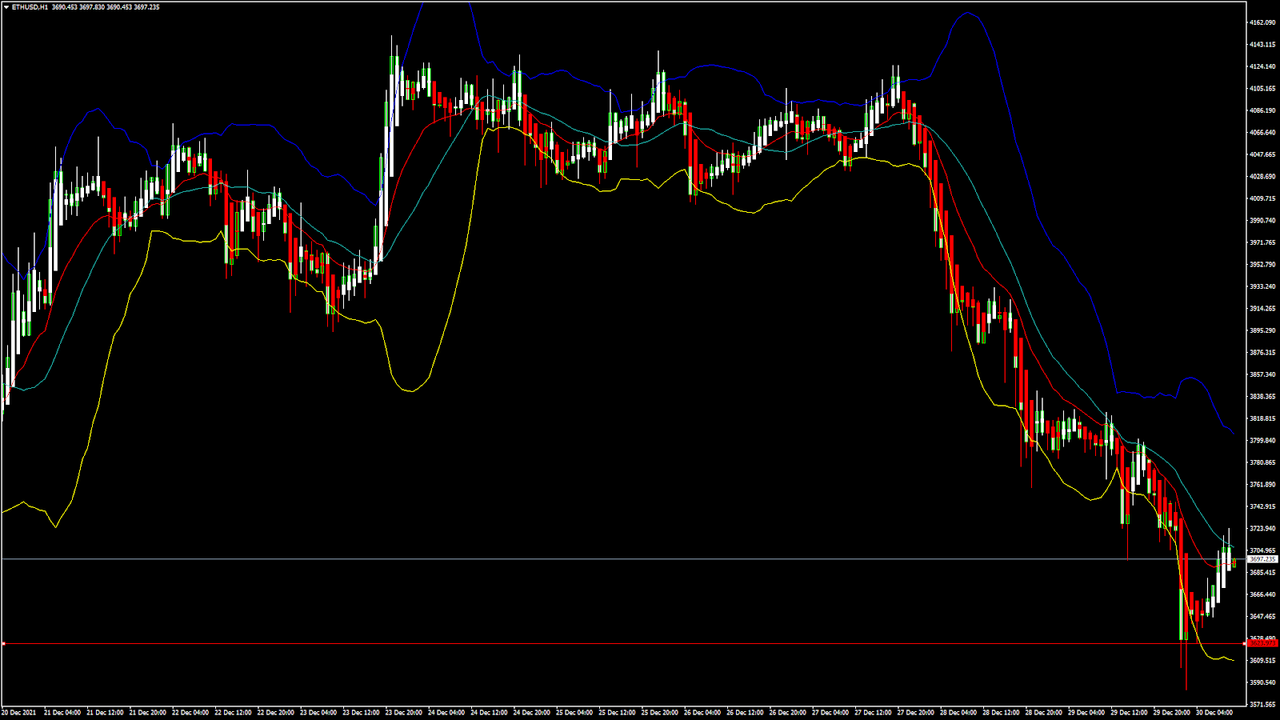
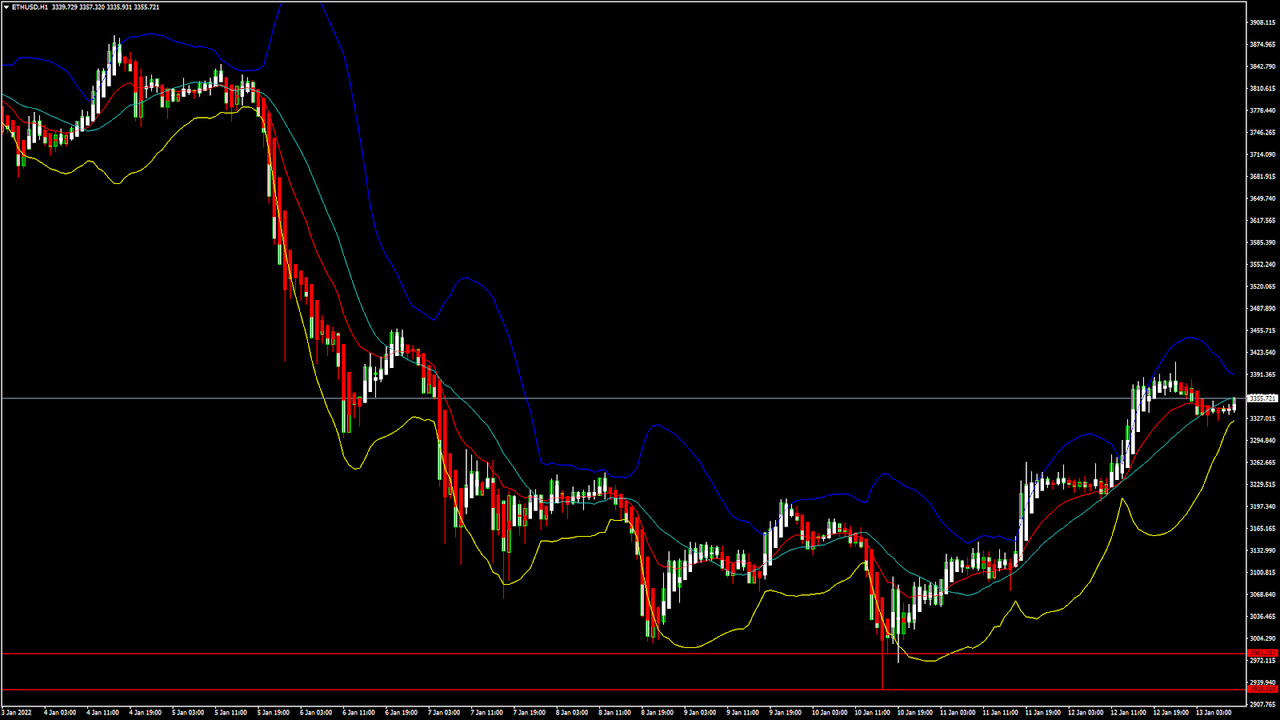
Ethereum was unable to sustain its bullish momentum and started its decline below the $4,000 handle in the Asian trading session today.
ETHUSD touched an intraday low of $3,894; the selling pressure continues in the European trading session. We can clearly see a head-and-shoulders pattern below the $4,000 handle which signifies that the prices will break out into a bearish downtrend.
ETH is now trading just below its pivot level of $3,926 and is moving in a bearish descending channel. The price of ETHUSD is about to break its classic support level of $3,890 and its Fibonacci support level of $3,903, after which the path towards $3,800 will get cleared.
All the major technical indicators are giving a STRONG SELL signal.
ETH is now trading below both its 100 hourly and 200 hourly simple moving averages.
Ether Bearish Trend Below $4,000 Confirmed
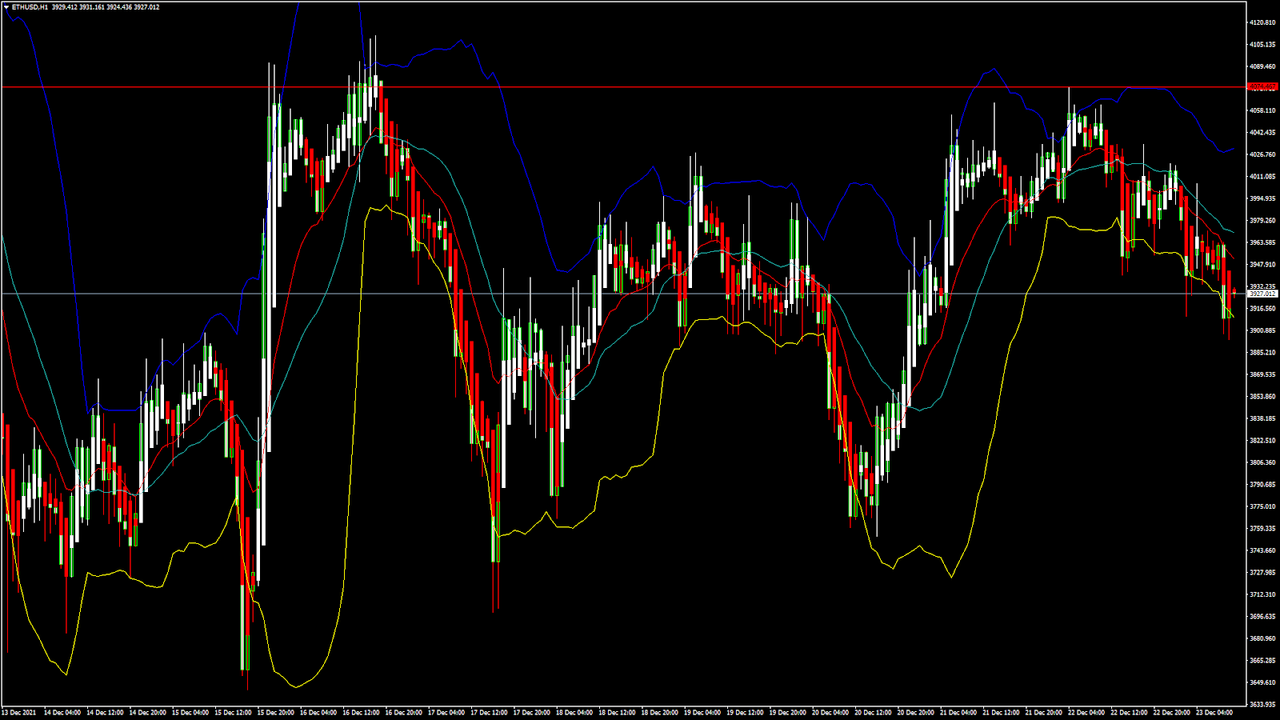
ETHUSD continues to move in a bearish channel with the price breaking below the important psychological support level of $4,000.
The relative strength index is below 50 today, which signifies a continuation of the bearish trend.
The amount of selling that is seen in Ethereum can also be attributed to the liquidation of crypto assets by global investors before the end of this financial year.
The average true range is indicating a low market volatility, and we can see an increase of 10.67% in the trading volume, as compared to yesterday.
We can also see Ethereum’s decoupling from bitcoin which means that the correlation between BTC and ETH is dropping.
ETH has lost -2.67% with a price change of 107.06$ in the past 24hrs, and has a trading volume of 15.165 billion USD.
The Week Ahead
Ether is printing below the $4,000 mark today, and we can expect the downtrend to continue this week pushing its price down to the levels of $3,800 and $3,750.
The immediate short-term outlook for Ether has turned negative, but the medium to long-term outlook remains bullish with the next month target of above $5,000. The recent downturn has also led to the decline in the market capitalization of Ethereum to 467.11 billion USD.
We are now looking at the end-of-the-year market liquidation where many of the investors are selling their long-term holdings in Ethereum; they are expected to be back in the markets in the month of January 2022.
Technical Indicators:
Ultimate oscillator: at 48.80 indicating a SELL
Moving averages convergence divergence (14-day): at -19.80 indicating a SELL
StochRSI (14-day): at 26.95 indicating a SELL
Commodity channel index (14-day): at -132.99 indicating a SELL
Read Full on FXOpen Company Blog...
ETHUSD: Head and Shoulders Pattern Below $4,000
Ethereum was unable to sustain its bullish momentum and started its decline below the $4,000 handle in the Asian trading session today.
ETHUSD touched an intraday low of $3,894; the selling pressure continues in the European trading session. We can clearly see a head-and-shoulders pattern below the $4,000 handle which signifies that the prices will break out into a bearish downtrend.
ETH is now trading just below its pivot level of $3,926 and is moving in a bearish descending channel. The price of ETHUSD is about to break its classic support level of $3,890 and its Fibonacci support level of $3,903, after which the path towards $3,800 will get cleared.
All the major technical indicators are giving a STRONG SELL signal.
ETH is now trading below both its 100 hourly and 200 hourly simple moving averages.
- Ethereum trend reversal is seen below the $4,000 mark
- Short-term range appears to be bearish for ETHUSD
- All the moving averages are giving a STRONG SELL signal
- The average true range is indicating LESSER market volatility
Ether Bearish Trend Below $4,000 Confirmed
ETHUSD continues to move in a bearish channel with the price breaking below the important psychological support level of $4,000.
The relative strength index is below 50 today, which signifies a continuation of the bearish trend.
The amount of selling that is seen in Ethereum can also be attributed to the liquidation of crypto assets by global investors before the end of this financial year.
The average true range is indicating a low market volatility, and we can see an increase of 10.67% in the trading volume, as compared to yesterday.
We can also see Ethereum’s decoupling from bitcoin which means that the correlation between BTC and ETH is dropping.
ETH has lost -2.67% with a price change of 107.06$ in the past 24hrs, and has a trading volume of 15.165 billion USD.
The Week Ahead
Ether is printing below the $4,000 mark today, and we can expect the downtrend to continue this week pushing its price down to the levels of $3,800 and $3,750.
The immediate short-term outlook for Ether has turned negative, but the medium to long-term outlook remains bullish with the next month target of above $5,000. The recent downturn has also led to the decline in the market capitalization of Ethereum to 467.11 billion USD.
We are now looking at the end-of-the-year market liquidation where many of the investors are selling their long-term holdings in Ethereum; they are expected to be back in the markets in the month of January 2022.
Technical Indicators:
Ultimate oscillator: at 48.80 indicating a SELL
Moving averages convergence divergence (14-day): at -19.80 indicating a SELL
StochRSI (14-day): at 26.95 indicating a SELL
Commodity channel index (14-day): at -132.99 indicating a SELL
Read Full on FXOpen Company Blog...