FxGrow Daily Technical Analysis – 16th Nov, 2015
By FxGrow Research & Analysis Team
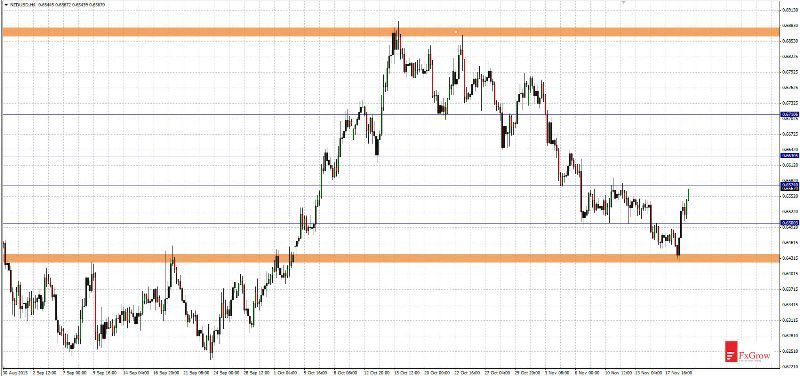
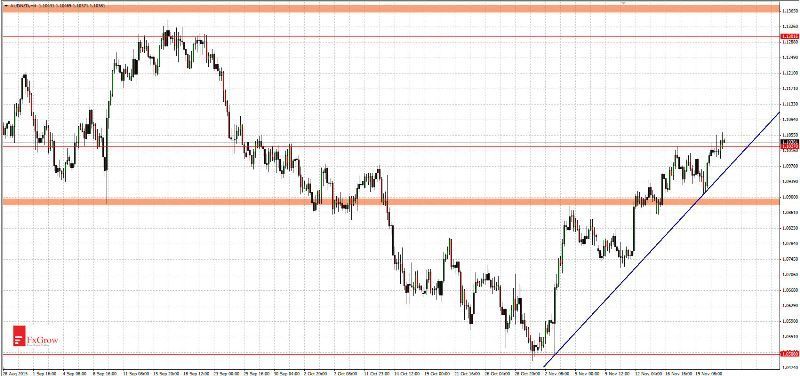
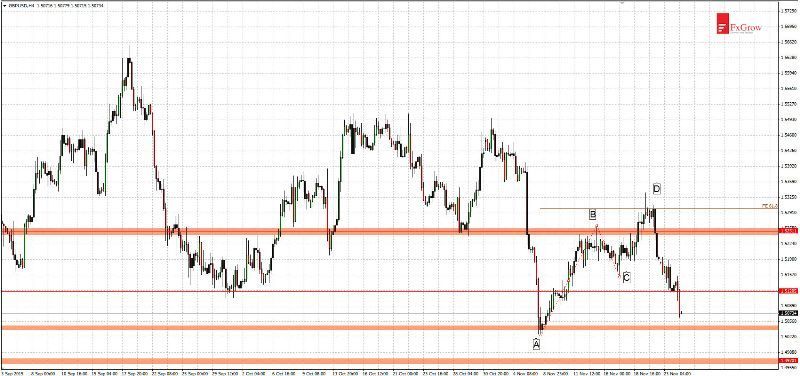
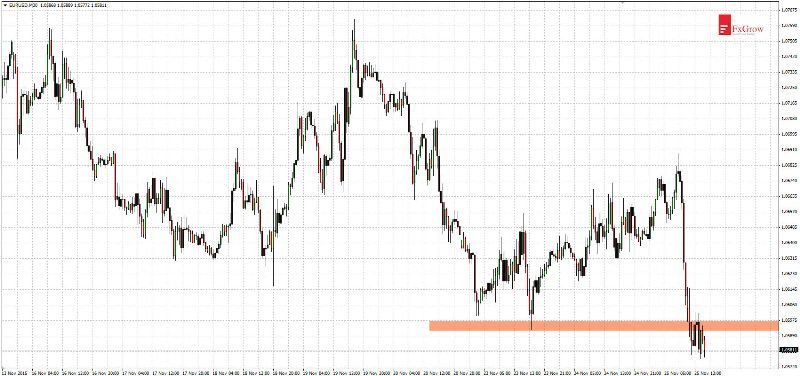
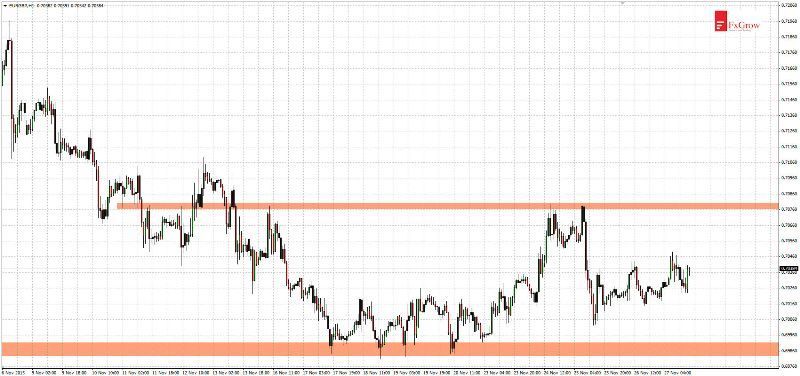
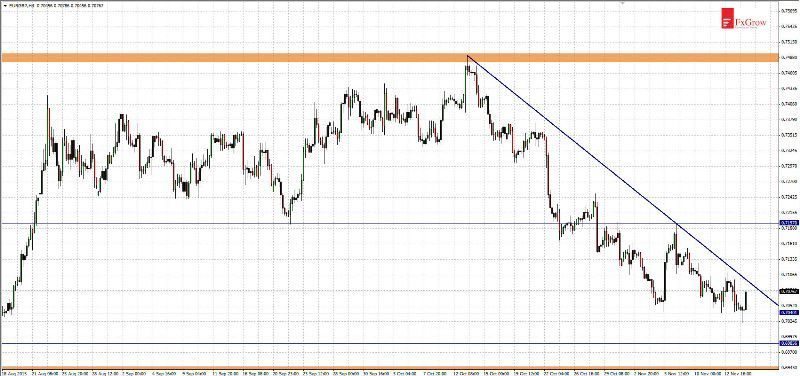
EURGBP - on the 3-months low
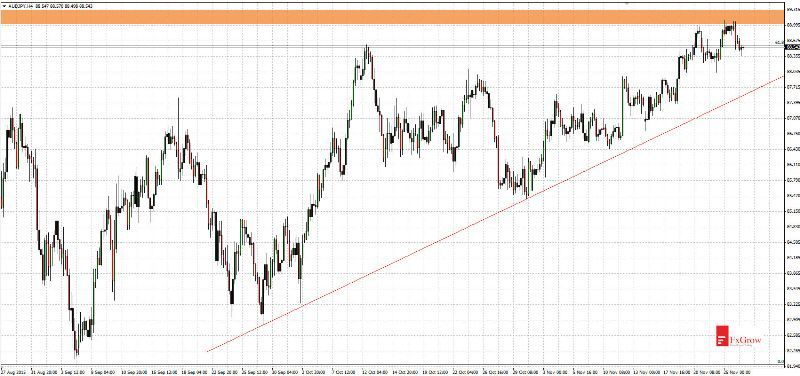
Since mid-October EURGBP moves in a downward trend. Trend is set by downtrend line led after the highs. Currently this trend line is at the level 0.7100. Today morning support was break below for a short time at the level 0.7040. This level stopped the declines for a two weeks. After this fakey price dynamically rebounded to 0.7100.
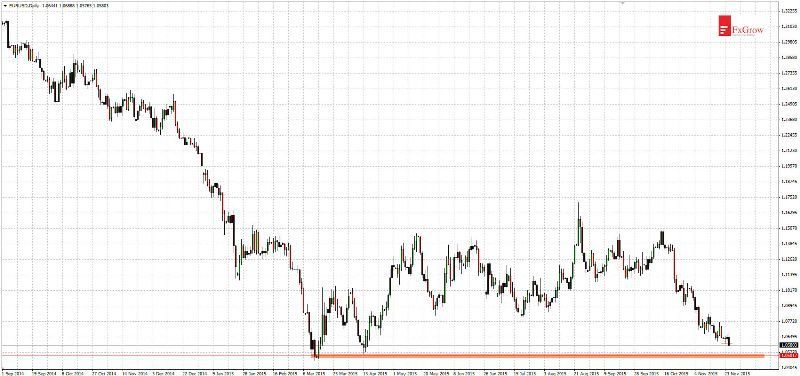
On EURGBP there is a downtrend in the force what was today confirmed by another new low. Only after permanent break above level 0.7100 traders can think about trend reversal. More likely is rebound and further declines with the test of strong support at level 0.6940. Before that test supply must break below two weaker supports 0.7040 and 0.6980. Since February 2015 EURGBP moves between levels 0.7480 - 0.6940 therefore test of support at 0.6940 should reach rebound and short-term uptrend movement.
For more in depth Research & Analysis please visit FxGrowhttps://secure.fxgrow.com/b.php?cid...yb3cuY29tL3Byb21vX2RldGFpbHMucGhwP2Fkc19pZD02.
Note: This analysis is intended to provide general information and does not constitute the provision of INVESTMENT ADVICE. Investors should, before acting on this information, consider the appropriateness of this information having regard to their personal objectives, financial situation or needs. We recommend investors obtain investment advice specific to their situation before making any financial investment decision.
By FxGrow Research & Analysis Team
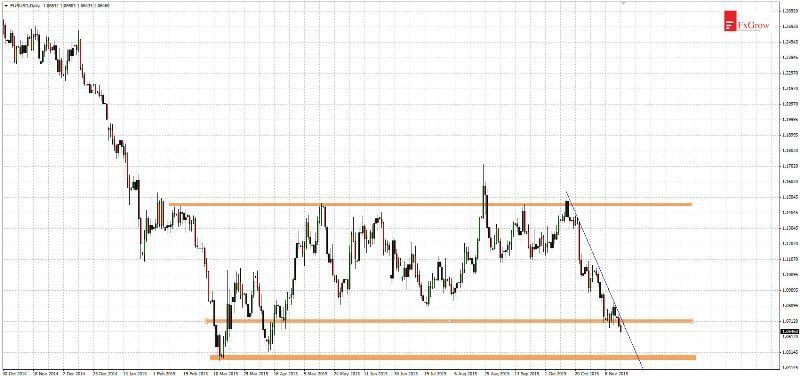
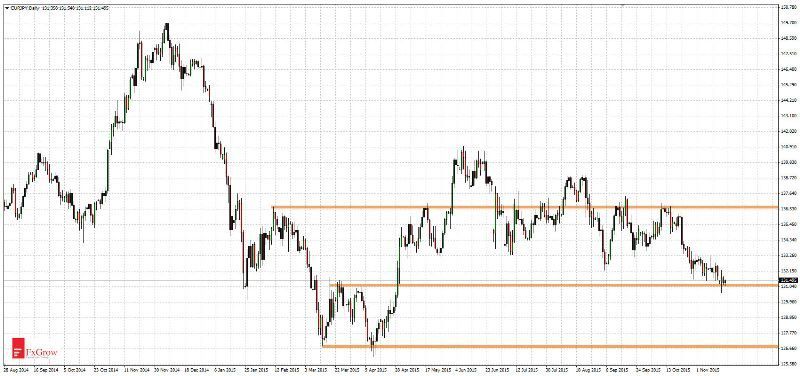
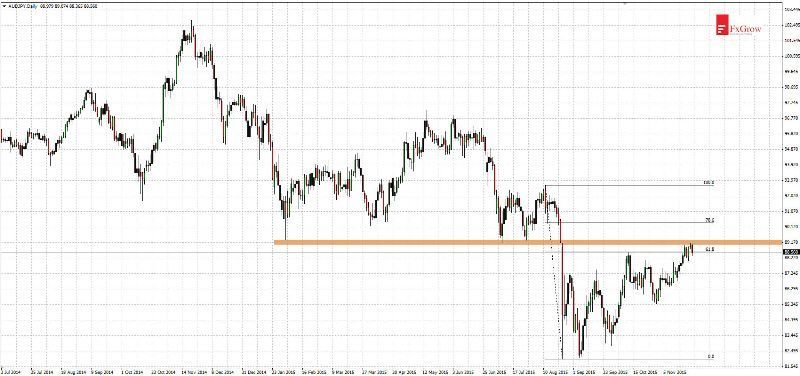
EURGBP - on the 3-months low
Since mid-October EURGBP moves in a downward trend. Trend is set by downtrend line led after the highs. Currently this trend line is at the level 0.7100. Today morning support was break below for a short time at the level 0.7040. This level stopped the declines for a two weeks. After this fakey price dynamically rebounded to 0.7100.
On EURGBP there is a downtrend in the force what was today confirmed by another new low. Only after permanent break above level 0.7100 traders can think about trend reversal. More likely is rebound and further declines with the test of strong support at level 0.6940. Before that test supply must break below two weaker supports 0.7040 and 0.6980. Since February 2015 EURGBP moves between levels 0.7480 - 0.6940 therefore test of support at 0.6940 should reach rebound and short-term uptrend movement.
For more in depth Research & Analysis please visit FxGrowhttps://secure.fxgrow.com/b.php?cid...yb3cuY29tL3Byb21vX2RldGFpbHMucGhwP2Fkc19pZD02.
Note: This analysis is intended to provide general information and does not constitute the provision of INVESTMENT ADVICE. Investors should, before acting on this information, consider the appropriateness of this information having regard to their personal objectives, financial situation or needs. We recommend investors obtain investment advice specific to their situation before making any financial investment decision.