FxGrow Daily Technical Analysis – 23rd Sept, 2015
By FxGrow Research & Analysis Team
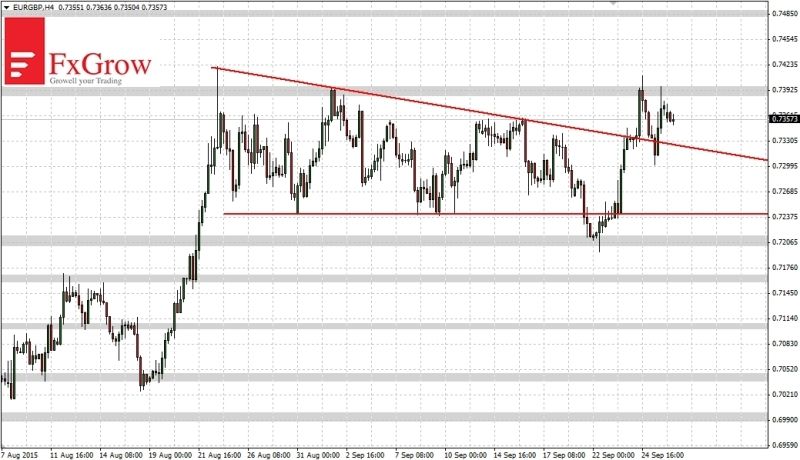
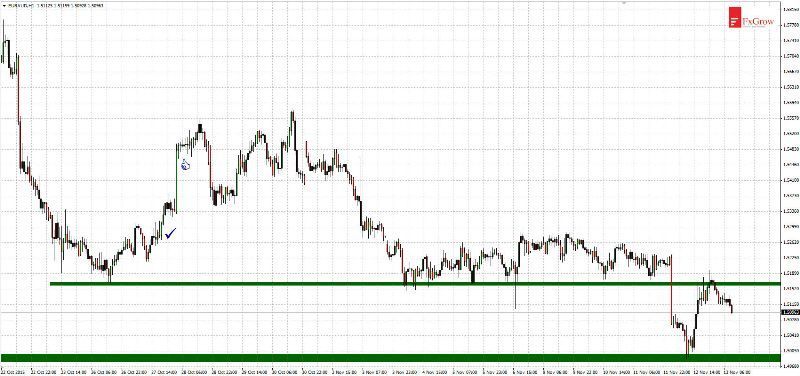
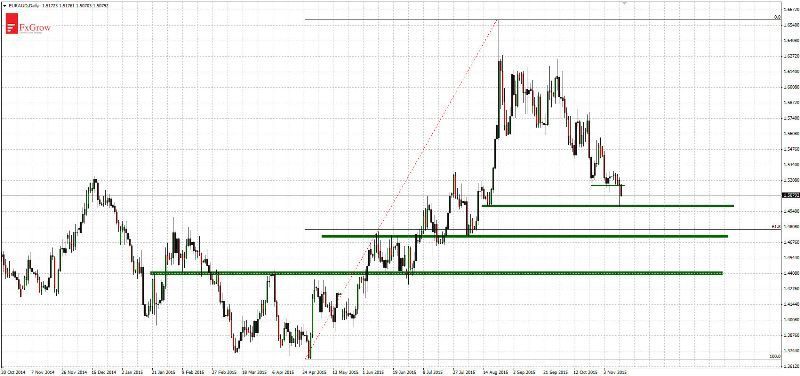
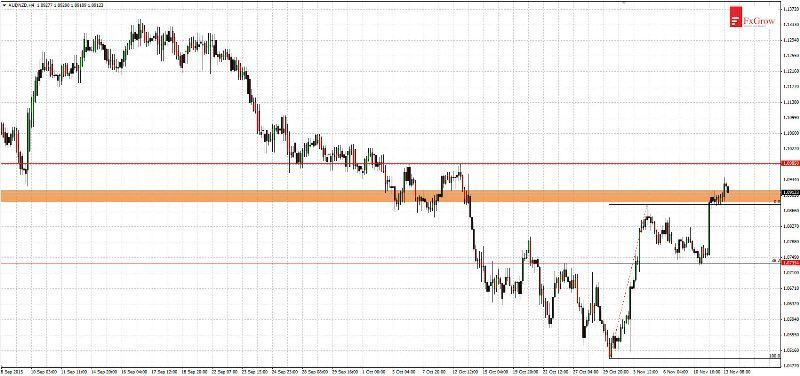
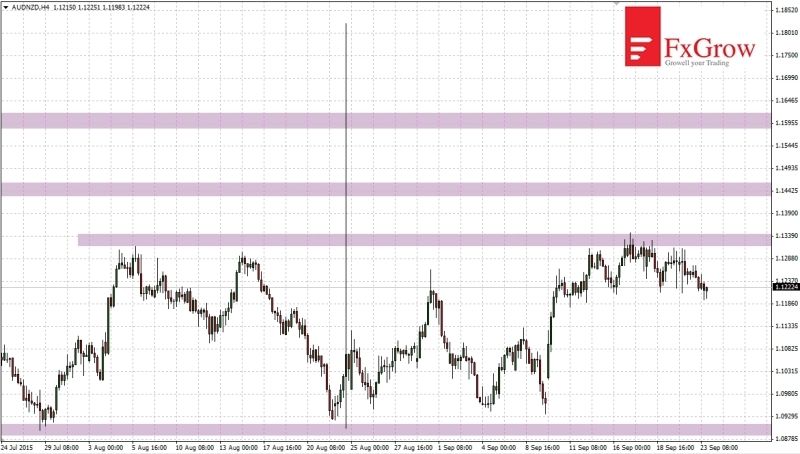
AUDNZD - a trend reversal or just a corrective rebound?
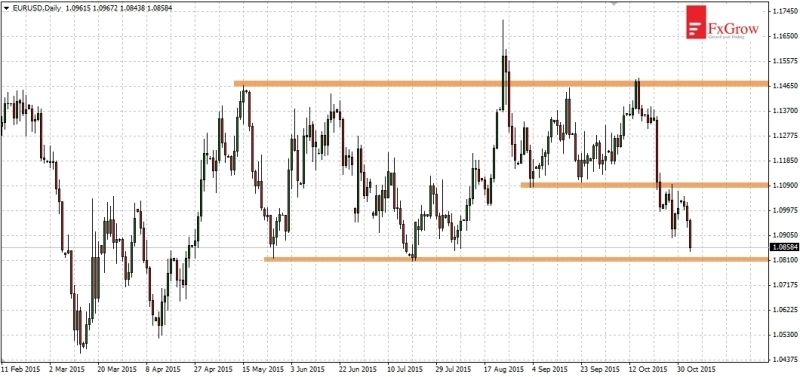
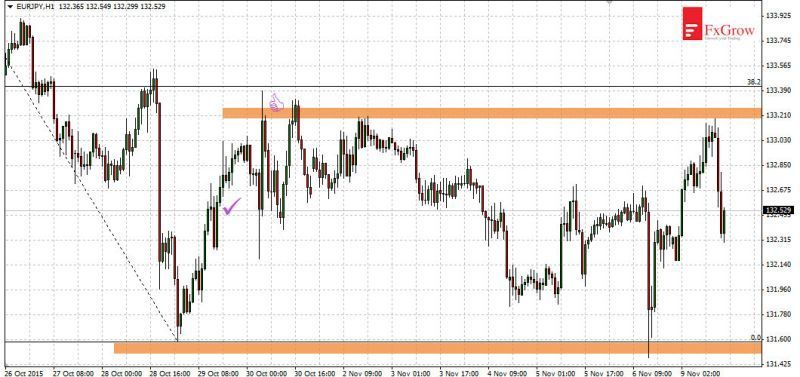
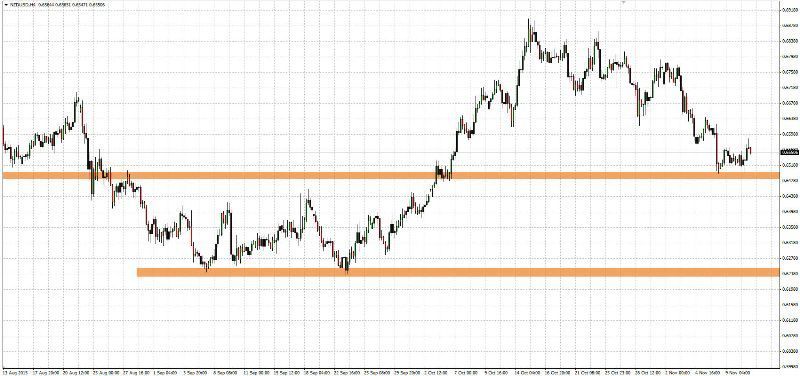
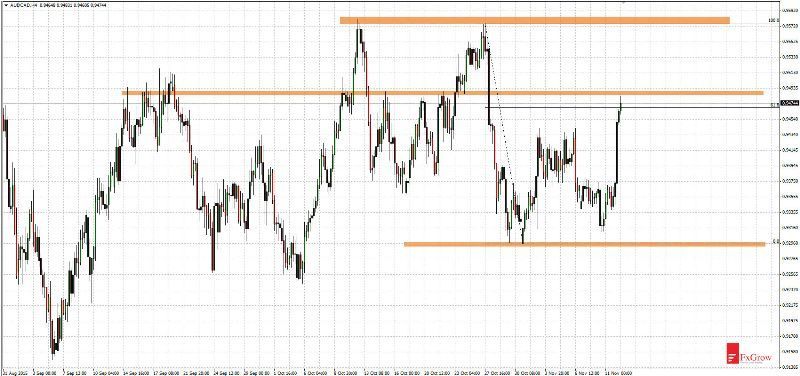
Since 4 months AUDNZD moves in a consolidation between 1.0900 and 1.1430. On August 24 there was a dynamic upward movement. Within a 30 minutes candle price moves up and fall about 900 pips. Since then the price has reduced the range of its movement. Right now it moves in the consolidation between 1.0900 and 1.1340. AUDNZD now rebounded from the resistance at the indicated level and is heading 1.0900.
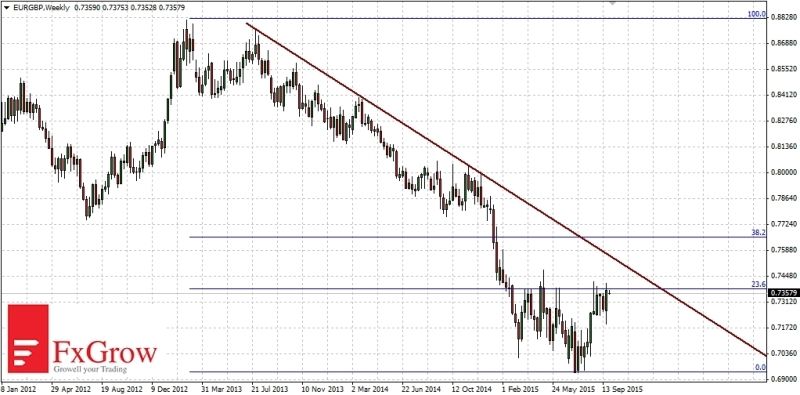
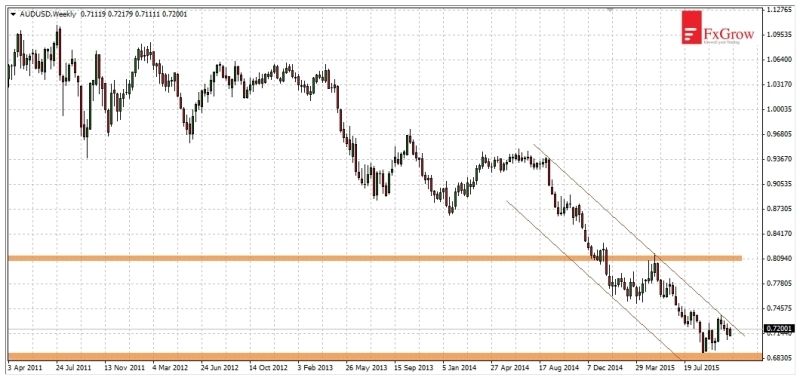
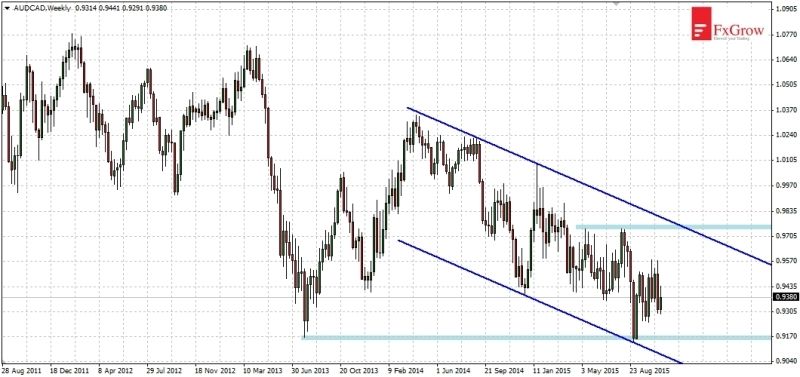
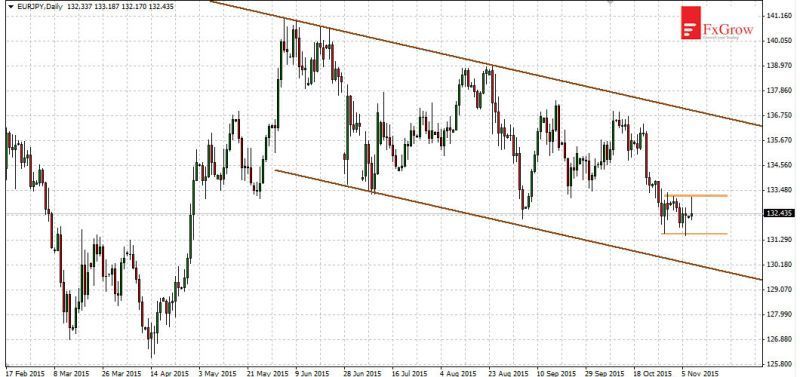
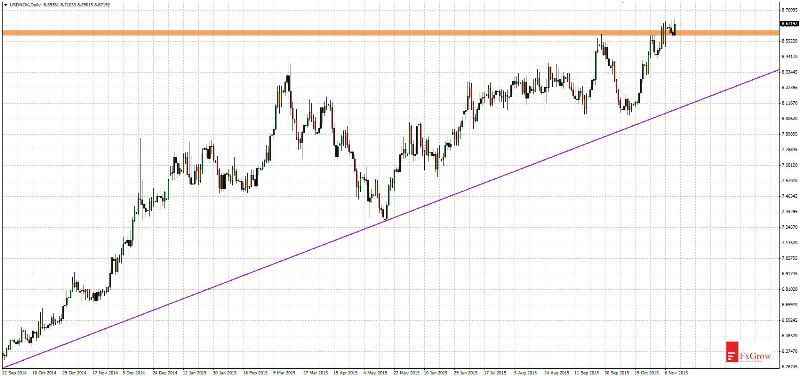
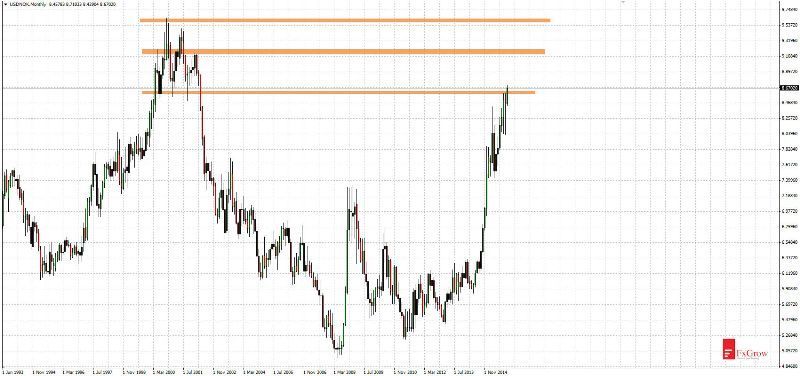
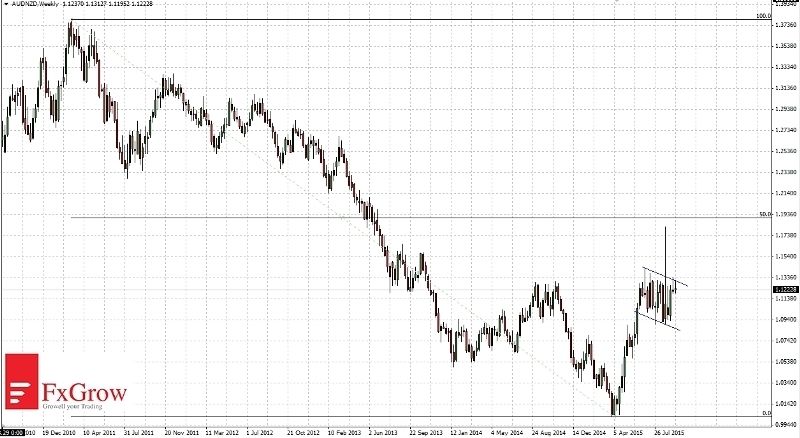
Wider view, interval W1
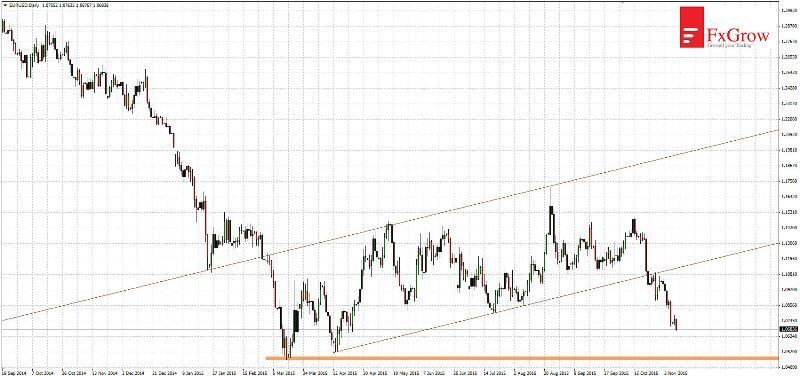
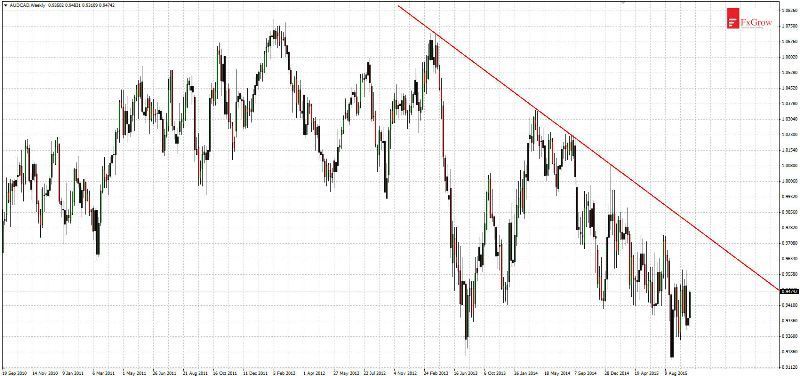
Since 5 years AUDNZD moves in a downward trend but the minimum, which took place at the beginning of April this year, begins to indicate a possibility of trend reversal. Direction of breakout from flag will be very important. Flag is a pattern of trend continuation and it should be break above. Break above will give a chance even to trend reversal. However, if the flag breaks below, then this whole movement will take the form of a rebound and AUD/NZD will come back to the main trend (the downward one).
For more in depth Research & Analysis please visit FxGrow.
Note: This analysis is intended to provide general information and does not constitute the provision of INVESTMENT ADVICE. Investors should, before acting on this information, consider the appropriateness of this information having regard to their personal objectives, financial situation or needs. We recommend investors obtain investment advice specific to their situation before making any financial investment decision.
By FxGrow Research & Analysis Team
AUDNZD - a trend reversal or just a corrective rebound?
Since 4 months AUDNZD moves in a consolidation between 1.0900 and 1.1430. On August 24 there was a dynamic upward movement. Within a 30 minutes candle price moves up and fall about 900 pips. Since then the price has reduced the range of its movement. Right now it moves in the consolidation between 1.0900 and 1.1340. AUDNZD now rebounded from the resistance at the indicated level and is heading 1.0900.
Wider view, interval W1
Since 5 years AUDNZD moves in a downward trend but the minimum, which took place at the beginning of April this year, begins to indicate a possibility of trend reversal. Direction of breakout from flag will be very important. Flag is a pattern of trend continuation and it should be break above. Break above will give a chance even to trend reversal. However, if the flag breaks below, then this whole movement will take the form of a rebound and AUD/NZD will come back to the main trend (the downward one).
For more in depth Research & Analysis please visit FxGrow.
Note: This analysis is intended to provide general information and does not constitute the provision of INVESTMENT ADVICE. Investors should, before acting on this information, consider the appropriateness of this information having regard to their personal objectives, financial situation or needs. We recommend investors obtain investment advice specific to their situation before making any financial investment decision.