FxGrow Daily Technical Analysis – 14th Dec, 2015
By FxGrow Research & Analysis Team
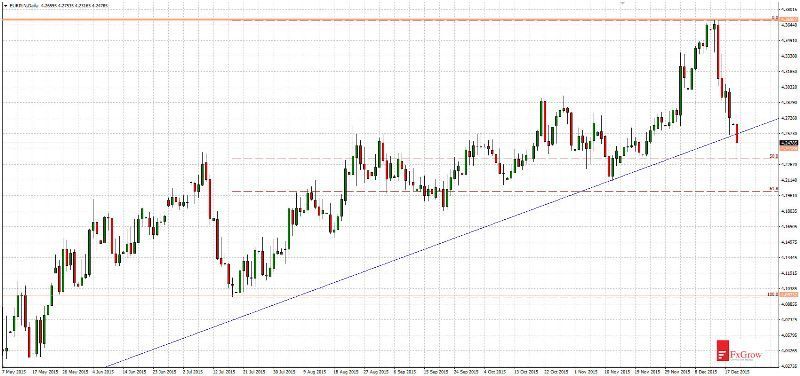
USDCAD - new highs, but resistance is on the horizon
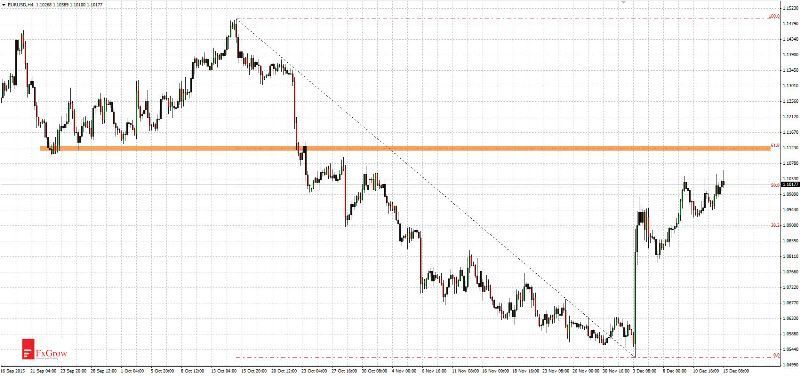
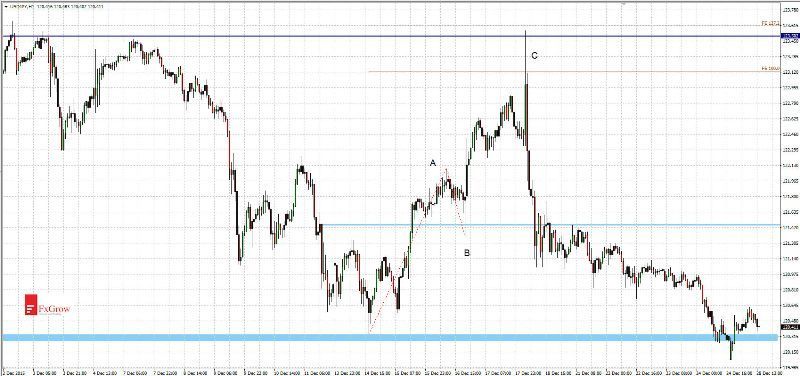
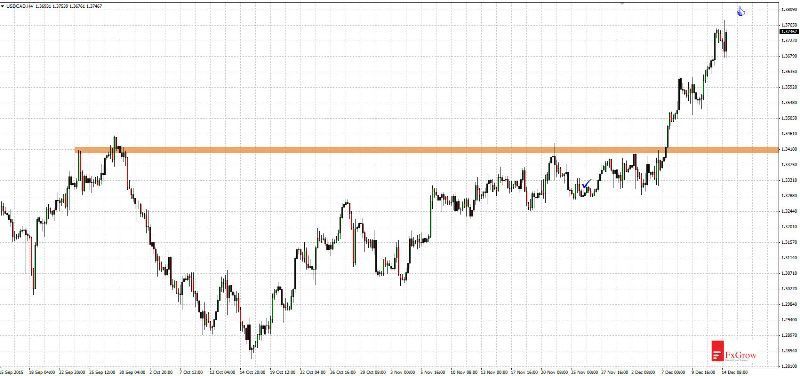
Previous analysis USDCAD from November 26 gave more than a 400 pips profit. I wrote: "In the coming days demand should carry out another attack at the resistance 1.3400" and "if this resistance will be broken, next target for demand is at the level 1.3860". Actually continuation of upward movement is very dynamic and today price tested 1.3780 level.
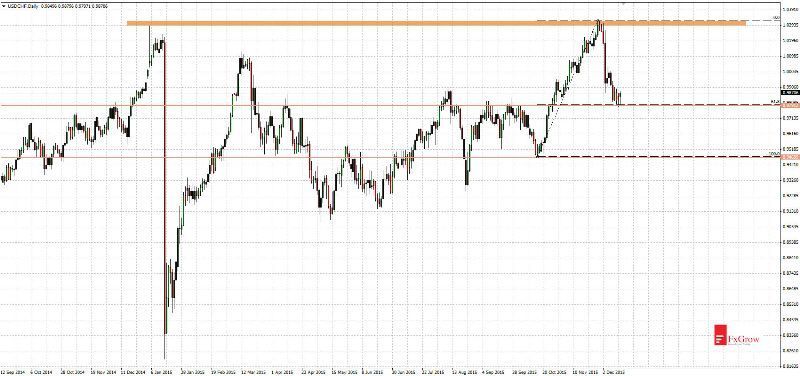
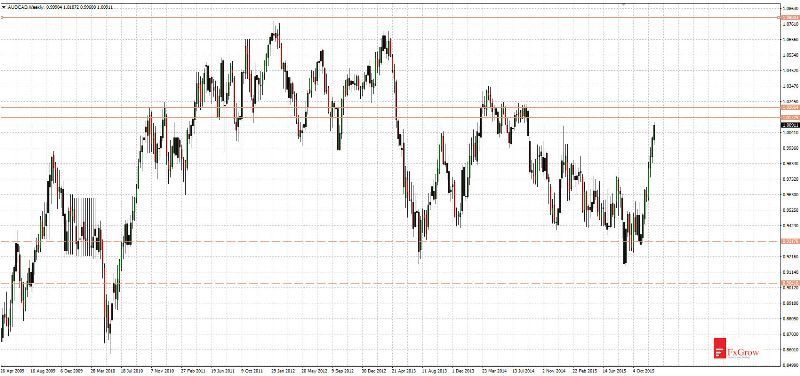
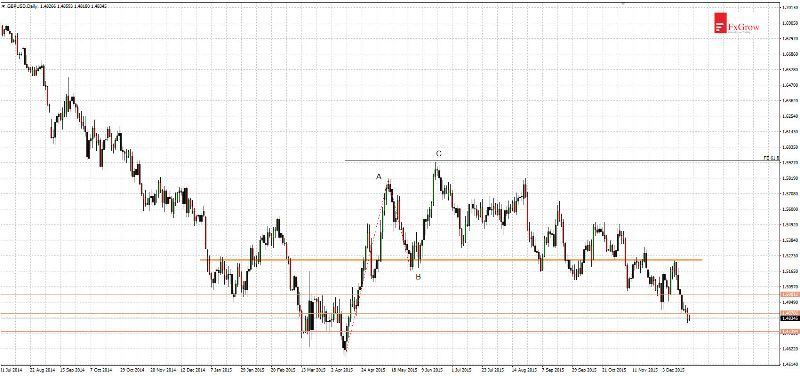
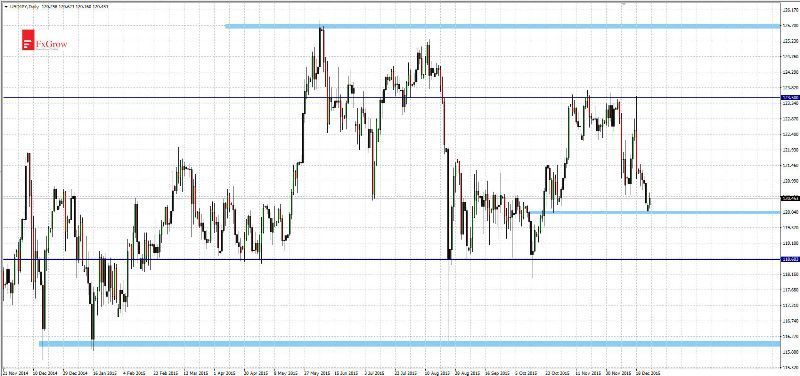
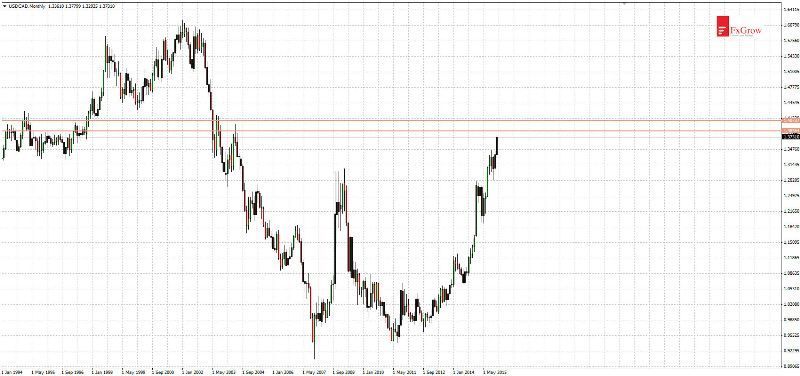
Since 2004 price wasn't at such high levels. Currently next resistances should be looking for at monthly time-frame. It should be noted that levels from monthly time-frame aren't precise. Nearest resistances are at area: 1.3860, 1.4070. If there will be a correction nearest support is at 1.3430 level.
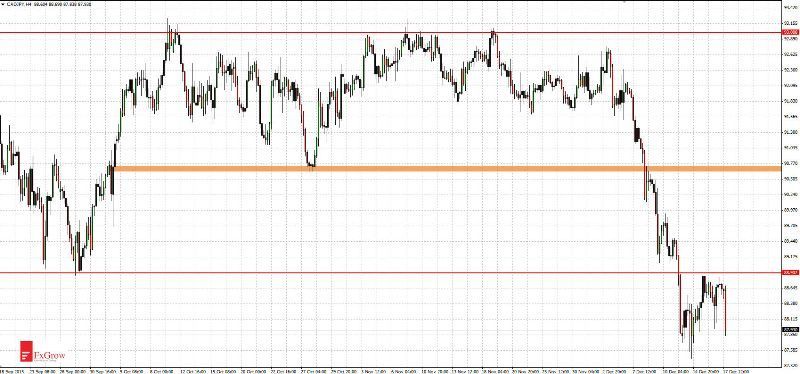
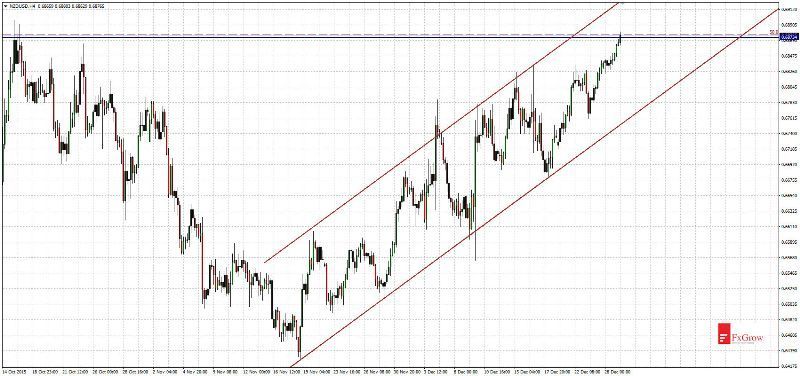
Time-frame H4
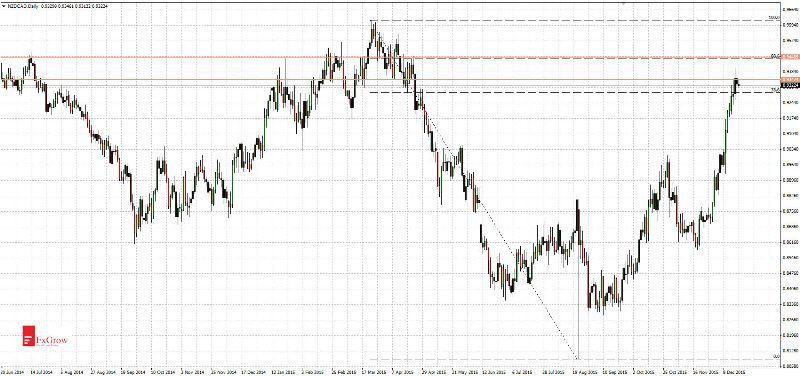
Time-frame monthly
For more in depth Research & Analysis please visit FxGrowhttps://secure.fxgrow.com/b.php?cid...yb3cuY29tL3Byb21vX2RldGFpbHMucGhwP2Fkc19pZD02.
Note: This analysis is intended to provide general information and does not constitute the provision of INVESTMENT ADVICE. Investors should, before acting on this information, consider the appropriateness of this information having regard to their personal objectives, financial situation or needs. We recommend investors obtain investment advice specific to their situation before making any financial investment decision.
By FxGrow Research & Analysis Team
USDCAD - new highs, but resistance is on the horizon
Previous analysis USDCAD from November 26 gave more than a 400 pips profit. I wrote: "In the coming days demand should carry out another attack at the resistance 1.3400" and "if this resistance will be broken, next target for demand is at the level 1.3860". Actually continuation of upward movement is very dynamic and today price tested 1.3780 level.
Since 2004 price wasn't at such high levels. Currently next resistances should be looking for at monthly time-frame. It should be noted that levels from monthly time-frame aren't precise. Nearest resistances are at area: 1.3860, 1.4070. If there will be a correction nearest support is at 1.3430 level.
Time-frame H4
Time-frame monthly
For more in depth Research & Analysis please visit FxGrowhttps://secure.fxgrow.com/b.php?cid...yb3cuY29tL3Byb21vX2RldGFpbHMucGhwP2Fkc19pZD02.
Note: This analysis is intended to provide general information and does not constitute the provision of INVESTMENT ADVICE. Investors should, before acting on this information, consider the appropriateness of this information having regard to their personal objectives, financial situation or needs. We recommend investors obtain investment advice specific to their situation before making any financial investment decision.