FxGrow Daily Technical Analysis – 09th Sept, 2015
By FxGrow Research & Analysis Team
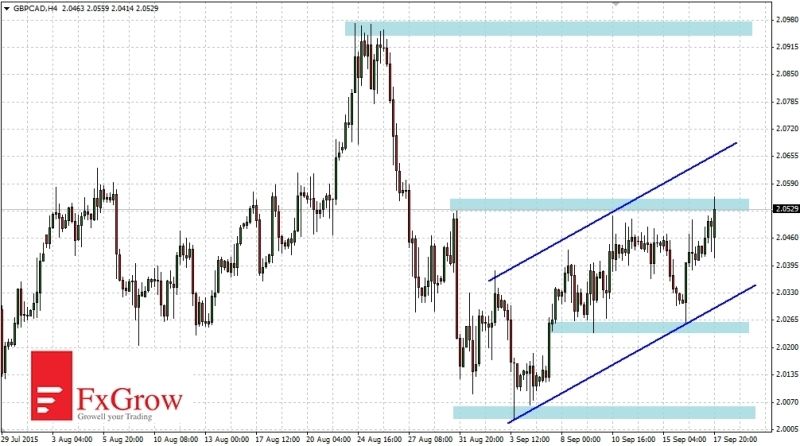
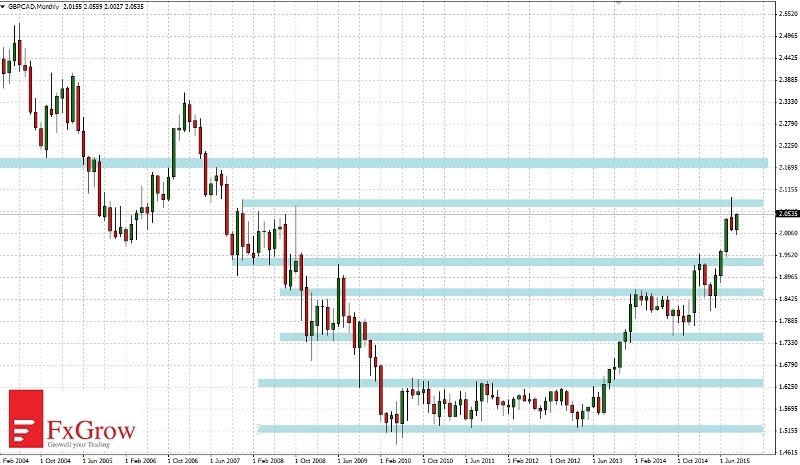
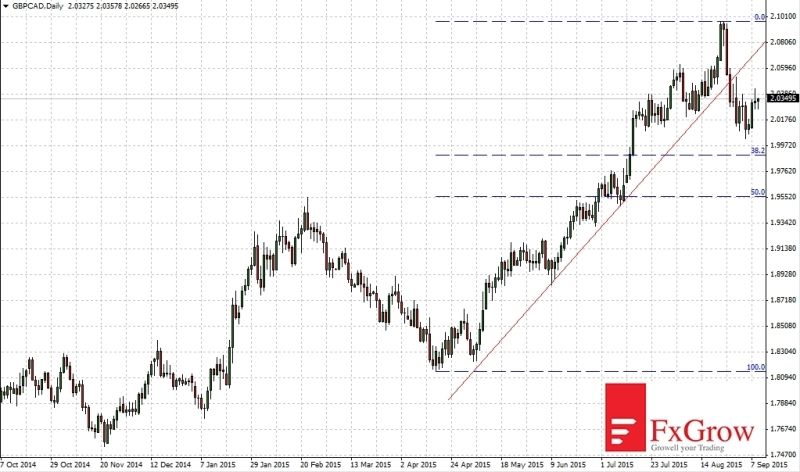
GBPCAD waiting for test of fibo 50%
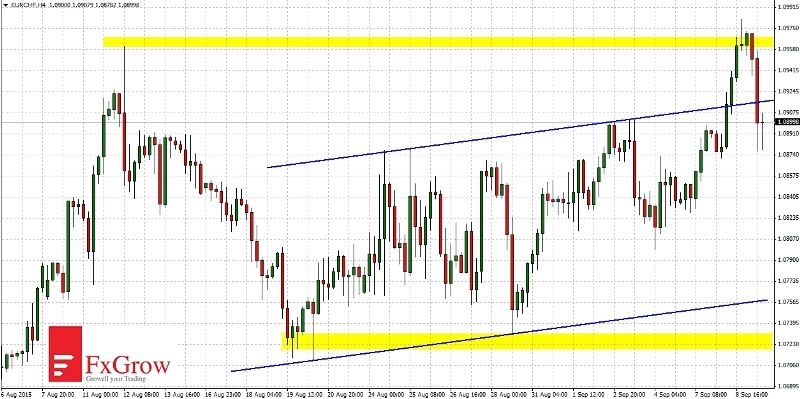
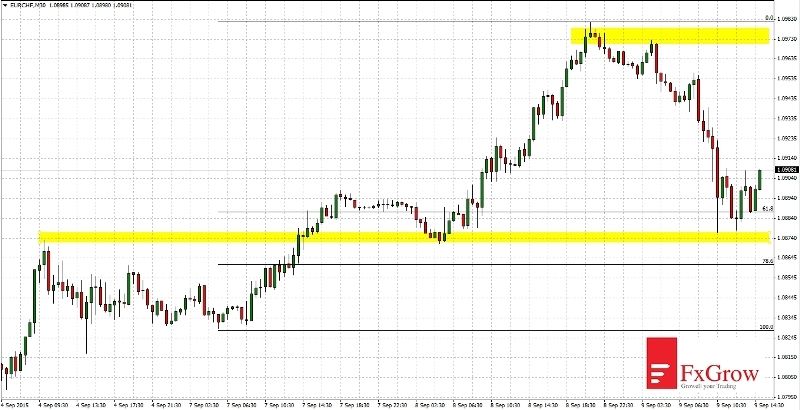
GBPCAD moves in an upward trend since 2013. Last two weeks were correction declines. Declines are very flat and even failed to reach fibo 50% of the last upward movement. This forces the behavior of skepticism about the further fast move up. Especially that GBPCAD reached levels which for many years make an important support or resistance. There are no signs of reversal the upward trend, but a correction or side movement at the moment are very likely. Fibo level of 50% 1.9550 may be tested in the near future. Today we can observe the dynamic movement due to the decision of the Bank of Canada on interest rates.
Time-frame H4
The nearest resistance WHERE price is already moving is at 2.0590. Support is at 2.0100. It is possibile that the price will test resistance and rebound to the support.
For more in depth Research & Analysis please visit FxGrow.
Note: This analysis is intended to provide general information and does not constitute the provision of INVESTMENT ADVICE. Investors should, before acting on this information, consider the appropriateness of this information having regard to their personal objectives, financial situation or needs. We recommend investors obtain investment advice specific to their situation before making any financial investment decision.
By FxGrow Research & Analysis Team
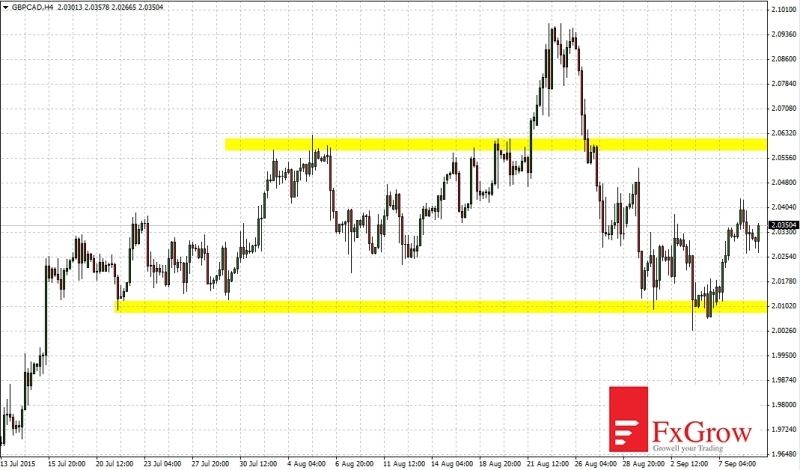
GBPCAD waiting for test of fibo 50%
GBPCAD moves in an upward trend since 2013. Last two weeks were correction declines. Declines are very flat and even failed to reach fibo 50% of the last upward movement. This forces the behavior of skepticism about the further fast move up. Especially that GBPCAD reached levels which for many years make an important support or resistance. There are no signs of reversal the upward trend, but a correction or side movement at the moment are very likely. Fibo level of 50% 1.9550 may be tested in the near future. Today we can observe the dynamic movement due to the decision of the Bank of Canada on interest rates.
Time-frame H4
The nearest resistance WHERE price is already moving is at 2.0590. Support is at 2.0100. It is possibile that the price will test resistance and rebound to the support.
For more in depth Research & Analysis please visit FxGrow.
Note: This analysis is intended to provide general information and does not constitute the provision of INVESTMENT ADVICE. Investors should, before acting on this information, consider the appropriateness of this information having regard to their personal objectives, financial situation or needs. We recommend investors obtain investment advice specific to their situation before making any financial investment decision.