Gold Price and Crude Oil Price Could Gain Bullish Momentum

Gold price started a recovery wave from the $1,615 level. Crude oil price could gain bullish momentum if it clears the $82.50 resistance zone.
Important Takeaways for Gold and Oil
Gold Price Technical Analysis
Gold price declined heavily below the $1,700 level against the US Dollar. The price gained bearish momentum and declined below the $1,680 level.
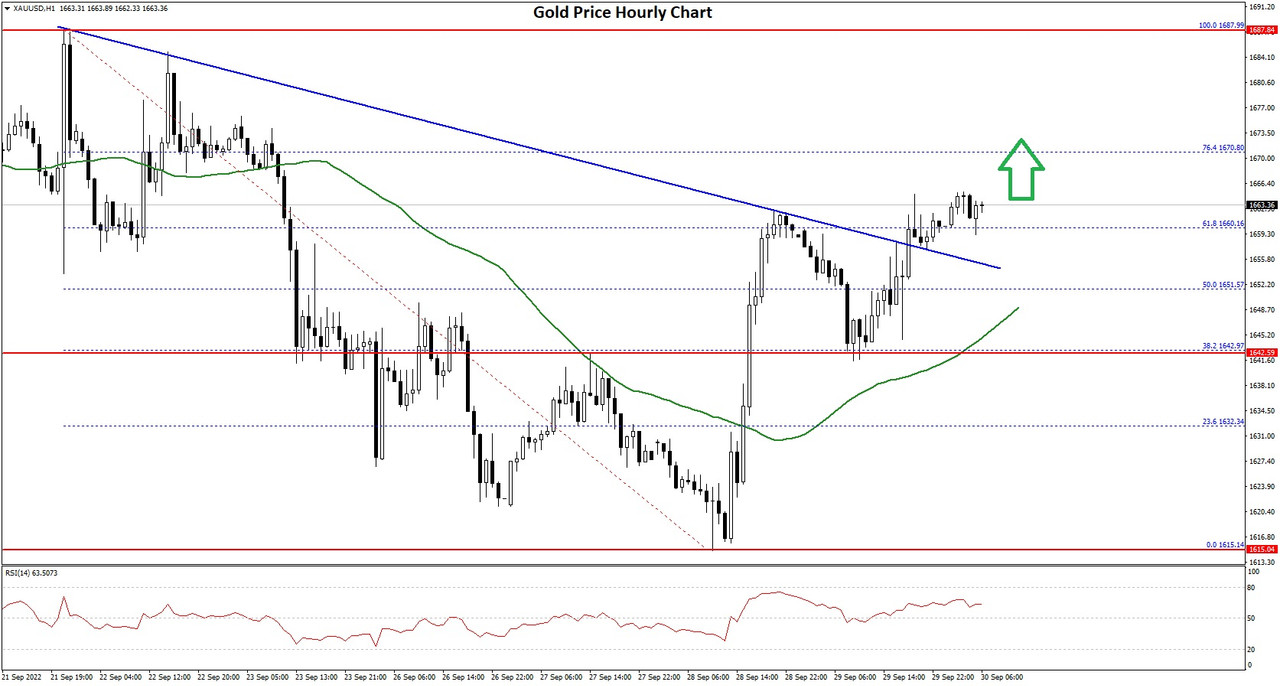
There was a clear move below the $1,650 support zone and the 50 hourly simple moving average. The price traded as low as $1,615 and recently there was a recovery wave. The price was able to clear the $1,625 resistance zone.
There was a move above the 50% Fib retracement level of the downward move from the $1,687 swing high to $1,615 low. There was also a break above a key bearish trend line with resistance near $1,658 on the hourly chart of gold.
The price of XAU/USD is now trading above the 61.8% Fib retracement level of the downward move from the $1,687 swing high to $1,615 low.
On the upside, the price is facing resistance near the $1,670 level. The first major resistance is near the $1,680 level. The main resistance is now forming near the $1,688 level, above which it could even test $1,700.
A clear upside break above the $1,700 resistance could send the price towards $1,720. An immediate support on the downside is near the $1,655 level. The next major support is near the $1,650 level, below which there is a risk of a larger decline. In the stated case, the price could decline sharply towards the $1,620 support zone.
VIEW FULL ANALYSIS VISIT - FXOpen Blog...
Disclaimer: CFDs are complex instruments and come with a high risk of losing your money.
Gold price started a recovery wave from the $1,615 level. Crude oil price could gain bullish momentum if it clears the $82.50 resistance zone.
Important Takeaways for Gold and Oil
- Gold price found support near $1,615 and started a recovery wave against the US Dollar.
- There was a break above a key bearish trend line with resistance near $1,658 on the hourly chart of gold.
- Crude oil price also started a recovery wave from the $76.00 zone.
- There is a major bearish trend line forming with resistance near $81.75 on the hourly chart of XTI/USD.
Gold Price Technical Analysis
Gold price declined heavily below the $1,700 level against the US Dollar. The price gained bearish momentum and declined below the $1,680 level.
There was a clear move below the $1,650 support zone and the 50 hourly simple moving average. The price traded as low as $1,615 and recently there was a recovery wave. The price was able to clear the $1,625 resistance zone.
There was a move above the 50% Fib retracement level of the downward move from the $1,687 swing high to $1,615 low. There was also a break above a key bearish trend line with resistance near $1,658 on the hourly chart of gold.
The price of XAU/USD is now trading above the 61.8% Fib retracement level of the downward move from the $1,687 swing high to $1,615 low.
On the upside, the price is facing resistance near the $1,670 level. The first major resistance is near the $1,680 level. The main resistance is now forming near the $1,688 level, above which it could even test $1,700.
A clear upside break above the $1,700 resistance could send the price towards $1,720. An immediate support on the downside is near the $1,655 level. The next major support is near the $1,650 level, below which there is a risk of a larger decline. In the stated case, the price could decline sharply towards the $1,620 support zone.
VIEW FULL ANALYSIS VISIT - FXOpen Blog...
Disclaimer: CFDs are complex instruments and come with a high risk of losing your money.