• The Forex, Binary Options Forum - welcomes you to our Community!

    DigitalCashPalace Forum is dedicated to discussions about Forex, Binary Options, commodities, stocks related.

    Please take a look around, and feel free to .

Forex Technical Analysis by FXOpen

Watch FXOpen's September 5 - 9 Weekly Digest Video

In this video, FXOpen UK COO Gary Thomson sums up the week’s happenings and discusses the most significant news reports.

  • British Pound at 20 year low as new Prime Minister takes office
  • New extreme for the yen
  • Has Apple's presentation affected the stock price?
  • Stark reality of China's lockdowns: Oil and FTSE 100 down

Watch our short and informative video, and stay updated with FXOpen.


FXOpen YouTube
 
GBP/USD Recovers, EUR/GBP Eyes More Upsides
gbp.jpg


GBP/USD started a fresh increase above the 1.1550 zone. EUR/GBP is rising and might climb further higher above the 0.8700 resistance.

Important Takeaways for GBP/USD and EUR/GBP

  • The British Pound started a fresh recovery wave above the 1.1550 resistance zone against the US Dollar.
  • There is a key bullish trend line forming with support near 1.1585 on the hourly chart of GBP/USD.
  • EUR/GBP climbed higher above the 0.8620 and 0.8650 resistance levels.
  • There is a major bullish trend line forming with support near 0.8665 on the hourly chart.

GBP/USD Technical Analysis

The British Pound found support near the 1.1420 zone against the US Dollar. The GBP/USD pair started a recovery wave and was able to clear the 1.1500 resistance zone.

There was a decent increase above the 1.1550 level and the 50 hourly simple moving average. The pair even climbed above the 1.1600 level. A high was formed near 1.1641 on FXOpen and the pair is now correcting gains.

GBP/USD Hourly Chart
gbpx.jpg


There was a move below the 1.1620 level. The pair declined below the 23.6% Fib retracement level of the upward move from the 1.1550 swing low to 1.1641 high.

On the downside, an initial support is near the 1.1600 level. It is near the 50% Fib retracement level of the upward move from the 1.1550 swing low to 1.1641 high. There is also a key bullish trend line forming with support near 1.1585 on the hourly chart of GBP/USD.

The next major support is near the 1.1550 level. Any more losses could lead the pair towards the 1.1500 support zone or even 1.1420.

On the upside, an initial resistance is near the 1.1640 level. The next main resistance is near the 1.1650 zone. A clear upside break above the 1.1640 and 1.1650 resistance levels could open the doors for a steady increase in the near term. The next major resistance sits near the 1.1715 level.

VIEW FULL ANALYSIS VISIT - FXOpen Blog...
 
BTCUSD and XRPUSD Technical Analysis – 13th SEP 2022
btc.jpg


BTCUSD: Inverted Hammer Pattern Above $19025

Bitcoin was unable to sustain its bearish momentum and after touching a low of 18567 on 07th Sep, it started to correct upwards crossing the $22000 handle today in the European trading session.

The price of Bitcoin continues to correct upwards due to the increased buying pressure and more upsides are expected towards the $25000 levels.

We can see a bullish price crossover with the adaptive moving average AMA50 in the 15-minute time frame.

We have also seen a bullish opening gap underpinning the markets this week.

We can clearly see an inverted hammer pattern above the $19025 handle which is a bullish reversal pattern because it signifies the end of a downtrend and a shift towards an uptrend.

Bitcoin touched an intraday low of 22067 in the Asian trading session and an intraday high of 22553 in the European trading session today.

Both the STOCH and Williams percent range are indicating overbought levels which means that in the immediate short term a decline in the prices is expected.

The relative strength index is at 71 indicating a very strong demand for bitcoin at the current market levels and the continuation of the buying pressure in the markets.

Bitcoin is now moving above its 100 hourly simple moving average and below its 200 hourly exponential moving averages.

All of the major technical Indicators are giving a STRONG BUY signal, which means that in the immediate short term we are expecting targets of 24000 and 25000.

The average true range is indicating LESS market volatility with a strong bullish momentum.

  • Bitcoin: bullish reversal seen above $19025.
  • STOCHRSI is indicating an oversold level.
  • The price is now trading just above its pivot level of $22332.
  • All of the moving averages are giving a STRONG BUY market signal.

Bitcoin: Bullish reversal seen above $19025
btcx.png


The price of bitcoin is forming an ascending channel, with the current price action indicating a move towards the consolidation phase above the $22000 handle.

We can see the formation of a bullish harami pattern in the 2-hourly time-frame indicating the underlying bullish nature of the markets.

We have also detected the formation of a bullish engulfing line in the 1-hourly time frame indicating the bullish scenario.

The immediate short-term outlook for bitcoin is bullish, the medium-term outlook has turned neutral, and the long-term outlook remains neutral under present market conditions.

Bitcoin’s support zone is located at $21000 and the price continues to remain above these levels for the continuation of the bullish reversal in the markets.

The price of BTCUSD is now facing its classic resistance level of 22502 and Fibonacci resistance level of 22731 after which the path towards 23000 will get cleared.

In the last 24hrs BTCUSD has increased by 0.95% by 211$ and has a 24hr trading volume of USD 43.846 billion. We can see a decrease of 2.98% in the trading volume as compared to yesterday, which appears to be normal.

The Week Ahead

The price of bitcoin is moving in a consolidation zone above the $22000 levels. At present the price is moving into a narrow range between the 22000 and 22500 levels.

We can see that the price of bitcoin is super bullish and we are heading towards the $30000 handle in the medium term range.

The daily RSI is printing at 61 which indicates a very strong demand from the long-term investors.

The price of BTCUSD will need to remain above the important support levels of $21000 this week.

The weekly outlook is projected at $25000 with a consolidation zone of $24500.

Technical Indicators:

The moving averages convergence divergence (12, 26): is at 564.30 indicating a BUY.

The ultimate oscillator: is at 57.64 indicating a BUY.

The rate of price change: is at 5.34 indicating a BUY.

The commodity channel index (14): is at 105.75 indicating a BUY.

VIEW FULL ANALYSIS VISIT - FXOpen Blog...
 
EUR/USD Trims Gains, USD/JPY Aims New High
eur.jpg


EUR/USD started another decline from the 1.0200 resistance. USD/JPY is rising and might soon clear the key 145.00 resistance zone.

Important Takeaways for EUR/USD and USD/JPY

  • The Euro started a fresh decline and even traded below the 1.0020 support.
  • There was a break below a major bullish trend line with support near 1.0140 on the hourly chart of EUR/USD.
  • USD/JPY started a fresh increase after it remained well bid above the 141.50 support.
  • There is a key bullish trend line forming with support near 142.30 on the hourly chart.

EUR/USD Technical Analysis

This past week, the Euro was able to recover above the 1.0100 level against the US Dollar. The EUR/USD pair even broke the 1.0150 level, but the bears were active near the 1.0200 zone.

A high was formed near 1.0197 on FXOpen and the pair started a fresh decline. There was a clear move below the 1.0150 and 1.0120 support levels. The pair declined below the 50% Fib retracement level of the upward move from the 0.9864 swing low to 1.0197 high.

EUR/USD Hourly Chart
eurx.jpg


Besides, there was a break below a major bullish trend line with support near 1.0140 on the hourly chart of EUR/USD. The pair is now trading below the 1.0050 level and the 50 hourly simple moving average.

An immediate resistance on the upside is near the 1.0000 level. The next major resistance is near the 1.0030 level. An upside break above 1.0030 could set the pace for a steady increase. In the stated case, the pair might revisit 1.0080.

Any more gains might send the pair towards 1.0120. If not, the pair might drop and test the 0.9950 support. The next major support is near 0.9920, below which the pair could drop to 0.9860 in the near term.

VIEW FULL ANALYSIS VISIT - FXOpen Blog...
 
What's going on with the stock markets? It's all sudden panic!
stock-markets-1.jpg


Yesterday, it became clear that some of the world's most seasoned analysts and investment managers had begun to look at the US stock markets with trepidation.

Indeed, one particular long-established investment manager, Jeremy Grantham of GMO fame, stated on Monday that he envisages the S&P500 index to collapse by 26% by the end of the year, citing junk bonds and unstable NASDAQ tech stocks as possible reasons.

Well, today the nervousness is all out in the open and other very well recognized commentators are following suit.

Morgan Stanley stated during the late hours of the European evening yesterday that they expect the S&P500 to plunge by a further 17 to 17% in the next four months.

This is a sudden depiction of low confidence in company stocks listed on American exchanges, and it has sent waves through the entire global financial markets to the extent that everyone from bank executives to cryptocurrency HODLers are talking about a potential stock market crash.

Even in Australia, the ASX exchange, based in Sydney, experienced a total wipeout of over $72 billion in the value of its listed stocks yesterday, as commentator Scott Pape stated that the country is 'well overdue' for a major stock crash.

The last time a stock market collapse occurred at the same time as poor credit conditions was during the global banking crisis in 2008, and whilst there certainly are poor indicators this time, the 2008 financial crisis was purely bank related. The rest of the economy of the West was fully operational and could work to pull things back.

Now, however, Australia has been subjected to two years of draconian lockdowns, almost making it an isolated island. This impacted important trade with its key partners in the Asia Pacific region, all of which continued their business unhindered and became ever stronger.

The United States economy has been somewhat overlooked recently, largely because the US Dollar has been holding itself up well against other Western majors, all of which have been tanking, especially the British Pound, and although inflation is high in the United States, it is lower than it is in Europe and the United Kingdom.

Therefore, the weaknesses in corporate stock have been perhaps overlooked and now the doom-mongers are moving in.

the Australian Securities Exchange plunged by 2.75 per cent in the opening minutes this morning, wiping out $66billion, after another high inflation reading in the US sparked fears of a giant interest rate rise in the world's biggest economy.

As the winter draws closer, and the potential cost of domestic energy is on the minds of the American and European public, conservatism and looking to cover existing expenses rather than invest in new ones is a priority for many.

A bear market it certainly is.

VIEW FULL ANALYSIS VISIT - FXOpen Blog...

Disclaimer: CFDs are complex instruments and come with a high risk of losing your money.
 
ETHUSD and LTCUSD Technical Analysis – 15th SEP, 2022
eth.jpg


ETHUSD: Hammer Pattern Above $1551

Ethereum was unable to sustain its bullish momentum and after touching a high of 1788 on 11th Sep the price started to decline against the US dollar. This decline was mainly attributed to the strength of the US dollar in the global markets and the subsequent increase in the market liquidity.

We can see a continued buying pressure since yesterday and the formation of a bullish price crossover pattern with moving averages MA20, MA50 and MA100 in the 15-minute time frame.

We can clearly see a hammer pattern above the $1551 handle which is a bullish pattern and signifies the end of a bearish phase and the start of a bullish phase in the markets.

ETH is now trading just above its pivot level of 1599 and moving in a strong bullish channel. The price of ETHUSD is now testing its classic resistance level of 1625 and Fibonacci resistance level of 1651 after which the path towards 1700 will get cleared.

The relative strength index is at 56 indicating a STRONGER demand for Ether and the continuation of the uptrend in the markets.

We can see that the super trend indicator is giving a bullish reversal signal in the 15-minute time frame.

We have also detected a bullish harami cross pattern in the 1 -hour time frame.

The STOCHRSI is indicating an OVERBOUGHT market, which means that the prices are expected to decline in the short-term range.

Most of the technical indicators are giving a STRONG BUY market signal.

Most of the moving averages are giving a BUY signal and we are now looking at the levels of $1750 to $1900 in the short-term range.

ETH is now trading below both the 100 & 200 hourly simple and exponential moving averages.

  • Ether: bullish reversal seen above the $1551 mark
  • Short-term range appears to be strongly BULLISH
  • ETH continues to remain above the $1600 level
  • The average true range is indicating HIGH market volatility

Ether: Bullish Reversal Seen Above $1551
etx.png


ETHUSD is now moving into a strongly bullish channel with the prices trading above the $1600 handle in the European trading session today.

ETH touched an intraday low of 1571 and an intraday high of 1651 in the European trading session today.

We have seen a bullish opening of the markets today indicating the underlying bullish nature of the markets.

We can see that MACD has crossed UP its moving average in the 4-hour time frame indicating the bullish tone, and now we are looking at the levels of 1800 to 2000 in the medium-term range.

The daily RSI is printing at 48 indicating a neutral demand in the long-term range.

The key support levels to watch are $1566 and $1501 and the prices of ETHUSD need to remain above these levels for the continuation of the bullish reversal in the markets.

ETH has increased by 1.40% with a price change of 22.33$ in the past 24hrs and has a trading volume of 24.474 billion USD.

We can see an increase of 5.50% in the total trading volume in the last 24 hrs which appears to be normal.

The Week Ahead

On the upside, the next visible targets are 1752 which is a 38.2% retracement from 4 week low, and 1690 which is a 50% retracement from 4 week high/low.

The prices of Ethereum are now testing its immediate resistance zone located at $1700 and we are likely to witness a rally in the prices once it touches these levels.

The immediate short-term outlook for Ether has turned strongly BULLISH, the medium-term outlook has turned NEUTRAL, and the long-term outlook for Ether is NEUTRAL in present market conditions.

The price of ETHUSD will need to remain above the important support level of $1500 this week.

The weekly outlook is projected at $1900 with a consolidation zone of $1700.

Technical Indicators:

The average directional change (14): is at 24.06 indicating a BUY

The moving averages convergence divergence (12,26): is at 0.48 indicating a BUY

The rate of price change: is at 2.61 indicating a BUY

The ultimate oscillator: is at 62.47 indicating a BUY

VIEW FULL ANALYSIS VISIT - FXOpen Blog...

Disclaimer: CFDs are complex instruments and come with a high risk of losing your money.
 
GBP/USD Turns Red While USD/CAD Aims Higher
gbp.jpg


GBP/USD is trading in a bearish zone below the 1.1480 and 1.1440 support levels. USD/CAD is surging and could continue to rise above the 1.3300 resistance zone.

Important Takeaways for GBP/USD and USD/CAD

  • The British Pound started a major decline below the 1.1550 support zone.
  • There is a key bearish trend line forming with resistance near 1.1415 on the hourly chart of GBP/USD.
  • USD/CAD started a fresh increase above the 1.3200 resistance zone.
  • There is a connecting bullish trend line forming with support near 1.3220 on the hourly chart.

GBP/USD Technical Analysis

After a strong rejection near 1.1740, the British Pound started a fresh decline against the US Dollar. GBP/USD declined heavily below the 1.1550 support zone.

There was a move below the 1.1500 support zone and the 50 hourly simple moving average. The pair even traded below the 1.1480 support zone and formed a low near 1.1350 on FXOpen. It is now consolidating losses above the 1.1350 level.

GBP/USD Hourly Chart
gbpx.jpg


An immediate resistance is near the 1.1415 level. There is also a key bearish trend line forming with resistance near 1.1415 on the hourly chart of GBP/USD. The next resistance is near the 1.1440 level or the 38.2% Fib retracement level of the downward move from the 1.1589 swing high to 1.1350 low.

The main resistance is near the 1.1480 level. It is near the 50% Fib retracement level of the downward move from the 1.1589 swing high to 1.1350 low.

If there is an upside break above the 1.1480 zone, the pair could rise towards 1.1550. The next key resistance could be 1.1580, above which the pair could gain strength.

On the downside, an initial support is near the 1.1380 area. The first major support is near the 1.1350 level. If there is a break below 1.1350, the pair could extend its decline. The next key support is near the 1.1300 level. Any more losses might call for a test of the 1.1240 support.

VIEW FULL ANALYSIS VISIT - FXOpen Blog...

Disclaimer: CFDs are complex instruments and come with a high risk of losing your money.
 
British Pound hits 37-year low against US Dollar
gbp.jpg


Just as we all thought a 20-year low point for the British Pound was a staggering end to a continual downward spiral for the world's most valuable currency, another leap toward the bottom took place.

The British Pound finished the trading week on Friday at an astonishing 37-year low.

That is a trip back to the dark days of the fierce industrial action by rampant workers unions of the early 1980s and the nationalization of many large companies such as British Leyland, the closures of the coal mines and inflation at over 18%.

As a result of some very drastic action by the government at the time, the economy was brought back into good order but it was a very difficult job for the working public, for businesses and for the government itself.

Today, the causes and circumstances are different, but the effect is the same. A catastrophically declining national economy and a volatile Pound which would have been unheard of for two decades until this year.

Retail sales figures in Britain which were released early in the Friday trading session on the London market underscored a high street in trouble. Retail sales volumes fell by 1.6% in August, continuing a downward trend since summer 2021 according to the Office for National Statistics, demonstrating that the public are cash-strapped and are perhaps prioritizing their main household bills rather than shopping for new consumer products.

With news channels full of anticipation of expensive winter energy bills and a potential 18% inflation figure by January, a conservative approach is being taken by a large portion of the population.

The Bank of England, which is the Central Bank of the United Kingdom, last week made an announcement relating to its decision relating to potential interest rate rises one day before an emergency mini-budget was delivered by newly appointed Chancellor of the Exchequer Kwasi Kwarteng.

UK inflation stands at 9.9% currently, and has been predicted to rise to 18% by Citi by January during a prediction last month in which the same analysts at Citi suggested that the interest rate may rise from the 1.75% it stands at currently to a sudden 7% by January.

Some pundits have stated that inflation in the United Kingdom may go over 20%, and this analysis was not coming from sensationalists, rather from the analytical think tanks within some investment bank.

It is now being suggested by commentators that inflation may begin to drop if the British government lives up to its promise of capping consumer energy costs for the next two years, although energy costs continue to spiral whereas in France, they have been capped some months ago.

The BoE may rein in any thoughts of a 75 basis point rate hike if they believe/know that the chancellor will effectively cool price pressures the next day. This may leave GBP/USD vulnerable to a further sell-off, especially if the US Federal Reserve hikes by a minimum of 75 basis points on Wednesday last week.

What a bleak outlook for the Pound, and the wider British economy!

VIEW FULL ANALYSIS VISIT - FXOpen Blog...

Disclaimer: CFDs are complex instruments and come with a high risk of losing your money.
 
US Stock market complacency on the bankers' radar
stock-markets-2.jpg


At the end of last week, we all witnessed a spectacular collapse in the value of some of the most prestigious indices on New York's exchanges, much to the surprise of those who had been looking at the relative strength of the United States economy compared to the flagging counterparts on the European side of the Atlantic.

Just as minds were concentrating on the strength of the US Dollar against the plummeting British Pound, a false sense of security had become evident, and the US was being held up as a shining example; the West's only productive economy in today's climate of rampant inflation, low productivity and massive national debt.

As stock markets crashed last week, analysts at investment banks made grave predictions that the S&P500 could fall another 22% this year.

During the later part of the US trading session yesterday, the Chief Investment Officer at investment bank Morgan Stanley stated that complacency is abound among stock market investors at a time at which interest rates are on the increase.

Morgan Stanley's Lisa Shallett told MarketWatch yesterday evening “The real 10-year Treasury yield, at 1%, approaches a four-year high. Consider that back in June, when the real rate was at this level, the S&P 500 Index was at 3,667, 5.3% lower than it is now.”

Equally, Morgan Stanley has been the bearer of another grave statistic: there has been a considerable downturn in technology company IPOs due to the gloomy market conditions.

Tomorrow will mark 238 days without a technology company IPO worth more than $50 million on the American markets, surpassing the previous records set in the aftermath of the 2008 financial crisis and the early 2000s dotcom crash.

Some proposed fintech IPOs have been withdrawn, with one insider having said "Who would go public in this market?".

The tech-dominated Nasdaq Composite has fallen nearly 28% this year compared with a drop of just over 19% in the S&P 500 and the aforementioned predictions that a further even larger amount could fall from the value of the S&P500 before the year is out.

There are genuine fears of a looming recession across all Western markets. The pound is at a 37 year low against the US Dollar and Britain's economy is flagging, whereas despite a strong US Dollar and productive American economy, the inflation and interest rate rises have been a key catalyst in collapsing the value of company equities listed on top New York exchanges.

The volatility is there, but has to be navigated carefully!

VIEW FULL ANALYSIS VISIT - FXOpen Blog...

Disclaimer: CFDs are complex instruments and come with a high risk of losing your money.
 
BTCUSD and XRPUSD Technical Analysis – 20th SEP 2022
btc.jpg


BTCUSD: Bullish Engulfing Pattern Above $18293

Bitcoin was unable to sustain its bearish momentum and after touching a low of 18322 on 19th Sep, it has entered into a consolidation channel above the $19000 handle today in the European trading session.

The price of bitcoin continues to move in a tight range between 19200 and 19700 levels today suggesting that we have hit the bottom of the downtrend.

We can see the formation of an ascending channel pattern on the hourly chart of the BTCUSD.

The price of bitcoin is nearing the horizontal support level in the daily time frame indicating the bullish tone in the markets.

We can clearly see a bullish engulfing pattern above the $18293 handle which is a bullish reversal pattern because it signifies the end of a downtrend and a shift towards an uptrend.

Bitcoin touched an intraday high of 19679 in the Asian trading session and an intraday low of 19195 in the European trading session today.

Both the STOCH and Williams percent range are indicating overbought levels which means that in the immediate short term a decline in the prices is expected.

The relative strength index is at 53 indicating a NEUTRAL demand for bitcoin at the current market levels and the continuation of the buying pressure in the markets.

Bitcoin is now moving below its 100 hourly simple moving average and below its 200 hourly exponential moving averages.

Some of the major technical indicators are giving a BUY signal, which means that in the immediate short term, we are expecting targets of 20000 and 21500.

The average true range is indicating LESS market volatility with a mild bullish momentum.

  • Bitcoin: bullish reversal seen above $18293
  • The commodity channel index is indicating a neutral level
  • The price is now trading just above its pivot level of $19399
  • Some of the moving averages are giving a BUY market signal

Bitcoin: Bullish Reversal Seen Above $18293
btcx.png


The price of bitcoin has crashed below the important support level of $19000 due to the strength of the US dollar and the increase in the global market liquidity pattern.

The adaptive moving average AMA50 and moving average MA20 is giving a bullish trend reversal signal in the 15-minutes time frame.

We can see that the momentum indicator is giving a bullish trend signal in the weekly time frame.

We have also detected a bullish opening of the markets indicating the underlying bullish sentiment.

The immediate short-term outlook for bitcoin is bullish, the medium-term outlook has turned neutral, and the long-term outlook remains neutral under present market conditions.

Bitcoin’s support zone is located at $18000 and the prices continue to remain above these levels for the continuation of the bullish reversal in the markets.

The price of BTCUSD is now facing its сlassic resistance level of 19544 and Fibonacci resistance level of 19722 after which the path towards 20000 will get cleared.

In the last 24hrs BTCUSD has increased by 4.77% by 881$ and has a 24hr trading volume of USD 36.188 billion. We can see an increase of 6.47% in the trading volume compared to yesterday, which appears to be normal.

The Week Ahead

The price of bitcoin is moving in a consolidation zone above the $19000 level. At present the price of bitcoin is gaining a bullish traction against the US dollar in the medium-term range.

We can see the buildup of positive momentum in the markets with the prices moving close to the psychological support level of $20000.

The daily RSI is printing at 40 which indicates a weak demand from the long-term investors.

The price of BTCUSD will need to remain above the important support level of $18500 this week.

The weekly outlook is projected at $21000 with a consolidation zone of $20000.

Technical Indicators:

The moving averages convergence divergence (12,26): is at 5.20 indicating a BUY

The ultimate oscillator: is at 51.34 indicating a BUY

The rate of price change: is at 0.70 indicating a BUY

The average directional change (14): is at 28.61 indicating a BUY

VIEW FULL ANALYSIS VISIT - FXOpen Blog...

Disclaimer: CFDs are complex instruments and come with a high risk of losing your money.
 
EUR/USD Remains At Risk, USD/CHF Could Increase Further
eur.jpg


EUR/USD is struggling to stay above the 0.9950 support zone. USD/CHF is rising and might climb higher towards the 0.9750 resistance zone.

Important Takeaways for EUR/USD and USD/CHF

  • The Euro is struggling to recover and trading below the parity level against the US Dollar.
  • There was a break below a key bullish trend line with support at 0.9990 on the hourly chart of EUR/USD.
  • USD/CHF started a fresh increase after it cleared the 0.9600 resistance zone.
  • There is a major bullish trend line forming with support near 0.9640 on the hourly chart.

EUR/USD Technical Analysis

This past week, the Euro saw a major decline below the 1.0040 support against the US Dollar. The EUR/USD pair declined below the 1.0000 support level to move further into a bearish zone.

The pair formed a base above the 0.9950 level and recently started an upside correction. There was a move above the 0.9980 and 1.0000 resistance levels. The pair climbed above the 1.0020 level and the 50 hourly simple moving average.

EUR/USD Hourly Chart
eurx.jpg


However, the bears were active near the 1.0050 level. As a result, there was a fresh decline below the 1.0000 support. There was a break below a key bullish trend line with support at 0.9990 on the hourly chart of EUR/USD.

The pair traded as low as 0.9955 and is currently consolidating losses. An immediate resistance is near the 0.9980 level. It is near the 23.6% Fib retracement level of the downward move from the 1.0050 swing high to 0.9955 low.

The next major resistance is near the 1.0030 level. It is near the 50% Fib retracement level of the downward move from the 1.0050 swing high to 0.9955 low.

A clear move above the 1.0030 resistance zone could set the pace for a larger increase towards 1.0080. The next major resistance is near the 1.0120 zone.

On the downside, an immediate support is near the 0.9955 level. The next major support is near the 0.9920 level. A downside break below the 0.9920 support could start another decline.

VIEW FULL ANALYSIS VISIT - FXOpen Blog...

Disclaimer: CFDs are complex instruments and come with a high risk of losing your money.
 
After a long period of hardship, the Japanese Yen is back on track
yen.jpg


Japan's beleaguered economy has been kept relatively quiet on the global news scene over the past two years, but domestically, it has been at the forefront of everyone's minds for a long time now.

Japan's business-focused, ultra-conservative modus operandi was applauded by many during 2020 and 2021, as the country did not lock its population down and remained well and truly open for business at a time when many other nations did lock their population down.

Given that the country continues to demonstrate high quality industrial prowess in many manufacturing sectors, and that it has had a continuity of business at a time when other nations had theirs disrupted by their own governments, it would be an easy conclusion to draw that Japan is doing well.

Things are never quite that simple.

Japan has kept itself firmly out of the global political trends, and has focused on its own issues, another policy that would perhaps be very laudable under normal circumstances, however unfortunately the country's economy has been in dire straits for some time

During the course of this year until last week, the nation's currency, the Japanese Yen, had plunged in value by a remarkable 24% and competition from neighboring South East Asian nations in the field of electronics and precision engineering have been impacting the position of Japan as a top tier economy.

This week, however, there was a slight change in fortunes for the Japanese sovereign currency.

At the end of the US trading session yesterday, the Yen hit 144 against the US Dollar, which is a six-day high.

It also spiked against the British Pound, before relapsing to a low at the end of the British session.

Reuters conducted a poll which sought the opinion of 23 economists, 12 of which stated yesterday that their opinion is that the Japanese government would not buy up the yen in order to stop the currency from weakening further. However, 5 respondents did note that if USD/JPY were to hit 150, then it would prompt intervention by Japanese officials.

Perhaps the speculation that interest rates will likely not be increased gave the Yen a quick boost in confidence, given that increasing rates has been a major policy in the United States and Great Britain throughout 2022, with some pundits thinking that interest rates may rise to 7% by January in the United Kingdom from their current 1.75% rate.

The reality is that banks are looking to increase interest rates to around 5% for mortgages, which is still a jump from the existing rates available in the United Kingdom, and the Pound has taken a bashing over serious concerns that the economy is in big trouble.

It's a volatile period for the Yen, and this blip is a case in point.

VIEW FULL ANALYSIS VISIT - FXOpen Blog...

Disclaimer: CFDs are complex instruments and come with a high risk of losing your money.
 
ETHUSD and LTCUSD Technical Analysis – 22nd SEP, 2022
eth.jpg


ETHUSD: Hammer Pattern Above $1220

Ethereum was unable to sustain its bullish momentum and after touching a high of 1393 on 21st Sep the prices started to decline against the US dollar. The prices of Ethereum touched a low of 1220 on 22nd Sep after which we can see a bounce upwards.

We can see a continued buying pressure today and we can see the formation of a bullish harami cross pattern in the 15-minutes time frame.

We can clearly see a hammer pattern above the $1220 handle which is a bullish pattern and signifies the end of a bearish phase and the start of a bullish phase in the markets.

ETH is now trading just above its pivot level of 1288 and is moving into a strong bullish channel. The price of ETHUSD is now testing its classic resistance level of 1298 and Fibonacci resistance level of 1308 after which the path towards 1400 will get cleared.

The relative strength index is at 47 indicating a NEUTRAL demand for Ether and a shift towards a consolidation phase in the markets.

We can see that the adaptive moving average AMA50 and MA50 both are giving a bullish trend reversal signal in the markets.

The STOCHRSI is indicating an OVERBOUGHT market, which means that the prices are expected to decline in the short-term range.

Most of the technical indicators are giving a STRONG BUY market signal.

Some of the moving averages are giving a BUY signal and we are now looking at the levels of $1400 to $1500 in the short-term range.

ETH is now trading below both the 100 & 200 hourly simple and exponential moving averages.

  • Ether: bullish reversal seen above the $1220 mark
  • Short-term range appears to be mildly BULLISH
  • ETH continues to remain above the $1200 level
  • The average true range is indicating LESS market volatility

Ether: Bullish Reversal Seen Above $1220
etx.png


ETHUSD is now moving into a mildly bullish channel with the prices trading above the $1250 handle in the European trading session today.

ETH touched an intraday low of 1220 in the Asian trading session and an intraday high of 1297 in the European trading session today.

We have seen that the prices are near support of the channel indicating a bullish scenario.

The moving average MA100 is also indicating the bullish tone in the daily timeframe and now we are looking at the levels of 1500 to 1600 in the medium-term range.

The daily RSI is printing at 35 indicating a neutral demand in the long-term range.

The key support levels to watch are $1200 and $1258, and the prices of ETHUSD need to remain above these levels for the continuation of the bullish reversal in the markets.

ETH has decreased by 3.54% with a price change of 47.38$ in the past 24hrs and has a trading volume of 22.404 billion USD.

We can see an increase of 61.35% in the total trading volume in the last 24 hrs which is due to the heavy buying seen at lower levels by the medium-term investors.

The Week Ahead

The prices have been ranging into an oversold zone from last week and an upwards correction is expected. We are now looking for a sharp rally into the markets towards the $1600 levels.

The recent fall in the levels of Ethereum is attributed to the Federal Reserve which hiked the key interest rates for the third time this year.

The immediate short-term outlook for Ether has turned mildly BULLISH, the medium-term outlook has turned BULLISH, and the long-term outlook for Ether is NEUTRAL in present market conditions.

The prices of ETHUSD will need to remain above the important support level of $1200 this week.

The weekly outlook is projected at $1500 with a consolidation zone of $1400.

Technical Indicators:

The average directional change (14): is at 16.88 indicating a NEUTRAL level

The Williams percent range: is at -36.05 indicating a BUY

The bull/bear power (13): is at 12.62 indicating a BUY

The ultimate oscillator: is at 52.57 indicating a BUY

VIEW FULL ANALYSIS VISIT - FXOpen Blog...

Disclaimer: CFDs are complex instruments and come with a high risk of losing your money.
 
AUD/USD and NZD/USD Face Key Hurdles, Downtrend Intact
aud.jpg


AUD/USD is facing a strong resistance near the 0.6660 zone. NZD/USD is also struggling to clear the 0.5900 resistance zone.

Important Takeaways for AUD/USD and NZD/USD

  • The Aussie Dollar started a fresh decline from well above the 0.6700 zone against the US Dollar.
  • There is a key bearish trend line forming with resistance near 0.6650 on the hourly chart of AUD/USD.
  • NZD/USD started an upside correction from the 0.5800 support zone.
  • There is a connecting bearish trend line forming with resistance near 0.5850 on the hourly chart of NZD/USD.

AUD/USD Technical Analysis

The Aussie Dollar failed to stay above the 0.6700 level and started a fresh decline against the US Dollar. The AUD/USD pair traded below the 0.6650 support zone to move into a bearish zone.

There was a clear move below the 0.6620 level and the 50 hourly simple moving average. The pair traded as low as 0.6575 on FXOpen and recently started an upside correction. There was a move above the 0.6620 level.

AUD/USD Hourly Chart
audx.jpg


The bulls pushed the pair above the 38.2% Fib retracement level of the downward move from the 0.6747 swing high to 0.6575 swing low.

However, the bears remained active near the 0.6660 zone and the 50 hourly simple moving average. The pair failed to clear the 50% Fib retracement level of the downward move from the 0.6747 swing high to 0.6575 swing low.

There is also a key bearish trend line forming with resistance near 0.6650 on the hourly chart of AUD/USD. On the upside, the AUD/USD pair is facing resistance near the 0.6650 level.

The next major resistance is near the 0.6660 level. A close above the 0.6660 level could start a steady increase in the near term. The next major resistance could be 0.6720.

On the downside, an initial support is near the 0.6600 level. The next support could be the 0.6560 level. If there is a downside break below the 0.6560 support, the pair could extend its decline towards the 0.6500 level.

VIEW FULL ANALYSIS VISIT - FXOpen Blog...

Disclaimer: CFDs are complex instruments and come with a high risk of losing your money.
 
Watch FXOpen's September 19 - 23 Weekly Digest Video

In this video, FXOpen UK COO Gary Thomson sums up the week’s happenings and discusses the most significant news reports.

  • The British pound hits 37-year low against US dollar
  • How mobilization in Russia will affect financial markets
  • US stock market complacency on the bankers' radar
  • After a long period of hardship, the Japanese yen is back on track

Watch our short and informative video, and stay updated with FXOpen.


VIEW FULL NEWS VISIT - FXOpen Company News...

Disclaimer: CFDs are complex instruments and come with a high risk of losing your money.
 
GBP/USD Nosedives and GBP/JPY Gain Bearish Momentum
gbp.jpg


GBP/USD started a major decline and traded below 1.1000. GBP/JPY is also diving and there was a clear move below the 155.00 support.

Important Takeaways for GBP/USD and GBP/JPY

  • The British Pound started a major decline below the 1.1000 support against the US Dollar.
  • There is a connecting bearish trend line forming with resistance near 1.1220 on the hourly chart of GBP/USD.
  • GBP/JPY declined steadily after it failed to clear the 165.00 resistance zone.
  • There is a major bearish trend line forming with resistance near 152.50 on the hourly chart.

GBP/USD Technical Analysis

This past week, the British Pound started a major decline from the 1.1400 zone against the US Dollar. The GBP/USD pair declined below the 1.1200 support to move into a bearish zone.

There was a steady decline below the 1.1100 level and the 50 hourly simple moving average. The pair even traded below the 1.0850 support zone. The pair traded as low as 1.0341 on FXOpen and is currently consolidating losses.

GBP/USD Hourly Chart
gbpx.jpg


An immediate resistance on the upside is near the 1.0580 level. It is near the 23.6% Fib retracement level of the recent decline from the 1.1364 swing high to 1.0341 level.

The next major resistance is near the 1.0850 level. It coincides with the 50% Fib retracement level of the recent decline from the 1.1364 swing high to 1.0341 level, above which the pair could start a steady increase.

There is also a connecting bearish trend line forming with resistance near 1.1220 on the hourly chart of GBP/USD. An upside break above 1.1220 might start a fresh increase towards 1.1350. Any more gains might call for a move towards 1.1450 or even 1.1500.

An immediate support is near the 1.0450. The next major support is near the 1.0350 level. If there is a break below the 1.0350 support, the pair could test the 1.0200 support. Any more losses might send GBP/USD towards 1.0000.

VIEW FULL ANALYSIS VISIT - FXOpen Blog...

Disclaimer: CFDs are complex instruments and come with a high risk of losing your money.
 
Slight opening gain as FTSE 100 wakes up
ftse.jpg


The doom and gloom that has surrounded the British Pound's seemingly endless fall from glory to almost parity with the US Dollar in its lowest point in recorded history has been a major consideration for traders across the world.

A clear indicator of the dire straits that the British economy finds itself in after many years of policy which has blown the coffers to an extent that there are serious concerns about how many people will manage to get through the winter, the Pound still languishes, but the FTSE 100 index has begun to increase just a few ticks this morning.

As the opening bell sounded in London this morning, analysts and traders began their day with a degree of optimism, expecting the London Stock Exchange's index containing its 100 most prestigious publicly listed companies to begin the day a few points higher than yesterday.

This mood was created by the Pound's slight slowdown in its apparent freefall, and news from the British government that the Treasury will hold a full Budget in the spring of 2023 and the Bank of England confirmed that it is keeping watch on markets and would not hesitate to raise rates.

The impending rate rises are a cause for concern, however, as a potential increase from the current rate of around 2.25% to over 5% by January is being speculated upon, and if that happens, it could well cause a serious issue for borrowers and plunge the economy into a recession.

In line with expectations, The FTSE 100 rose over 27 points in the opening session this morning in London, arriving at 7048.65, a gain of 0.4%. It extended a marginal overall rise notched up by the end of the previous session partially as a result of the news from the UK treasury.

Caution is still abound, however, especially as some mortgage lenders have removed some of the deals available in anticipation of increasing interest rates, giving rise to a possible notion that they are afraid of possible defaults should the rates go to over 5% as is being mooted by some analysts and investment banks.

This morning's upward movers on the FTSE 100 index were mainly some of the raw materials and resource stocks. Anglo American was up 50p to 2647p and Rio Tinto gained 69p to 4767p.

Given the anticipation that interest rates will rise to much higher levels than current ones, it is perhaps to be expected that the fallers on the FTSE 100 index today are house building companies. Persimmon stock dropped by 6p per share to 1258p, and Barratt stock fell 2.2p to 383p,

Rightmove, which is an online portal for real estate agencies to list their properties for rent or sale, saw its stock fall 4.4p to 545p per share.

In congruence with this, some of the major retail banks, NatWest and Lloyds notably, experienced falling share prices.

It's been a raw materials dominated world this year, and today's figures are no different.

VIEW FULL ANALYSIS VISIT - FXOpen Blog...

Disclaimer: CFDs are complex instruments and come with a high risk of losing your money.
 
BTCUSD and XRPUSD Technical Analysis – 27th SEP 2022
btc.jpg


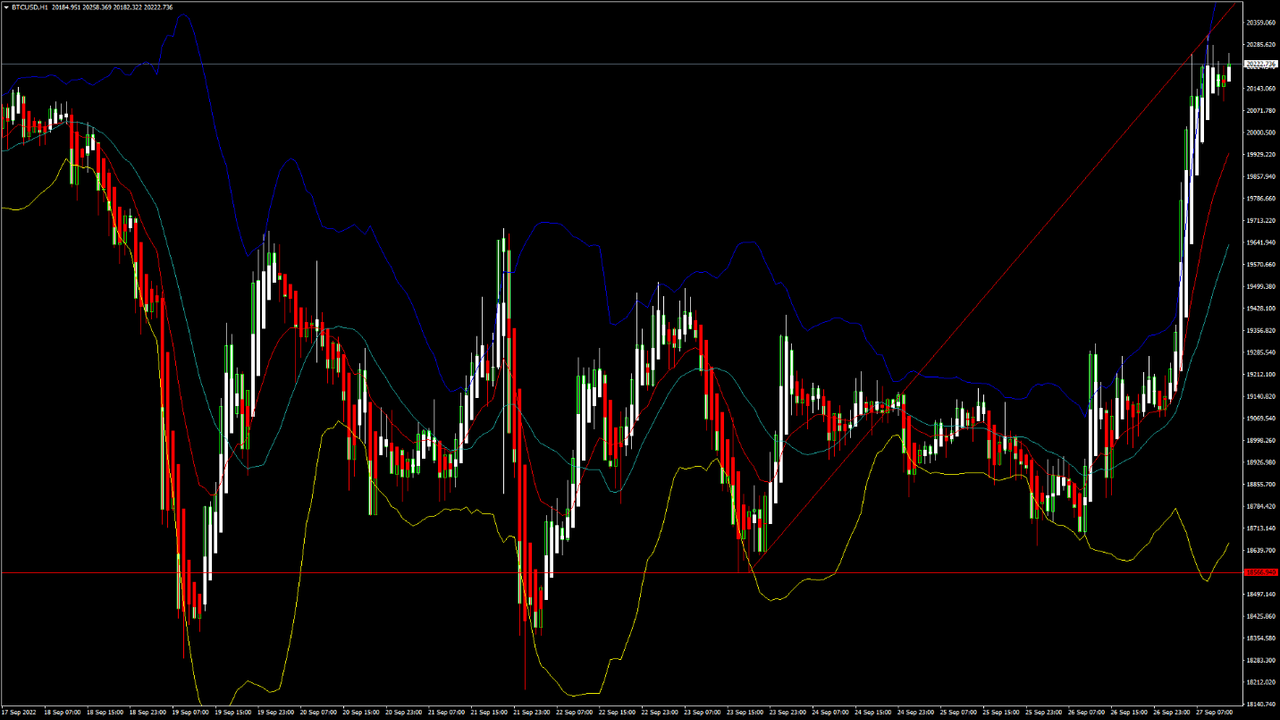
BTCUSD: Double Bottom Pattern Above $18566

Bitcoin was unable to sustain its bearish momentum and after touching a low of 18279 on 21st Sep, the price has continued to escalate upwards and crossed the $20000 handle today in the European trading session.

This upside break was long overdue and now marks the beginning of rebound towards the $25000 level.

We can see the formation of bullish engulfing lines in the 15-minute and weekly time frames.

The momentum indicator is back over zero indicating a bullish scenario in both the 30-minute and daily time frames.

We can clearly see a double bottom pattern above the $18566 handle which is a bullish reversal pattern because it signifies the end of a downtrend and a shift towards an uptrend.

Bitcoin touched an intraday low of 19097 in the Asian trading session and an intraday high of 20310 in the European trading session today.

Both the STOCH and STOCHRSI are indicating overbought levels which means that in the immediate short term, a decline in the prices is expected.

The relative strength index is at 75 indicating an OVERBOUGHT market, and the possibility of some downwards correction due to profit taking by the medium-term investors.

Bitcoin is now moving above its 100 hourly simple moving average and below its 200 hourly exponential moving averages.

Most of the major technical indicators are giving a STRONG BUY signal, which means that in the immediate short term, we are expecting targets of 22000 and 23500.

The average true range is indicating LESS market volatility with a strong bullish momentum.

  • Bitcoin: bullish reversal seen above $18566.
  • The Williams percent range is indicating an overbought level.
  • The price is now trading just above its pivot level of $20179.
  • All of the moving averages are giving a STRONG BUY market signal.

Bitcoin: Bullish Reversal Seen Above $18566
btcx.png


The price of bitcoin continues to rise amid the buying pressure and improved investor sentiments. We are now looking at the important target levels of $22000 and $25000 in the medium-term ranges.

The adaptive moving averages AMA20 and AMA50 are both giving a bullish trend reversal signal in the 15-minute and daily timeframes.

We can see the formation of a bullish harami pattern in the 2-hour time frame.

We have also detected a bullish opening of the markets indicating the underlying bullish sentiment.

The immediate short-term outlook for bitcoin is bullish, the medium-term outlook has turned bullish, and the long-term outlook remains neutral under present market conditions.

Bitcoin’s support zone is located at $19000, and the price continues to remain above these levels for the continuation of the bullish reversal in the markets.

The price of BTCUSD is now facing its classic resistance level of 20253 and Fibonacci resistance level of 20298 after which the path towards 22000 will get cleared.

In the last 24hrs, BTCUSD has increased by 5.87% by 1120$ and has a 24hr trading volume of USD 48.845 billion. We can see an increase of 46.08% in the trading volume compared to yesterday, due to global buying pressure by the long-term investors.

The Week Ahead

The price of bitcoin is moving in a consolidation zone above the $20000 level. Further upsides are projected at $21000 and $22500 as the immediate targets.

The price of bitcoin reached its peak value of $69000 last year the month of November, and at the present level of $20000, we still need to recover ground towards the $40000 level, which if reached will mark a gain of 100% from the present market level.

The history of bitcoin price action shows that it is capable of doing so, and has done in the past.

The daily RSI is printing at 52 which indicates a neutral level and a move towards the consolidation phase in the markets.

The prices of BTCUSD will need to remain above the important support level of $19000 this week.

The weekly outlook is projected at $22000 with a consolidation zone of $21500.

Technical Indicators:

The moving averages convergence divergence (12,26): is at 323.90 indicating a BUY

The ultimate oscillator: is at 62.28 indicating a BUY

The rate of price change: is at 5.93 indicating a BUY

The average directional change (14): is at 51.06 indicating a BUY

VIEW FULL ANALYSIS VISIT - FXOpen Blog...

Disclaimer: CFDs are complex instruments and come with a high risk of losing your money.
 
Big British banks pull mortgages: Pound tanks further while dollar soars
banks.jpg


Perhaps the greatest anomaly of this year remains why the US Dollar has held such a strong value against other major currencies given that the United States economy has been subjected to similar obstacles that have affected its peers in Great Britain and on the European Mainland.

As this week began, the British Pound collapsed in value to a record low against the US dollar as investors rushed to sell the currency and government bonds in a demonstration of skepticism over new Prime Minister Liz Truss’s economic plans, however since then further displays of low confidence have surfaced.

Yesterday, 10 major retail banks in the United Kingdom removed a plethora of mortgage products from the market, and considerably reworked the terms available on some of the mortgage products which remain on the market, in order to manage potential risk if interest rates rise to the expected 5 to 6% by January.

Should such a level of interest rates be reached, this would increase payments on personal and commercial debt substantially, as currently the interest rate is around 2.6%.

This, combined with a tanking Pound, and inflation heading for 18% by January according to Citigroup analysts last month, is a combination of equations which do not make for a healthy borrowing environment.

By removing these mortgage products, the property market outside London has begun to be affected, and consumer activity including house purchasing is likely to be curtailed, which would slow down the economy even further.

The FTSE 100 responded to this accordingly yesterday, with house building company stock losing value whilst raw materials providers and mineral extraction giants rose in value.

It certainly appears that the commodities and materials sector is buoyant due to high demand, but anything requiring borrowing in order to purchase the final product is now sinking in value.

The Pound is now almost at parity with the US Dollar, as demonstrated earlier today during the Asian trading session when the British Pound reached a low point of $1.0327 against the US Dollar, surpassing the previous record low reached in 1985, before making back some of its value.

Precarious is an understatement. With banks mitigating risk on such a massive scale, it looks like the roller coaster ride is not yet over.

VIEW FULL ANALYSIS VISIT - FXOpen Blog...

Disclaimer: CFDs are complex instruments and come with a high risk of losing your money.
 
ETHUSD and LTCUSD Technical Analysis – 29th SEP, 2022
eth.jpg


ETHUSD: Bullish Engulfing Pattern Above $1257

Ethereum was unable to sustain its bullish momentum and after touching a high of 1400 on 27th Sep the price started to decline against the US dollar. The price of Ethereum touched a low of 1266 on 28th Sep after which we can see a bounce upwards.

We can see a continued buying pressure today and the formation of a bullish engulfing line in the 2-hour time frame.

We can clearly see a bullish engulfing pattern above the $1257 handle which is a bullish pattern and signifies the end of a bearish phase and the start of a bullish phase in the markets.

ETH is now trading just above its pivot level of 1321 and moving into a strong bullish channel. The price of ETHUSD is now testing its сlassic resistance level of 1327 and Fibonacci resistance level of 1331 after which the path towards 1400 will get cleared.

The relative strength index is at 53 indicating a NEUTRAL demand for Ether and a shift towards the consolidation phase in the markets.

We can see that the adaptive moving average AMA20, AMA50, and AMA100 are giving a bullish trend reversal signal in the markets.

The STOCHRSI and Williams percent range is indicating a NEUTRAL market, which means that the prices are expected to remain in a consolidation phase in the short-term range.

Some of the technical indicators are giving a STRONG BUY market signal.

Most of the moving averages are giving a BUY signal and we are now looking at the levels of $1400 to $1550 in the short-term range.

ETH is now trading above both its 100 & 200 hourly simple and exponential moving averages.

  • Ether: bullish reversal seen above the $1257 mark
  • The short-term range appears to be mildly BULLISH
  • ETH continues to remain above the $1300 level
  • The average true range is indicating LESS market volatility

Ether: Bullish Reversal Seen Above $1257
etx.png


ETHUSD is moving in a mildly bullish channel with the price trading above the $1300 handle in the European trading session today.

ETH touched an intraday high of 1351 in the Asian trading session and an intraday low of 1313 in the European trading session today.

We have seen that the ichimoku price is over the cloud in the 1-hour time frame indicating a bullish scenario.

The Bullish harami pattern is observed in the weekly timeframe and MACD indicator is giving a bullish divergence signal in the 4-hour time frame.

The parabolic SAR indicator is giving a bullish reversal signal in the 30-minute time frame and now we are looking at the levels of 1450 to 1500 in the medium-term range.

The daily RSI is printing at 40 indicating a neutral demand in the long-term range.

The key support levels to watch are $1245 and $1285 and the prices of ETHUSD need to remain above these levels for the continuation of the bullish reversal in the markets.

ETH has increased by 4.27% with a price change of 54.65$ in the past 24hrs and has a trading volume of 16.127 billion USD.

We can see a decrease of 13.25% in the total trading volume in the last 24 hrs which is due to the shift towards a consolidation phase in the markets.

The Week Ahead

The price of Ethereum declined due the ongoing strength of the United States dollar and the increase in the market liquidity. We can see that now we are moving into a consolidation zone and the prices tend to move in a narrow range.

We are now looking for a fresh upside wave of correction towards the $1500 and $1600 levels.

We can see the formation of a bullish trendline in place from $1257 towards $1491 level.

The immediate short-term outlook for Ether has turned mildly BULLISH, the medium-term outlook has turned BULLISH, and the long-term outlook for Ether is NEUTRAL in present market conditions.

The prices of ETHUSD will need to remain above the important support level of $1250 this week.

The weekly outlook is projected at $1550 with a consolidation zone of $1500.

Technical Indicators:

The average directional change (14): is at 25.71 indicating a BUY

The rate of price change: is at 0.156 indicating a BUY

The bull/bear power (13): is at 1.606 indicating a BUY

The ultimate oscillator: is at 56.76 indicating a BUY

VIEW FULL ANALYSIS VISIT - FXOpen Blog...

Disclaimer: CFDs are complex instruments and come with a high risk of losing your money.
 
Top