WTI Crude Oil: wave analysis
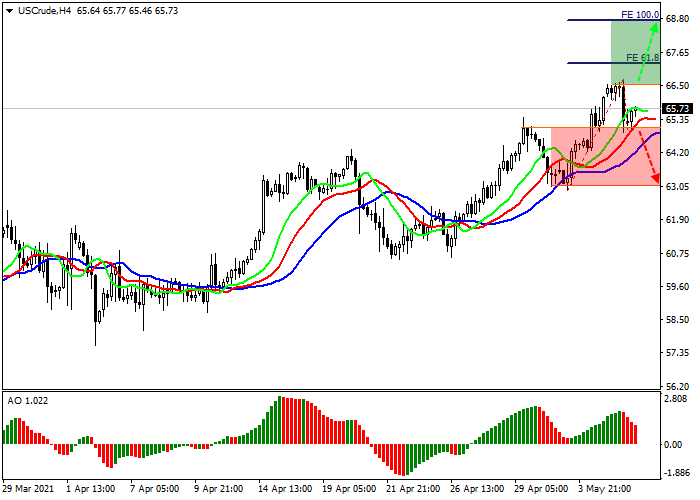
The price is in a correction, a fall is possible.
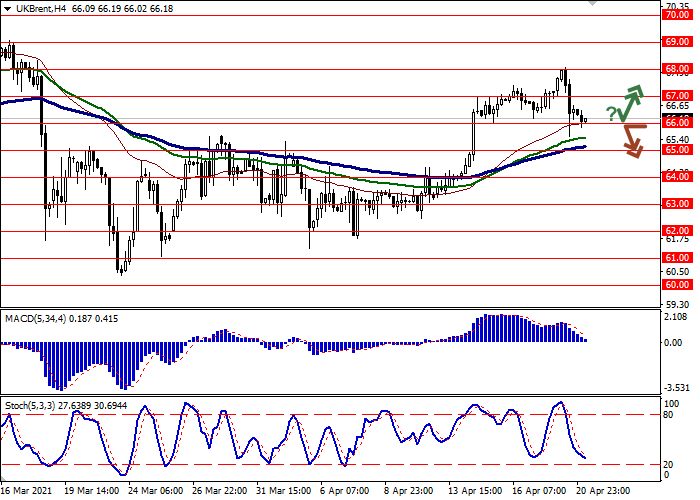
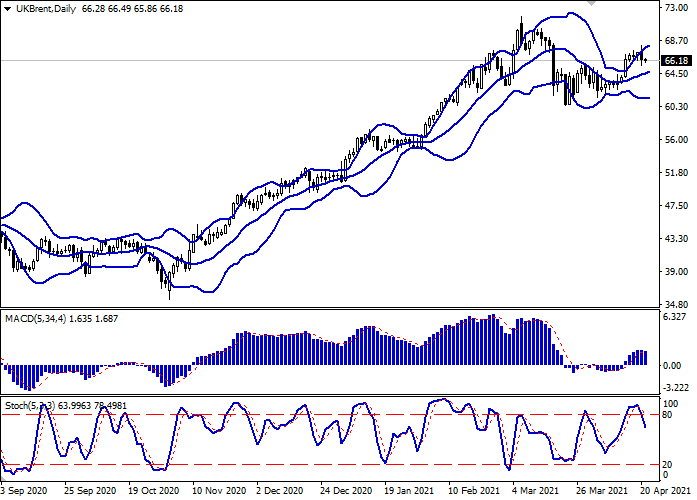
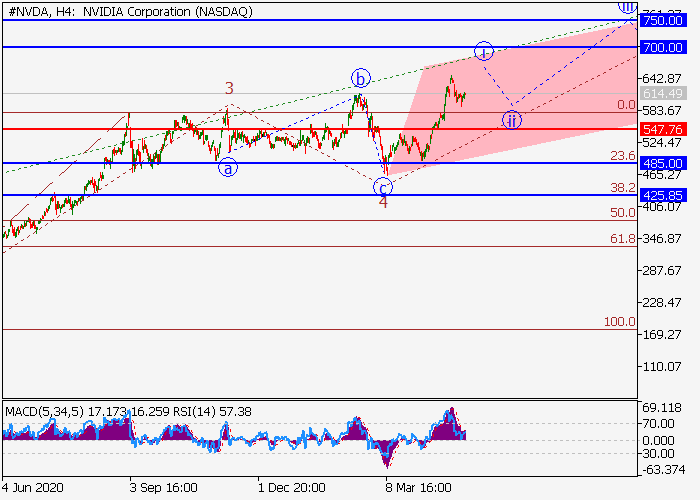
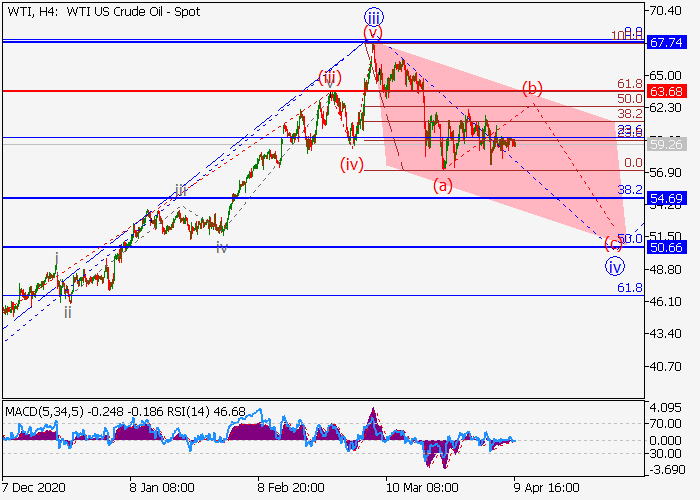
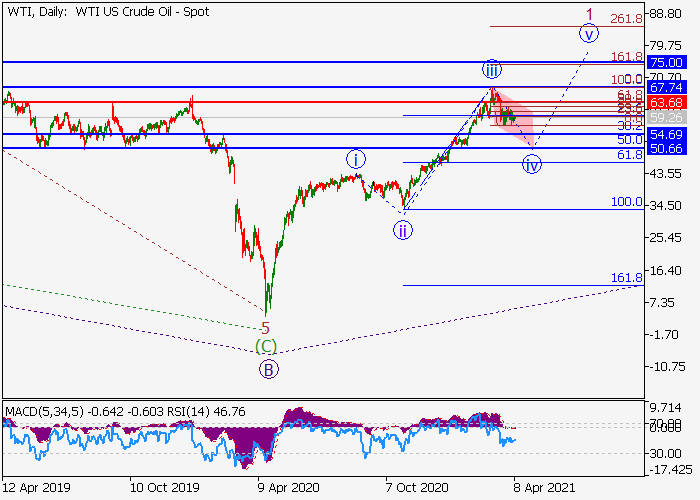
On the daily chart, a downward correction of the higher level developed as the wave B, and the upward wave C forms, within which the first wave 1 of (1) of C develops. Now, the third wave of the lower level iii of 1 has formed, and a local correction is developing as the wave iv of 1, within which the wave (a) of iv has formed, and the wave (b) of iv is developing. If the assumption is correct, after the end of the correction, the price will fall to the levels of 54.69–50.66. In this scenario, critical stop loss level is 63.68.
The price is in a correction, a fall is possible.
On the daily chart, a downward correction of the higher level developed as the wave B, and the upward wave C forms, within which the first wave 1 of (1) of C develops. Now, the third wave of the lower level iii of 1 has formed, and a local correction is developing as the wave iv of 1, within which the wave (a) of iv has formed, and the wave (b) of iv is developing. If the assumption is correct, after the end of the correction, the price will fall to the levels of 54.69–50.66. In this scenario, critical stop loss level is 63.68.