• The Forex, Binary Options Forum - welcomes you to our Community!

    DigitalCashPalace Forum is dedicated to discussions about Forex, Binary Options, commodities, stocks related.

    Please take a look around, and feel free to .

Forex Analysis by LiteForex

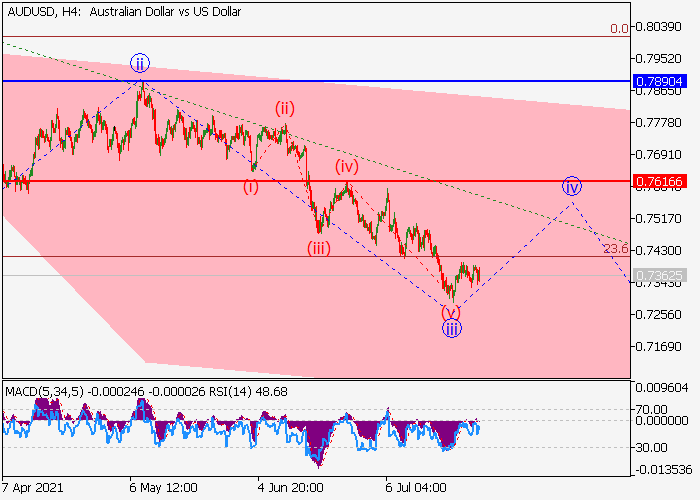
AUD/USD: the uptrend is strengthening

Current trend

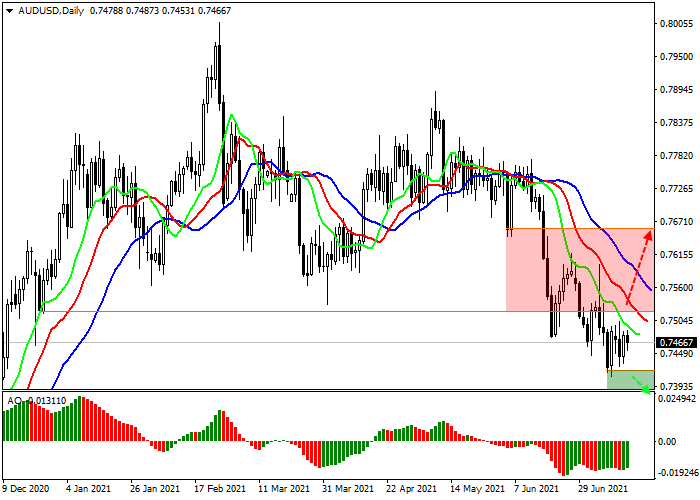
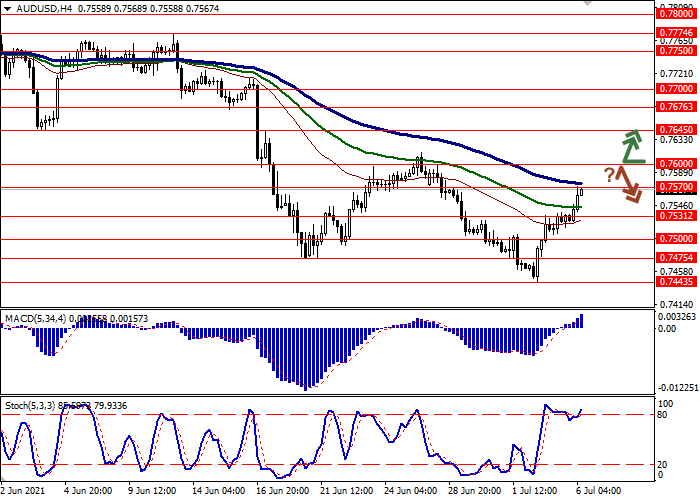
AUD has shown significant gains against USD in trading in Asia, updating local highs since the end of June and actively testing 0.7570 for a breakout.

The instrument significantly benefited from the publication of Friday's US labor market report, as investors rushed to look for alternatives to the "safe" USD, expecting that the US Fed will maintain its current monetary policy for a while. "Bullish" sentiment was supported yesterday by moderately optimistic macroeconomic statistics from Australia. In particular, investors reacted positively to a 0.4% MoM growth in retail sales in May after a 0.1% MoM growth in April.

Today, traders are focused on the meeting of the Reserve Bank of Australia (RBA), at which, as expected, the regulator left the interest rate level unchanged at 0.1%. As for the bond buyback program, the RBA intends to prolong it after completion in early September. The regulator is expected to buy bonds worth 4B dollars a week until at least mid-November.

Support and resistance

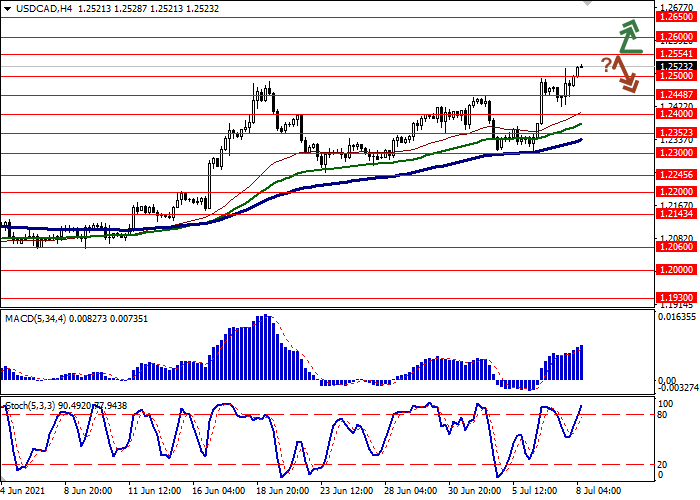
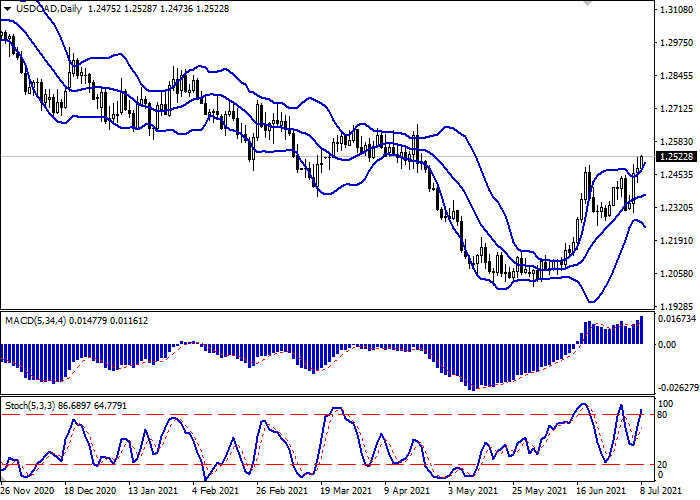
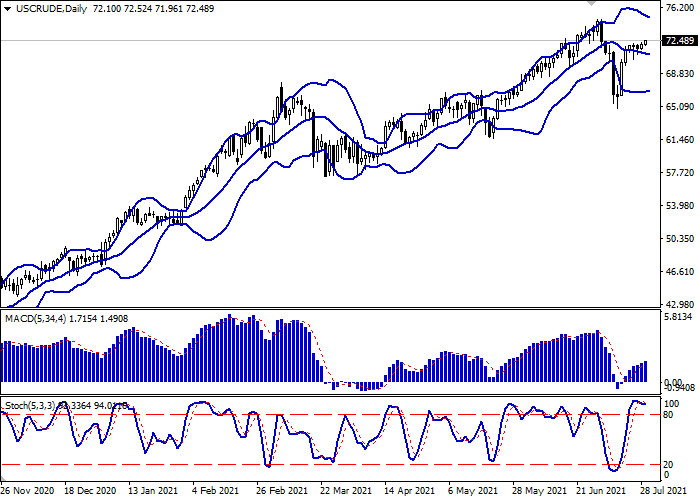
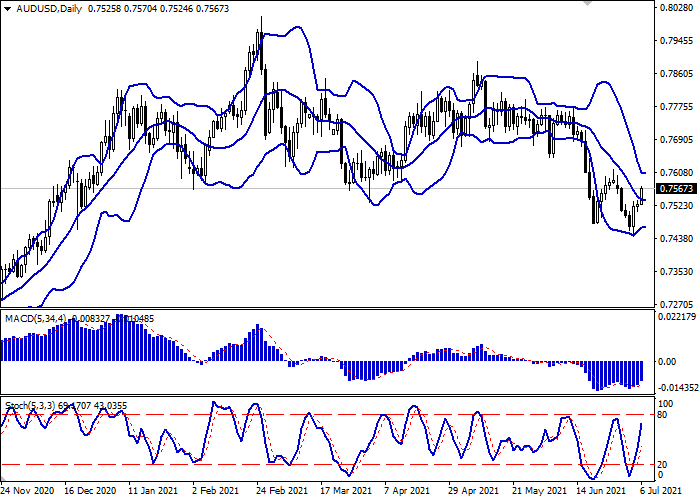
In the D1 chart, Bollinger Bands are reversing horizontally. The price range is narrowing from above, being spacious enough for the current activity level in the market. MACD has reversed to growth having formed a strong buy signal (located above the signal line). Stochastic keeps its upward direction but is approaching its highs rapidly, which reflects risks of the overbought AUD in the ultra-short term.

Resistance levels: 0.7570, 0.7600, 0.7645, 0.7676.
Support levels: 0.7531, 0.7500, 0.7475, 0.7443.

0e07741c4b6c054ac4295c70d99462b8.png


a3d1549c12a11162f628211bae9ecb6b.png
 
Mastercard Inc.: wave analysis

The price may grow.

On the daily chart, the fifth wave of the higher level (5) develops, within which the wave 3 of (5) forms. Now, the third wave of the lower level iii of 3 is developing, within which the wave (ii) of iii has ended, and the formation of the wave (iii) of iii has started. If the assumption is correct, the price will grow to the levels of 450.00–500.00. In this scenario, critical stop loss level is 355.20.

4d131904183be88cbcdf9a8a8fc3de33.png


8473b67d95c25e4fc4a077bffc954d86.png
 
USD/CAD: the instrument is renewing the highs since the end of April

Current trend

Today, during the Asian session, the USD/CAD pair grows steadily, renewing the local highs of April 22.

Yesterday, the instrument showed ambiguous dynamics, which was caused by the publication of the latest minutes of the US Federal Reserve meeting. As expected, they reflected its wait-and-see stance on reductions in existing incentives. Also, the regulator expects a gradual return of inflation to the target level of 2%. Positive macroeconomic statistics from Canada put additional pressure on the rate. Thus, the Ivey business activity index for June rose from 64.7 to 71.9 points, which was better than the average forecasts of analysts.

On Thursday, traders will focus on US statistics on the dynamics of initial and continuing jobless claims. Key data from Canada is due on Friday when the June labor market report will be released. Analysts' forecasts for Canadian statistics are very optimistic.

Support and resistance

On the daily chart, Bollinger bands grow moderately. The price range expands but not as fast as the “bullish” sentiment develops at the moment. MACD grows, maintaining a strong buy signal (the histogram is above the signal line). Stochastic also maintains a strong upward trend but is close to its highs, signaling that USD is overbought in the short term.

The current readings of technical indicators do not contradict the further development of bullish dynamics in the nearest time intervals.

Resistance levels: 1.2554, 1.2600, 1.2650.
Support levels: 1.2500, 1.2448, 1.2400, 1.2352.

3ff3f66ce4b036ca7cfcead4df1e87f7.png


4d7efa3a60b1deb03c092ac0eecab2c5.png
 
GBP/USD: moderate decline at the end of the week

Current trend

GBP is showing a slight decline against USD during the morning trading session, preparing to end the week near the local lows since July 2. The instrument is testing 1.3770 for a breakdown and expects new drivers to appear on the market, which may be the US Fed's monetary policy report and a block of macroeconomic statistics from the UK.

Macroeconomic data from the USA published the day before turned out to be contradictory. Initial Jobless Claims for the week ending July 2 unexpectedly increased from 371K to 373K, which turned out to be significantly worse than the positive market forecast of a decrease to 350K. Continuing Jobless Claims for the week ending June 25 fell from 3.484M to 3.339M, which was only slightly worse than expectations at 3.335M.

Support and resistance

Bollinger Bands in D1 chart demonstrate a stable decrease. The price range is almost unchanged, but it remains rather spacious for the current level of activity in the market. The MACD indicator is trying to reverse upwards, keeping a formal buy signal (the histogram is above the signal line). However, it is still not worth relying on such indicator readings at the moment. Stochastic, on the other hand, maintains a moderate decline, rapidly approaching the level of "20", which indicates increasing risks of oversold GBP in the ultra-short term.

Resistance levels: 1.3800, 1.3857, 1.3900, 1.3960.
Support levels: 1.3750, 1.3700, 1.3650, 1.3600.

7896032c07f90f70aeeb6bb2f85dce50.png


9089918af5e5089da8165af8ce0b1af5.png
 
WTI Crude Oil: prices are holding near record highs

Current trend

Today, during the Asian session, prices for WTI Crude Oil are growing moderately, developing the “bullish” momentum formed at the end of last week.

Yesterday, the instrument renewed record highs since October 2018 but still failed to consolidate at the occupied levels since a wave of sales covered the market at the end of the daily session. The situation remains rather uncertain at the moment, as investors assess the likelihood of the spread of a new strain of coronavirus, which could lead to new restrictive measures and a decrease in energy demand. Also, the quotes are influenced by the ambiguous OPEC+ policy: the latest negotiations of the alliance reached a dead end but traders do not give up hope that an agreement will be reached.

On Tuesday, investors are focused on statistics on consumer inflation in the US and a report from the American Petroleum Institute (API) on oil reserves for the week of July 9. Previous data reflected a decrease in reserves by 7.983M barrels.

Support and resistance

Bollinger bands actively grow on the daily chart. The price range expands from above but not as fast as the “bullish” sentiments develop. MACD reversed upwards, forming a new buy signal (the histogram is above the signal line). Stochastic grows but the indicator line is approaching its highs, indicating that the instrument may become overbought in the ultra-short term.

Resistance levels: 75.68, 76.27, 77.00.
Support levels: 75.00, 74.00, 73.00, 71.80.

90035840f4f094ae7c16fba8fd298eca.png


3111a9cf0e044d39c2d10a9f8b0ad1a2.png
 
NZD/USD: wave analysis

The pair is in a correction, a fall is possible.

On the daily chart, the upward wave of the higher level (А) of B developed, and the downward wave (B) of B forms. Now, the wave C of (B) is developing, within which the development of the third wave of the lower level iii of C has started. If the assumption is correct, the pair will fall to the levels of 0.6690–0.6467. In this scenario, critical stop loss level is 0.7321.

3e20410b7deeeaf0a86439dbcbf4798e.png


b30ccaf87218ca11501ec671a0ef1c6b.png
 
AUD/USD: rhetoric of the US Fed again disappointed the markets

Current trend

The pair AUD/USD continues to correct in a lateral trend amid ambiguous data on the Australian labor market and is at 0.7465.

The overall unemployment rate fell in June to 4.9% from 5.1% in May, but the number of people employed increased by 29.1K (slightly lower than the 30.0K forecast). The share of the economically active population remained at the May level (66.2%), while analysts expected the indicator to increase to 66.3%. The indicators reflected the ongoing recovery of the labor market, and for a complete picture, one needs to wait for the inflation data.

USD also failed to get support after yesterday's speech by the head of the US Fed Jerome Powell in the House of Representatives. Analyzing the significant increase in inflation, the official continued to adhere to his line and noted that, despite the unexpected persistence of inflation, the regulator does not plan to take action and expects a decrease in the indicator as the impact of the pandemic subsides. Investors were disappointed by the agency’s reaction, and the dollar sell-off began to intensify.

Support and resistance

On the global chart, the price continues to form a downtrend. Technical indicators still give a sell signal: the range of the EMAs fluctuations of the Alligator indicator is quite wide, and the AO histogram is trading deep in the sell zone.

Support levels: 0.7420, 0.7200.
Resistance levels: 0.7520, 0.7655.

d706e9a142d06523a948f2349e32eb98.png
 
Intel Corp.: wave analysis

The price may grow.

On the daily chart, a downward correction of the higher level developed as the second wave (2), within which the wave C of (2) formed, and the development of the third wave (3) started. Now, the first entry wave of the lower level 1 of (3) has formed, a downward correction has developed as the wave 2 of (3), and the formation of the wave 3 of (3) has started. If the assumption is correct, the price will grow to the levels of 75.00–80.00. In this scenario, critical stop loss level is 53.14.

3419aa83a5580349ae4b279b6f1a9d90.png


4db511b3aa35436adde1d5042a5c1475.png
 
WTI Crude Oil: wave analysis

The price may grow.

On the daily chart, a downward correction of the higher level developed as the wave B, and the upward wave C forms, within which the first wave 1 of (1) of C develops. Now, the fifth wave of the lower level v of 1 is forming, within which the wave (iii) of v has formed, and the fourth correctional wave (iv) of v is ending. If the assumption is correct, after the end of the correction, the price will grow to the levels of 80.00–85.00. In this scenario, critical stop loss level is 69.20.

3b74786f9adc3e5c29ff6a457fe42f67.png


826dabac254384c78695c857f73019d8.png
 
Alibaba Group Holdings Ltd.: wave analysis

The price may fall.

On the daily chart, the first upward wave of the higher level 1 developed, and a downward correction forms as the wave 2. Now, the wave (C) of 2 is forming, within which the fifth wave of the lower level 5 of (C) is developing. If the assumption is correct, the price will fall to the levels of 187.27–155.97. In this scenario, critical stop loss level is 231.50.
0258e2b147736b9f96110c2056ae35b5.png


a42acff74edb04d92521f73ab63ecd13.png
 
Morning Market Review

EUR/USD

EUR shows ambiguous dynamics against USD during today's Asian session, holding at its lows since April 5. The day before, EUR showed steady growth, but then fell just as quickly, which was caused by the publication of the minutes of the meeting of the European Central Bank (ECB) on the interest rate. As expected, the regulator kept the parameters of the monetary policy unchanged, but provided updated recommendations, according to which the recovery of the region's economy may require "constant and strong" support. Earlier, the European Central Bank announced a new monetary policy strategy and adjusted the inflation target. The latter, however, does not show any stable uptrend, and therefore there is no hope for a reduction in the quantitative easing program in the near future. Additional pressure on EUR was put by data on the level of consumer confidence in the eurozone, which in July fell from –3.3 to –4.4 points, while analysts had expected a moderate rise in the indicator to –2.5 points. Today, investors are focused on statistics on business activity in the manufacturing and services sectors in the eurozone for July.

GBP/USD

GBP is trading downwards against USD, correcting after strong gains over the past two sessions that pushed the instrument to local highs since July 16. The reason for the further development of "bullish" trend yesterday was the weak position of USD, which reacted to the publication of macroeconomic statistics from the USA. Initial Jobless Claims for the week ending July 16 unexpectedly increased from 368K to 419K, which turned out to be worse than market expectations at 350K. Continuing Jobless Claims fell from 3.265M to 3.236M, but fell short of the expected 3.1M. Correctional sentiment reigns in the market today as investors rush to lock in long profits ahead of the weekend. Slight support for GBP is provided by data on Gfk Consumer Confidence. In July, the indicator continued to grow and strengthened from –9 to –7 points, which turned out to be slightly better than the market forecasts at the level of –8 points.

AUD/USD

AUD shows ambiguous dynamics of trading against USD during the Asian session, consolidating near the local highs and the level of 0.7400. The instrument is supported by the weak positions of USD, which is under pressure from the disappointing macroeconomic statistics from the US on jobless claims. At the same time, the further growth of the pair is hindered by the data from Australia, released today. Commonwealth Bank Services PMI in July fell sharply from 56.8 to 44.2 points, which turned out to be worse than the forecasts. Commonwealth Bank Manufacturing PMI also fell from 58.6 to 56.8 points. In turn, the Composite PMI in July fell from 56.7 to 45.2 points.

USD/JPY

USD shows slight gains against JPY in Asian trading, recovering from a slight decline the day before. Yesterday, USD recorded a decline against most of its competitors, responding to the publication of unexpectedly weak macroeconomic statistics from the US on the dynamics of initial jobless claims. However, USD's decline against JPY turned out to be very limited, as investors preferred to return to more risky assets for a while. In addition, there was a day off in Japan yesterday due to the Health and Sports Day. Today, investors are focused on statistics on business activity in the manufacturing and services sectors in the US from Markit. Analysts' forecasts suggest a slight increase in indicators, which is unlikely to provide significant support to USD.

XAU/USD

Gold prices are declining during today's Asian session, developing flat dynamics in the short term. The day before, the instrument renewed its local lows since July 12, responding to the growth of stock indices and a moderate increase in USD rate. However, with the opening of the US trading session, the "bulls" managed to fully recoup, entering the green zone after the publication of disappointing macroeconomic statistics on jobless claims in the USA. Meanwhile, concerns about a new wave of the COVID-19 pandemic continue to provide moderate support for gold, as a number of countries are seeing a sharp increase in the number of infections.
 
GBP/USD: wave analysis

The pair may grow.

On the daily chart, the first wave of the higher level (1) formed, and a correction formed as the wave (2). Now, the wave C of (2) has developed, and the formation of the wave (3) is starting. If the assumption is correct, the pair will grow to the levels of 1.4246–1.4400. In this scenario, critical stop loss level is 1.3578.

cf3f990f43bca60e343366099ccb54a8.png


3680f5f194cc87010e4a719a44f1f9f4.png
 
Bank of America Corp.: wave analysis

The price may fall.

On the daily chart, the fifth wave of the higher level 5 forms, within which the wave (3) of 5 developed. Now, a local correction has started to form as the fourth wave (4) of 5, within which the wave A of (4) has formed. If the assumption is correct, after the end of the wave B of (4), the price will fall to the levels of 35.62–33.26. In this scenario, critical stop loss level is 43.53.

18777d012b5ed2ad66962d6331fe6ed3.png


970fb36916154541e422f3f0c906a189.png
 
AUD/USD: wave analysis

The pair may fall.

On the daily chart, the first wave of the higher level (1) of C developed, and a downward correction forms as the wave (2) of C. Now, the wave A of (2) is forming, within which the third wave of the lower level iii of A has developed, and a local correction has started to forming as the wave iv of A. If the assumption is correct, after the end of the correction, the pair will fall to the levels of 0.7036–0.6742. In this scenario, critical stop loss level is 0.7616.

3448b7b9cc16733ee87e023da0573935.png


c5952eabf6ab041930abb8275e89f9a4.png
 
WTI Crude Oil: oil prices are slightly strengthening

Current trend

Yesterday, prices for WTI Crude Oil rose slightly, and today, during the Asian session, they continue to develop upward dynamics, renewing local highs since July 14.

Yesterday, the data on the dynamics of stocks of oil and petroleum products in the USA provided moderate support to the quotes. However, more confident growth was hampered by the released minutes of the US Federal Reserve, which for some time contributed to the strengthening of the position of the American currency. The report of the US Department of Energy reflected a decrease in oil reserves in the United States for the week of July 23 by 4.089M barrels after an increase of 2.108M barrels over the previous period. Analysts had expected negative dynamics in reserves but hoped for only 2.928M barrels. Gasoline stocks fell by 2.25M barrels, while total US oil production fell by 200K barrels per day to 11.2M barrels per day.

Support and resistance

On the daily chart, Bollinger bands are showing sideways dynamics. The price range narrows slightly in response to the ambiguous nature of trades in recent weeks, but its width remains sufficient for the current price dynamics. The MACD indicator is growing, maintaining a poor buy signal (the histogram is above the signal line). Stochastic, having reached its maximum values, is trying to reverse into a downward plane, signaling in favor of the development of a corrective decline in the ultra-short term.

Resistance levels: 73.00, 74.00, 75.00, 75.68
Support levels: 71.80, 71.00, 70.00, 69.07.

ed32da2409cfb2c8a84db34b99d39053.png


f901561d09e6eb7e9dfd11a6e2df950a.png
 
EUR/USD: data from the EU disappointed investors again

Current trend

Against the background of a significant decline in EU macroeconomic indicators, the EUR/USD pair corrects downwards, trading around 1.1720.

This week, the downtrend for the European currency continued due to the deterioration of macroeconomic indicators in the EU. Another piece of data for Germany was published yesterday. Thus, ZEW current economic conditions index with the forecast for August amounted to 29.3 points, which is lower than the forecasted 30.0 points. ZEW index of economic sentiment dropped by 22.9 points and amounted to 40.4 points, which is significantly worse than the 56.7 points expected by analysts.

The American currency index is in an uptrend and has already reached the level of 93.000, which has not been seen since the end of March. The reason for the positive dynamics was the approval by the US Senate of a new infrastructure bill, which involves the cost of financing roads, bridges, railroads, and electrical networks in the amount of $1.2T. It is part of the global plan of US President Joe Biden, finalized during the Senate vote.

Support and resistance

On the global chart, the price is forming a Head and shoulders pattern. Technical indicators reversed and issued a sell signal, confirming the implementation of the pattern: fast EMAs on the Alligator indicator are below the signal line, and the AO oscillator histogram crossed the zero line and continues to decline.

Resistance levels: 1.1767, 1.1888.
Support levels: 1.1702, 1.1600.

bd15c4b712ba1233998f268ea42e4eb1.png
 
American Express Co.: wave analysis

The price may fall.

On the daily chart, the fifth wave of the higher level (5) develops, within which the wave 3 of (5) formed. Now, a downward correction has started to develop as the fourth wave 4 of (5). If the assumption is correct, the price will fall to the levels of 157.42–144.15. In this scenario, critical stop loss level is 178.60.

93e12f5abd693b158a763c0e86457894.png


b11b26f61ecc29a50d7110592033a031.png
 
Intel Corp.: wave analysis

The price is in a correction and may grow.

On the daily chart, a downward correction of the higher level developed as the second wave (2), within which the wave C of (2) formed, and the development of the third wave (3) started. Now, the first entry wave of the lower level 1 of (3) has formed, and a downward correction is ending to develop as the wave 2 of (3), within which the wave c of 2 is ending. If the assumption is correct, after the end of the correction, the price will grow to the levels of 68.50–75.00. In this scenario, critical stop loss level is 48.50.

5740c828811f0bee2cb9ab515d21fcc8.png


5a69f2e400417bf5608f62fd16ed5014.png
 
Walt Disney Co.: wave analysis

The price may grow.

On the daily chart, a downward correction of the higher level developed as the fourth wave (4), and the fifth wave (5) develops, within which the development of the wave 5 of (5) develops. Now, the wave iii of 5 is forming, within which the wave (ii) of iii has developed, and the formation of the wave (iii) of iii has started. If the assumption is correct, the price will grow to the levels of 202.98–220.00. In this scenario, critical stop loss level is 170.56.

b4398051b25da6df7c143fdcf68f7069.png


f9eb231708afddea501cdccc25b7f6b4.png
 
Nvidia Corp.: wave analysis

The price may grow.

On the 15-minutes chart, the first upward wave of the higher level 1 develops, within which the wave iii of 1 formed, and a local correction ended as the wave iv of 1. Now, the fifth wave v of 1 is developing, within which the wave (ii) of v is developing. If the assumption is correct, the price will grow to the levels of 209.30–215.00. In this scenario, critical stop loss level is 194.03.

4ae1b013d549533968b521a2bf2bedfb.png


b58de8fb730812c4c2d10d05e9e4ccfa.png
 
Top