XAU/USD: wave analysis
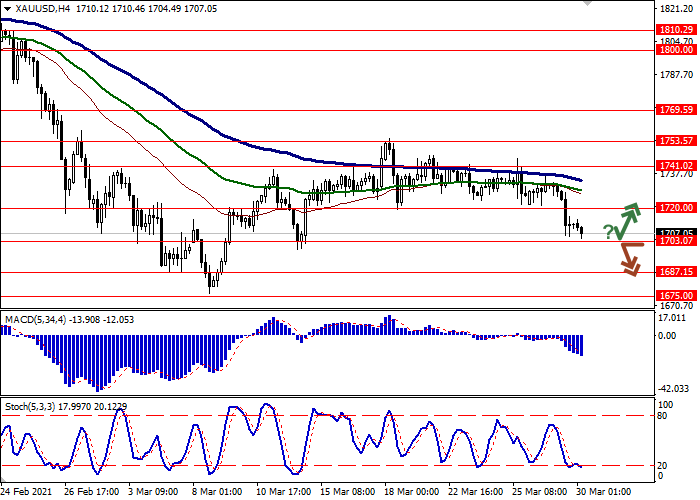
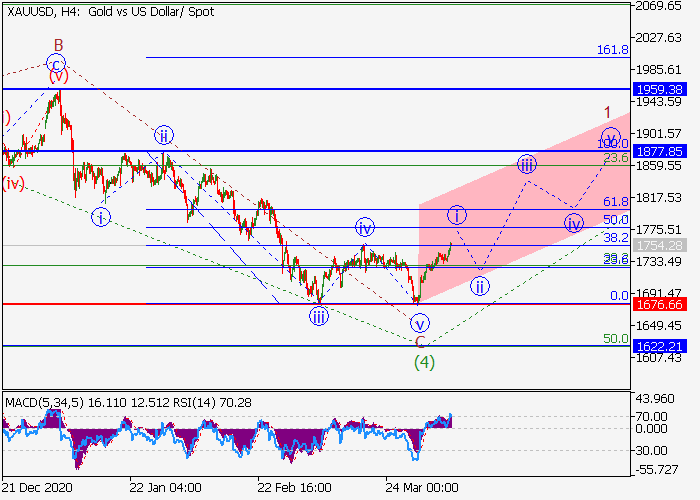
The pair is in a correction, a fall is possible.
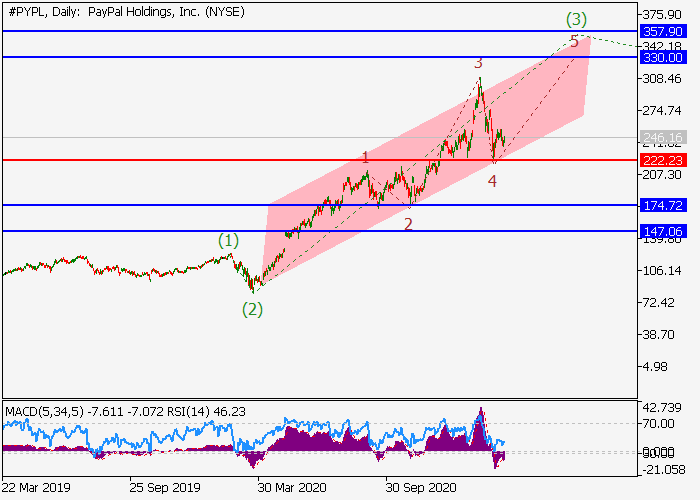
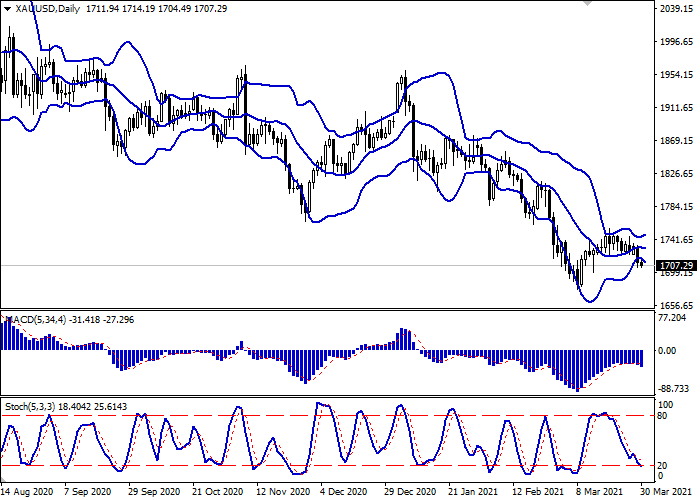
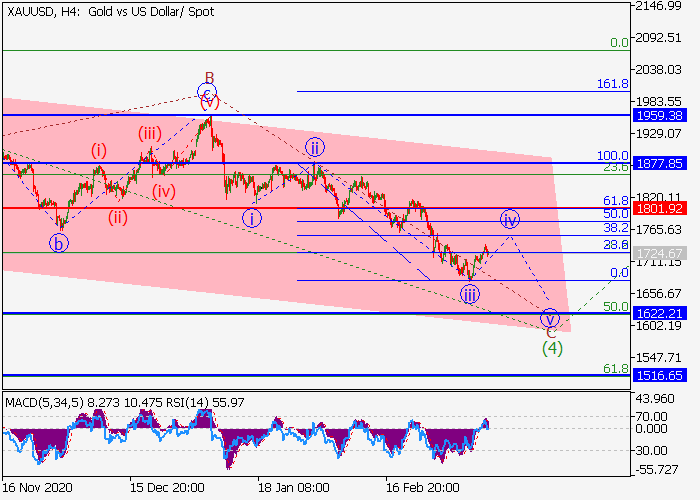
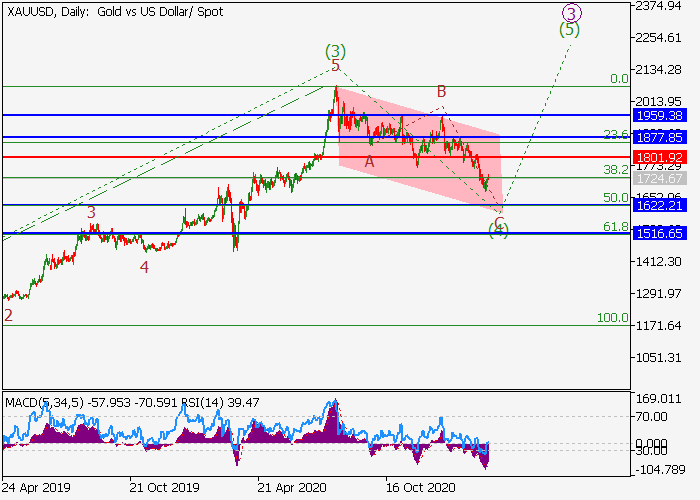
On the daily chart, the third wave of the higher level (3) formed, and a downward correction develops as the fourth wave (4). Now, the wave C of (4) is forming, within which the wave iii of C has formed, and a local correction is developing as the wave iv of C. If the assumption is correct, after the end of the correction, the pair will fall to the levels of 1622.21–1516.65. In this scenario, critical stop loss level is 1801.92.
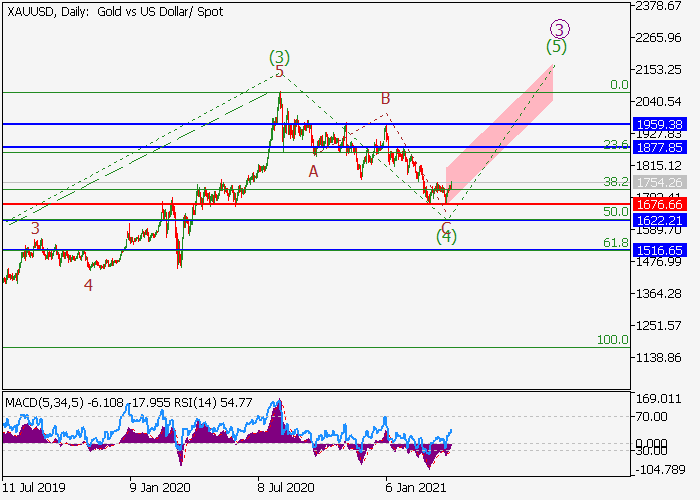
The pair is in a correction, a fall is possible.
On the daily chart, the third wave of the higher level (3) formed, and a downward correction develops as the fourth wave (4). Now, the wave C of (4) is forming, within which the wave iii of C has formed, and a local correction is developing as the wave iv of C. If the assumption is correct, after the end of the correction, the pair will fall to the levels of 1622.21–1516.65. In this scenario, critical stop loss level is 1801.92.