EUR/USD: wave analysis
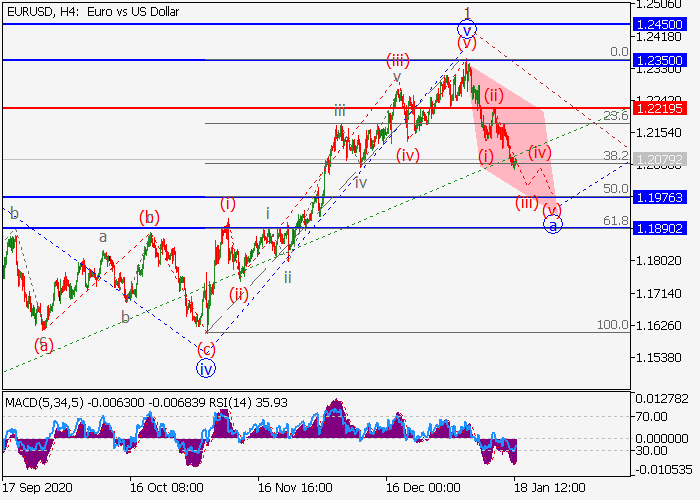
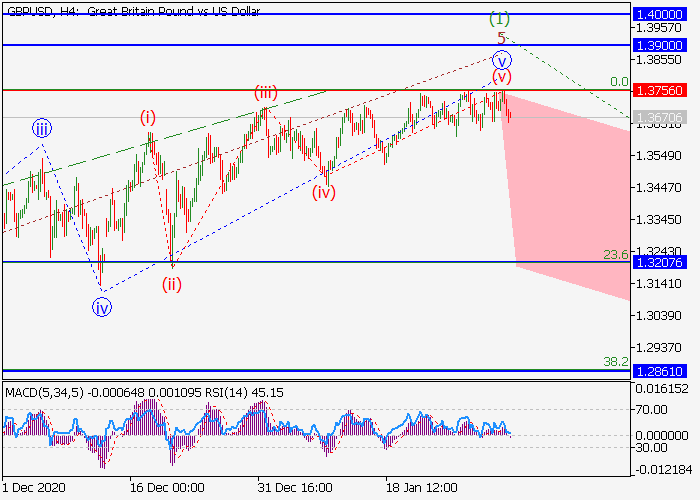
The price may fall.
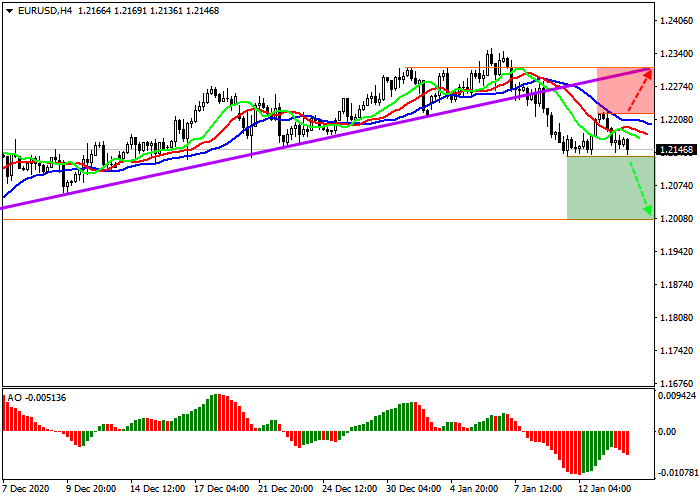
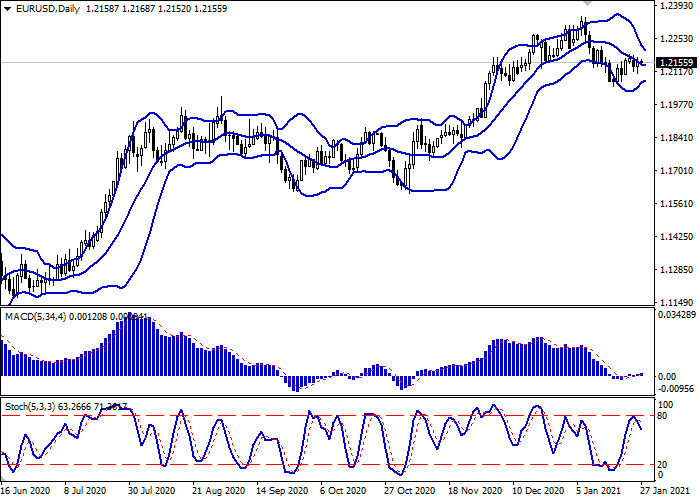
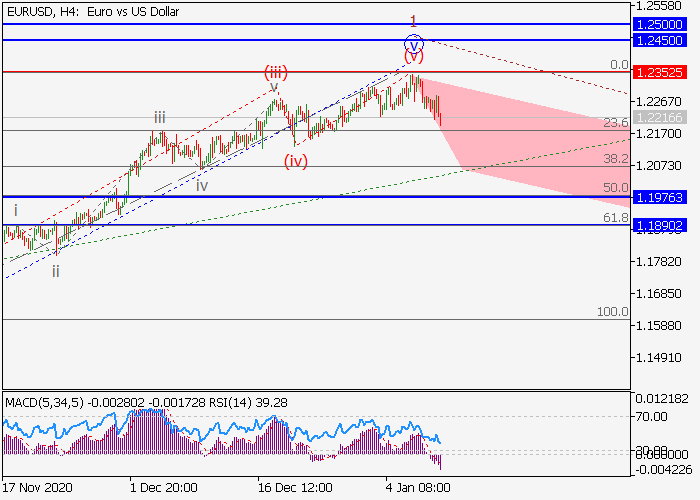
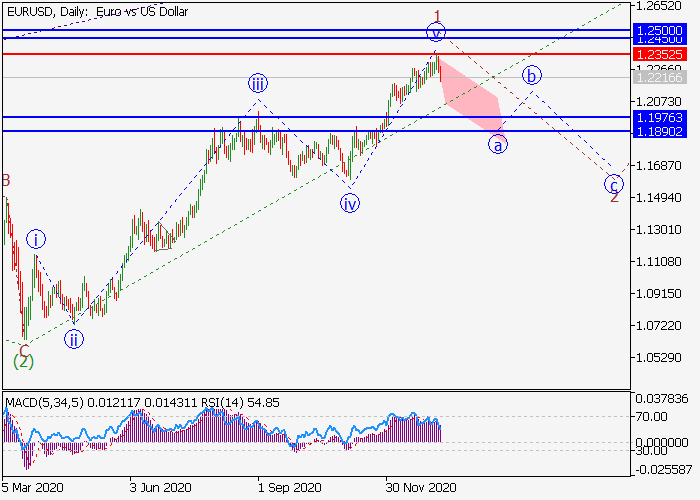
On the daily chart, the first wave of the higher level 1 of (3) developed, within which the fifth wave v of 1 formed. Now, a downward correction is starting to develop as the second wave 2 of (3), within which the wave a of 2 is forming. If the assumption is correct, the pair will fall to the levels of 1.1976–1.1890. In this scenario, critical stop loss level is 1.2352.
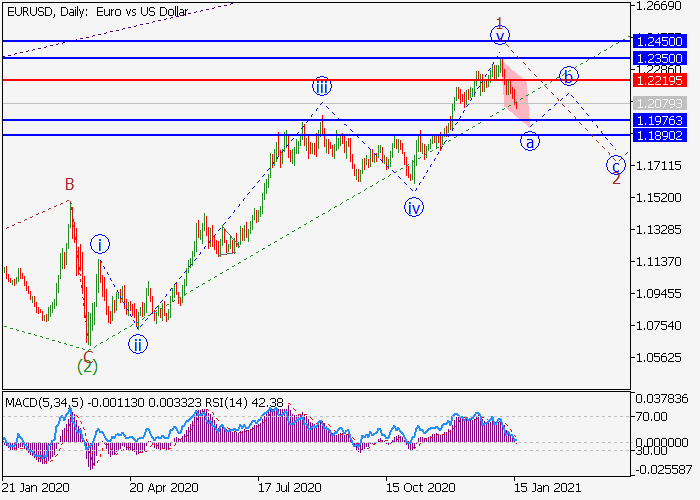
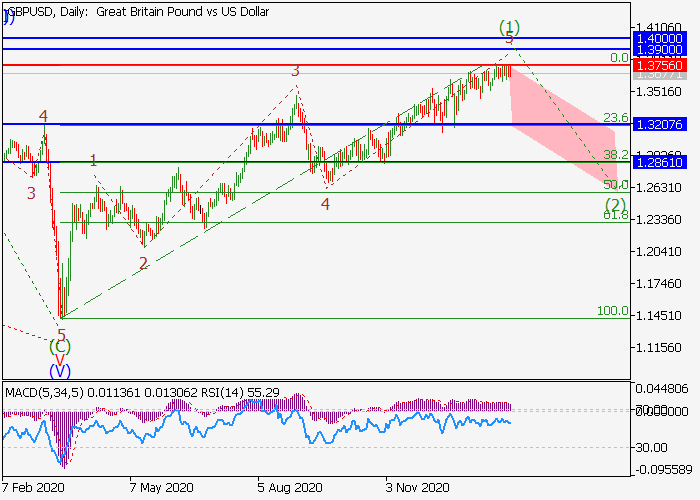
The price may fall.
On the daily chart, the first wave of the higher level 1 of (3) developed, within which the fifth wave v of 1 formed. Now, a downward correction is starting to develop as the second wave 2 of (3), within which the wave a of 2 is forming. If the assumption is correct, the pair will fall to the levels of 1.1976–1.1890. In this scenario, critical stop loss level is 1.2352.