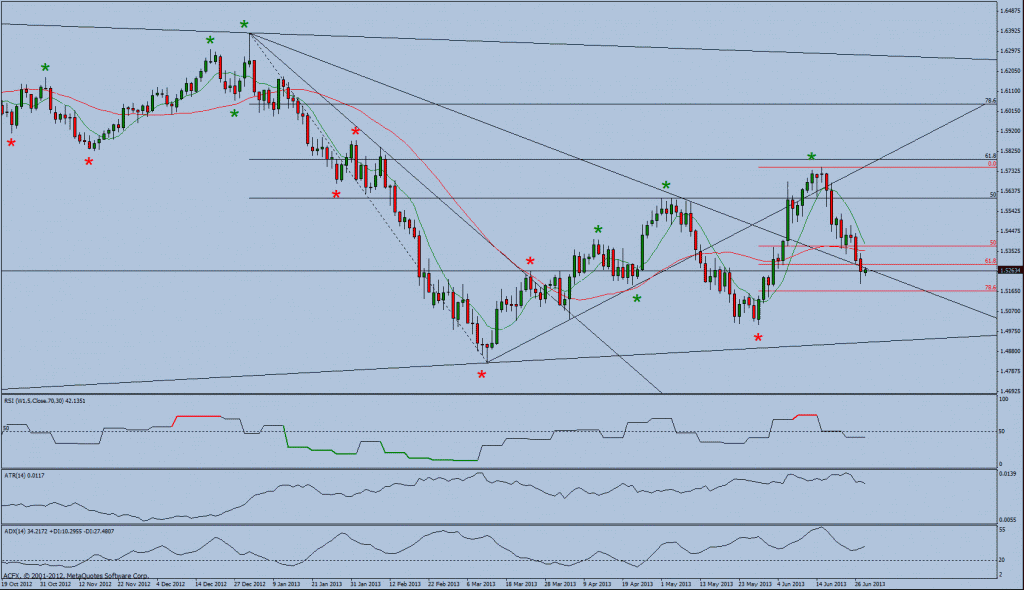
Daily Technical Analysis for EURUSD as at 19th June 2013
DAILY OVERVIEW
Trend : Long
Ambush Zone : -
Target 1 : -
Target 2 : -
Stop : -

Comments
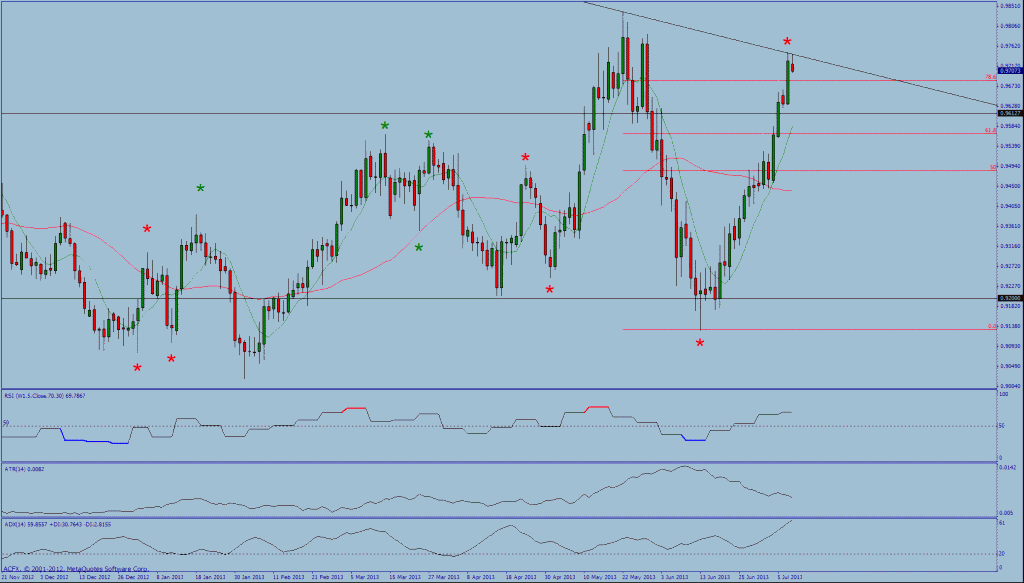
EURUSD is this morning trading down from the open after yesterdays strong down day. Today’s opening range is 53 pips which equates to 52% of the daily average true range.
Yesterday EURUSD corrected to and broke through the 8 period moving averages. We are monitoring the price actions reaction as it approaches the 1.3250 to 1.3175 support range
In terms of the bigger picture the swing bias is positive.
The following factors are confirming or reinforcing this market bias:
1. The moving averages are layered positively.
2. The price action has managed to break above the downward sloping trend line.
3. The RSI is in gear with the move up.
4. The price action has breached the prior Swing High level 1.3250.
5. Both the daily and weekly time frames as positive and in gear.
6. A Head and Shoulders pattern failure on the Weekly time frame.
Alternative counter trend bearish factors:
1. The price action has rejected the Fibonacci resistance area.
2. The price action is trading beneath the 8 period moving averages.
Scenario 1
As the dominant daily trend is up retracements into support could be viewed as buying opportunities
Scenario 2
Alternatively one could possibly sell retracements at the 8 period moving averages with a view of trading down to Fibonacci support.
Daily Technical Analysis for GBPUSD as at 20th June 2013
DAILY OVERVIEW
Trend : Long
Ambush Zone : -
Target 1 : -
Target 2 : -
Stop : -

Comments
GBPUSD is this morning trading lower from the open after yesterdays strong down day. Today’s opening range is 68 pips which equates to a 53% of the daily average true range.
Yesterday GBPUSD continue it’s down move as it approaches the 34 period mobbing averages and Fibonacci support.
In terms of the bigger the swing bias remains positive.
The following factors are confirming or reinforcing this market bias:
1. The moving averages continue to be positively layered.
2. Both the daily and weekly time frames are positive and in gear.
3. The RSI is in gear with the move.
4. The price action has breached the prior Swing High level 1.5600.
Alternative counter trend bearish factors:
1. The price action has rejected the Fibonacci resistance area.
2. The price action is trading beneath the 8 period moving averages.
Scenario 1
As the dominant daily trend is up retracements into support could be viewed as buying opportunities
Scenario 2
Alternatively one could possibly sell retracements at the 8 period moving averages with a view of trading down to Fibonacci support.
Daily Technical Analysis for USDJPY as at 20th June 2013
DAILY OVERVIEW
Trend : Short
Ambush Zone : -
Target 1 : -
Target 2 : -
Stop : -

Comments
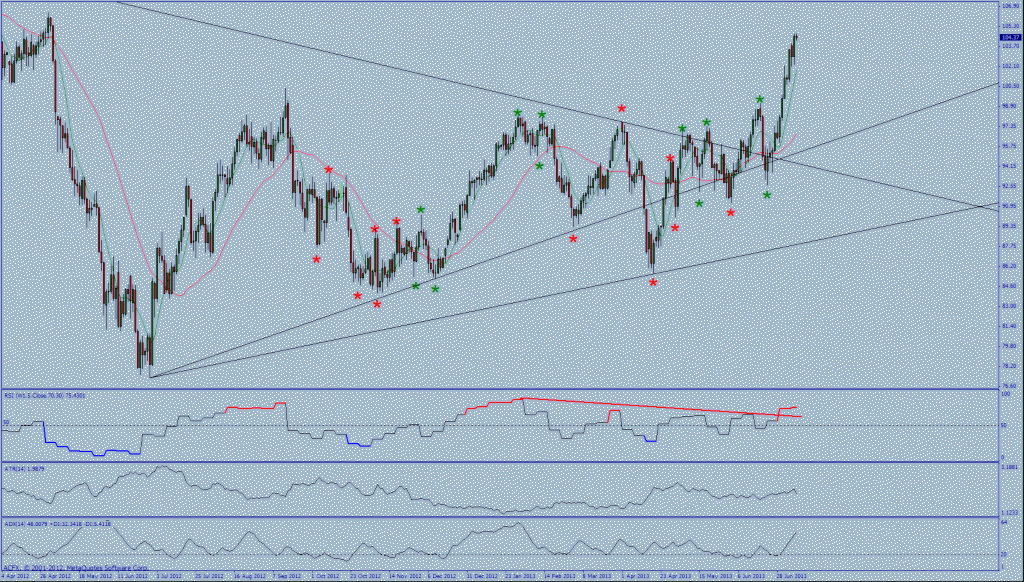
USDJPY is this morning trading up from the open after yesterdays up day. Today’s opening range is 113 pips which equates to 57% of the daily average true range.
USDJPY yesterday traded opened above the 8 period moving averages. We are monitoring approaches to the resistance at the Fibonacci level and 34 period moving averages.
In terms of the bigger picture the swing bias is negative.
The following factors are confirming or reinforcing this market bias:
1. The price action has managed to break below the upward sloping trend line.
2. The RSI is in gear with the move up.
3. The moving averages are layered negatively.
4. Fibonacci resistance may offer down side pressure.
Alternative counter trend bullish factors:
1. The weekly time remains with a positive bias.
2. The 8 period moving averages could offer support to further upside to the next resistance levels.
Scenario 1
As the dominant daily trend is down retracements into resistance could be viewed as selling opportunities
Scenario 2
Alternatively USDJPY the Fibonacci resistance area could act as potential magnet for further upside.
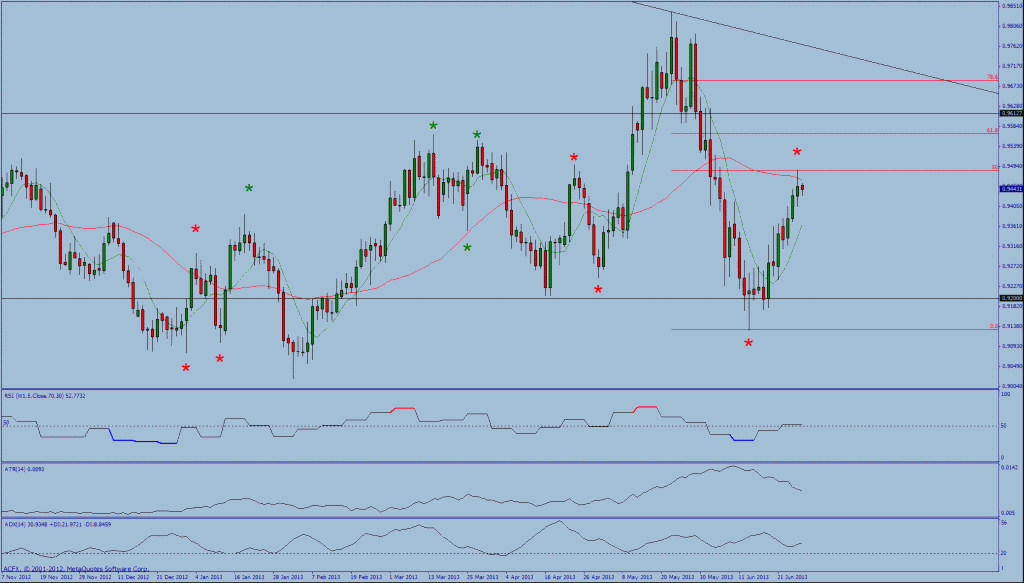
Daily Technical Analysis for USDCHF as at 20th June 2013
DAILY OVERVIEW
Trend : Short
Ambush Zone : -
Target 1 : -
Target 2 : -
Stop : -

Comments
USDCHF is this morning trading higher from the open after yesterdays up day. Today’s opening range is 66 pips which equates to 58% of the daily average true range.
USDCHF traded off the 0.9200 support level and has today opened above the 8 period moving averages.
In terms of the bigger picture the swing bias is negative.
The following factors are confirming or reinforcing this market bias:
1. The moving averages are negatively layered.
2. The RSI is in gear with the move.
Alternative counter trend bullish factors:
1. USDCHF is trading above the 8 period moving averages.
2. USDCHF is this morning holding at the 0.9200 level.
Scenario 1
As the dominant daily trend is down retracements to the 34 period moving averages and Fibonacci resistance could possibly offer selling opportunities.
Scenario 2
Alternatively if USDCHF could break above the 8 period moving averages there is a possibility of a broader correction in the direction of the 34 period moving averages.
Daily Technical Analysis for Gold as at 20th June 2013
DAILY OVERVIEW
Trend : Short
Ambush Zone : 1452.60 – 1525.85
Target 1 : 1321.75
Target 2 : 1308.08
Stop : 1590.20

Comments
Gold is this morning trading lower from the open after yesterdays down day. Today’s opening range is 295 pips which equates to 126% of the daily average true range
Gold this morning has broken down to the area just above of the low of 16th April. We are monitoring the possibility of further negativity.
In terms of the bigger picture the swing bias remains negative.
The following factors are confirming or reinforcing this market bias:
1. The moving averages are layered negatively.
2. The RSI is in gear with the price action.
3. The prior swing low has been breached.
4. The weekly bias has turned negative.
Alternative counter trend bullish factors:
1. There is still some distance between the current price and Fibonacci resistance which gives the price action some space to pull back further.
Scenario 1
As the dominant daily trend is down the retracement into the averages might possibly offer shorting opportunities at resistance.
Scenario 2
Alternatively there is a possibility that this current level holds to form a double bottom.
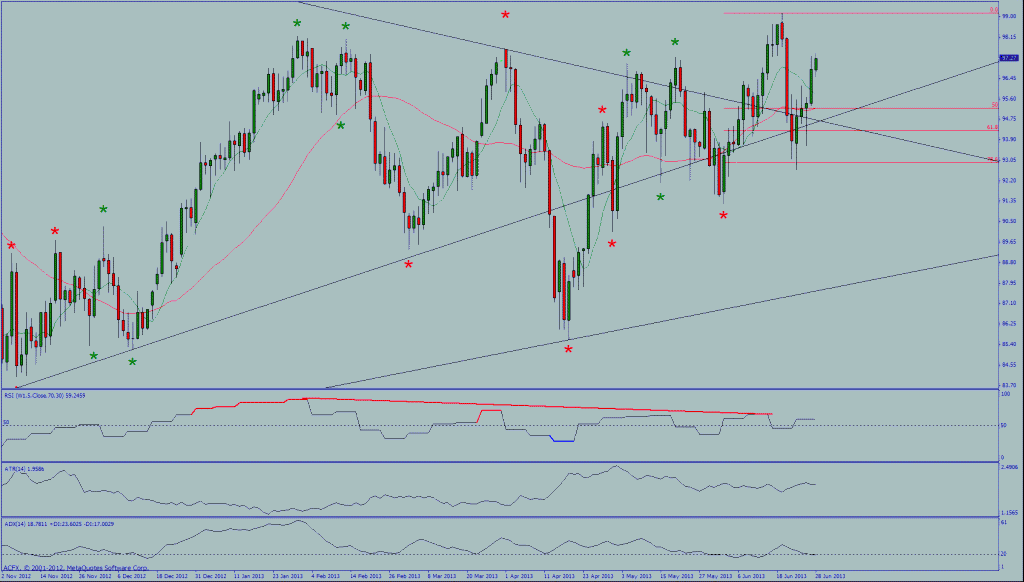
Daily Technical Analysis for Oil (WTI) as at 20th June 2013
DAILY OVERVIEW
Trend : Long
Ambush Zone : -
Target 1 : -
Target 2 : -
Stop : -

Comments
Oil is this morning trading lower from the open after yesterday’s strong down day. Today’s opening range is 159 pips which equates to 93% of the daily average true range.
The inverse Head and Shoulders pattern continues to be validated but yesterdays strong down day and the continued and accelerated bearishness this morning has pushed Oil beneath the 8 period moving averages. We are monitoring the price action to see if support can hold at this level. However there is a fairly large weekly negative RSI divergence that has been noted as a potential drag against continued upside and see the price action slide down to Fibonacci support
In terms of the bigger picture the swing bias remains negative.
The following factors are confirming or reinforcing this market bias:
1. From a bullish perspective the price action has retraced and bounced off Fibonacci support.
2. An inverse Head and Shoulders pattern has broken to the upside.
3. The price action is trading well above the large monthly converging triangle.
4. The averages are positively crossed.
Alternative counter trend bearish factors:
1. The price action is extended from the averages.
2. A large negative RSI divergence is forming.
Scenario 1
As the dominant daily trend has changed to positive corrective pullbacks to the averages could offer buying opportunities with potential targets the 100 % and 138.2% Fibonacci Expansion level in the areas of 99.00 and 103.00 respectively. However the psychological 100.00 level will need to be broken for any further upside to continue.
Scenario 2
Alternatively as the price extended from the averages the price action may need to trade down to sideways before the up move continues.
DAILY OVERVIEW
Trend : Long
Ambush Zone : -
Target 1 : -
Target 2 : -
Stop : -
Comments
EURUSD is this morning trading down from the open after yesterdays strong down day. Today’s opening range is 53 pips which equates to 52% of the daily average true range.
Yesterday EURUSD corrected to and broke through the 8 period moving averages. We are monitoring the price actions reaction as it approaches the 1.3250 to 1.3175 support range
In terms of the bigger picture the swing bias is positive.
The following factors are confirming or reinforcing this market bias:
1. The moving averages are layered positively.
2. The price action has managed to break above the downward sloping trend line.
3. The RSI is in gear with the move up.
4. The price action has breached the prior Swing High level 1.3250.
5. Both the daily and weekly time frames as positive and in gear.
6. A Head and Shoulders pattern failure on the Weekly time frame.
Alternative counter trend bearish factors:
1. The price action has rejected the Fibonacci resistance area.
2. The price action is trading beneath the 8 period moving averages.
Scenario 1
As the dominant daily trend is up retracements into support could be viewed as buying opportunities
Scenario 2
Alternatively one could possibly sell retracements at the 8 period moving averages with a view of trading down to Fibonacci support.
Daily Technical Analysis for GBPUSD as at 20th June 2013
DAILY OVERVIEW
Trend : Long
Ambush Zone : -
Target 1 : -
Target 2 : -
Stop : -
Comments
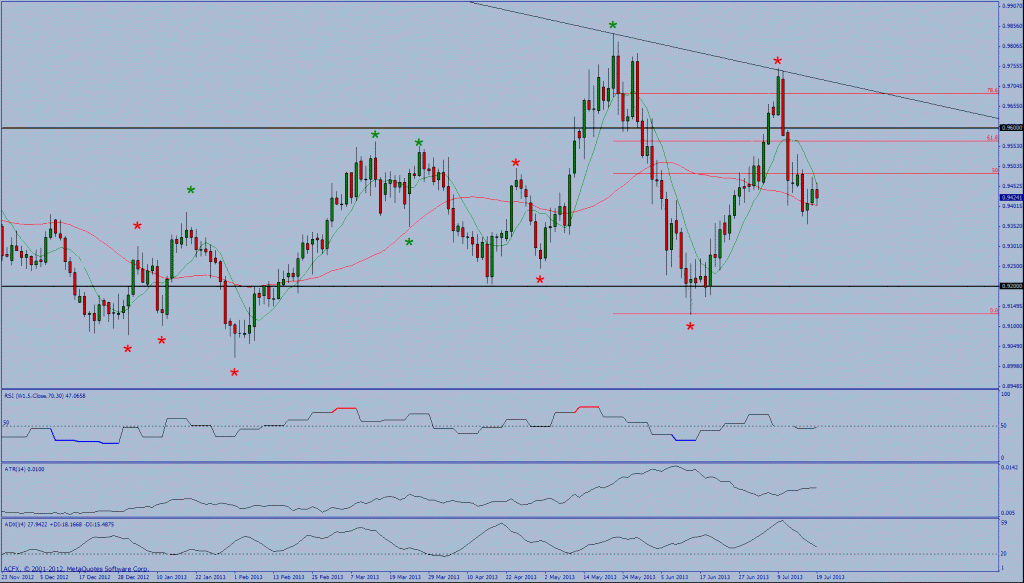
GBPUSD is this morning trading lower from the open after yesterdays strong down day. Today’s opening range is 68 pips which equates to a 53% of the daily average true range.
Yesterday GBPUSD continue it’s down move as it approaches the 34 period mobbing averages and Fibonacci support.
In terms of the bigger the swing bias remains positive.
The following factors are confirming or reinforcing this market bias:
1. The moving averages continue to be positively layered.
2. Both the daily and weekly time frames are positive and in gear.
3. The RSI is in gear with the move.
4. The price action has breached the prior Swing High level 1.5600.
Alternative counter trend bearish factors:
1. The price action has rejected the Fibonacci resistance area.
2. The price action is trading beneath the 8 period moving averages.
Scenario 1
As the dominant daily trend is up retracements into support could be viewed as buying opportunities
Scenario 2
Alternatively one could possibly sell retracements at the 8 period moving averages with a view of trading down to Fibonacci support.
Daily Technical Analysis for USDJPY as at 20th June 2013
DAILY OVERVIEW
Trend : Short
Ambush Zone : -
Target 1 : -
Target 2 : -
Stop : -
Comments
USDJPY is this morning trading up from the open after yesterdays up day. Today’s opening range is 113 pips which equates to 57% of the daily average true range.
USDJPY yesterday traded opened above the 8 period moving averages. We are monitoring approaches to the resistance at the Fibonacci level and 34 period moving averages.
In terms of the bigger picture the swing bias is negative.
The following factors are confirming or reinforcing this market bias:
1. The price action has managed to break below the upward sloping trend line.
2. The RSI is in gear with the move up.
3. The moving averages are layered negatively.
4. Fibonacci resistance may offer down side pressure.
Alternative counter trend bullish factors:
1. The weekly time remains with a positive bias.
2. The 8 period moving averages could offer support to further upside to the next resistance levels.
Scenario 1
As the dominant daily trend is down retracements into resistance could be viewed as selling opportunities
Scenario 2
Alternatively USDJPY the Fibonacci resistance area could act as potential magnet for further upside.
Daily Technical Analysis for USDCHF as at 20th June 2013
DAILY OVERVIEW
Trend : Short
Ambush Zone : -
Target 1 : -
Target 2 : -
Stop : -
Comments
USDCHF is this morning trading higher from the open after yesterdays up day. Today’s opening range is 66 pips which equates to 58% of the daily average true range.
USDCHF traded off the 0.9200 support level and has today opened above the 8 period moving averages.
In terms of the bigger picture the swing bias is negative.
The following factors are confirming or reinforcing this market bias:
1. The moving averages are negatively layered.
2. The RSI is in gear with the move.
Alternative counter trend bullish factors:
1. USDCHF is trading above the 8 period moving averages.
2. USDCHF is this morning holding at the 0.9200 level.
Scenario 1
As the dominant daily trend is down retracements to the 34 period moving averages and Fibonacci resistance could possibly offer selling opportunities.
Scenario 2
Alternatively if USDCHF could break above the 8 period moving averages there is a possibility of a broader correction in the direction of the 34 period moving averages.
Daily Technical Analysis for Gold as at 20th June 2013
DAILY OVERVIEW
Trend : Short
Ambush Zone : 1452.60 – 1525.85
Target 1 : 1321.75
Target 2 : 1308.08
Stop : 1590.20
Comments
Gold is this morning trading lower from the open after yesterdays down day. Today’s opening range is 295 pips which equates to 126% of the daily average true range
Gold this morning has broken down to the area just above of the low of 16th April. We are monitoring the possibility of further negativity.
In terms of the bigger picture the swing bias remains negative.
The following factors are confirming or reinforcing this market bias:
1. The moving averages are layered negatively.
2. The RSI is in gear with the price action.
3. The prior swing low has been breached.
4. The weekly bias has turned negative.
Alternative counter trend bullish factors:
1. There is still some distance between the current price and Fibonacci resistance which gives the price action some space to pull back further.
Scenario 1
As the dominant daily trend is down the retracement into the averages might possibly offer shorting opportunities at resistance.
Scenario 2
Alternatively there is a possibility that this current level holds to form a double bottom.
Daily Technical Analysis for Oil (WTI) as at 20th June 2013
DAILY OVERVIEW
Trend : Long
Ambush Zone : -
Target 1 : -
Target 2 : -
Stop : -
Comments
Oil is this morning trading lower from the open after yesterday’s strong down day. Today’s opening range is 159 pips which equates to 93% of the daily average true range.
The inverse Head and Shoulders pattern continues to be validated but yesterdays strong down day and the continued and accelerated bearishness this morning has pushed Oil beneath the 8 period moving averages. We are monitoring the price action to see if support can hold at this level. However there is a fairly large weekly negative RSI divergence that has been noted as a potential drag against continued upside and see the price action slide down to Fibonacci support
In terms of the bigger picture the swing bias remains negative.
The following factors are confirming or reinforcing this market bias:
1. From a bullish perspective the price action has retraced and bounced off Fibonacci support.
2. An inverse Head and Shoulders pattern has broken to the upside.
3. The price action is trading well above the large monthly converging triangle.
4. The averages are positively crossed.
Alternative counter trend bearish factors:
1. The price action is extended from the averages.
2. A large negative RSI divergence is forming.
Scenario 1
As the dominant daily trend has changed to positive corrective pullbacks to the averages could offer buying opportunities with potential targets the 100 % and 138.2% Fibonacci Expansion level in the areas of 99.00 and 103.00 respectively. However the psychological 100.00 level will need to be broken for any further upside to continue.
Scenario 2
Alternatively as the price extended from the averages the price action may need to trade down to sideways before the up move continues.