ETHUSD and LTCUSD Technical Analysis – 17th MAR, 2022

ETHUSD: Bullish Engulfing Pattern Above $2,400
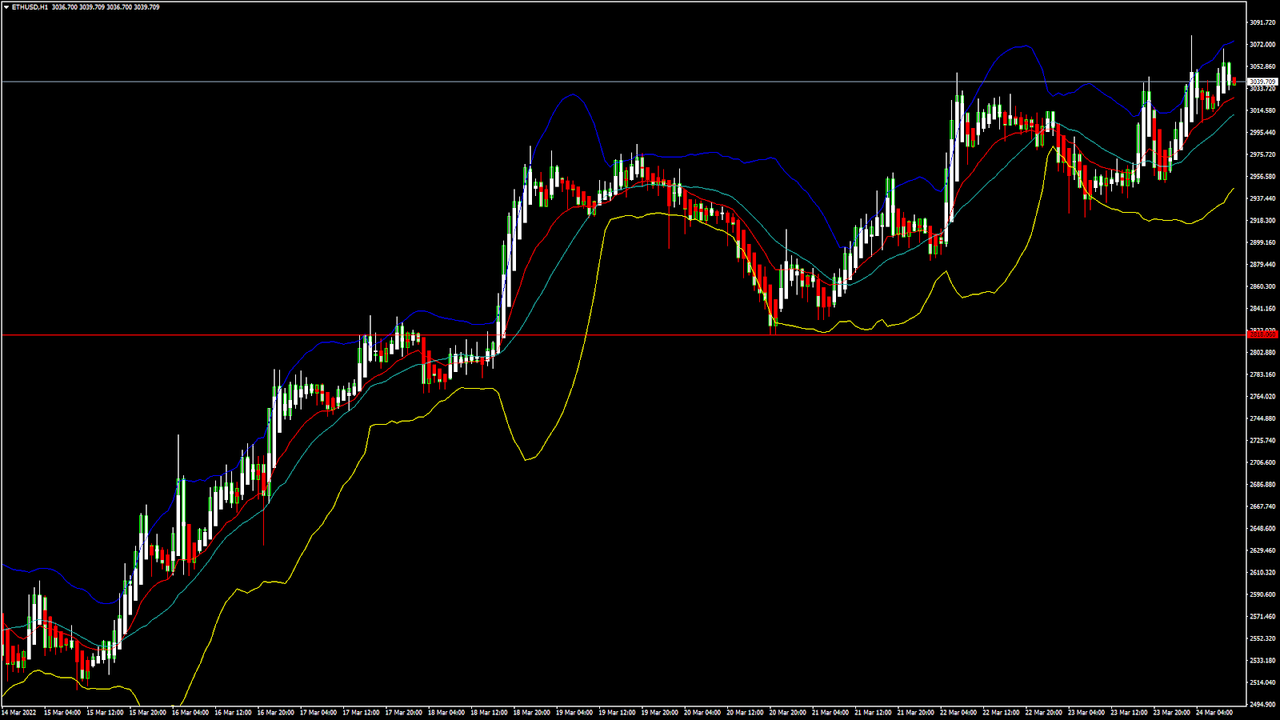
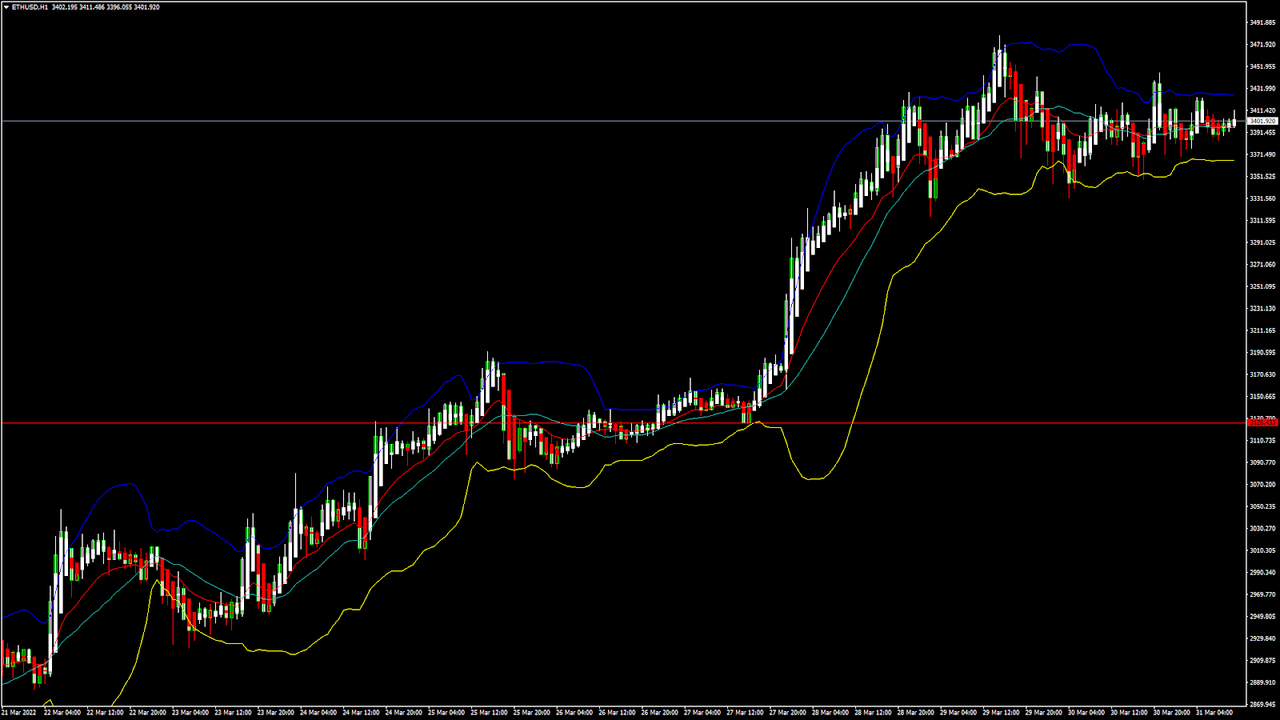
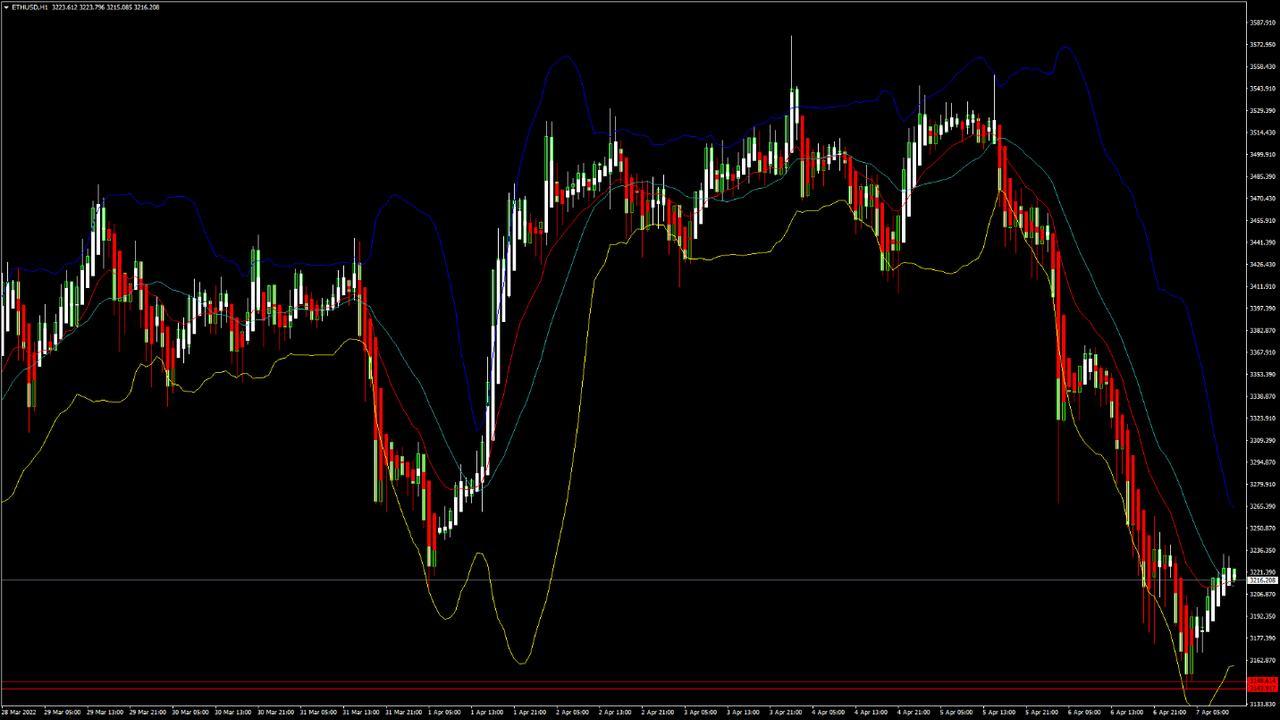
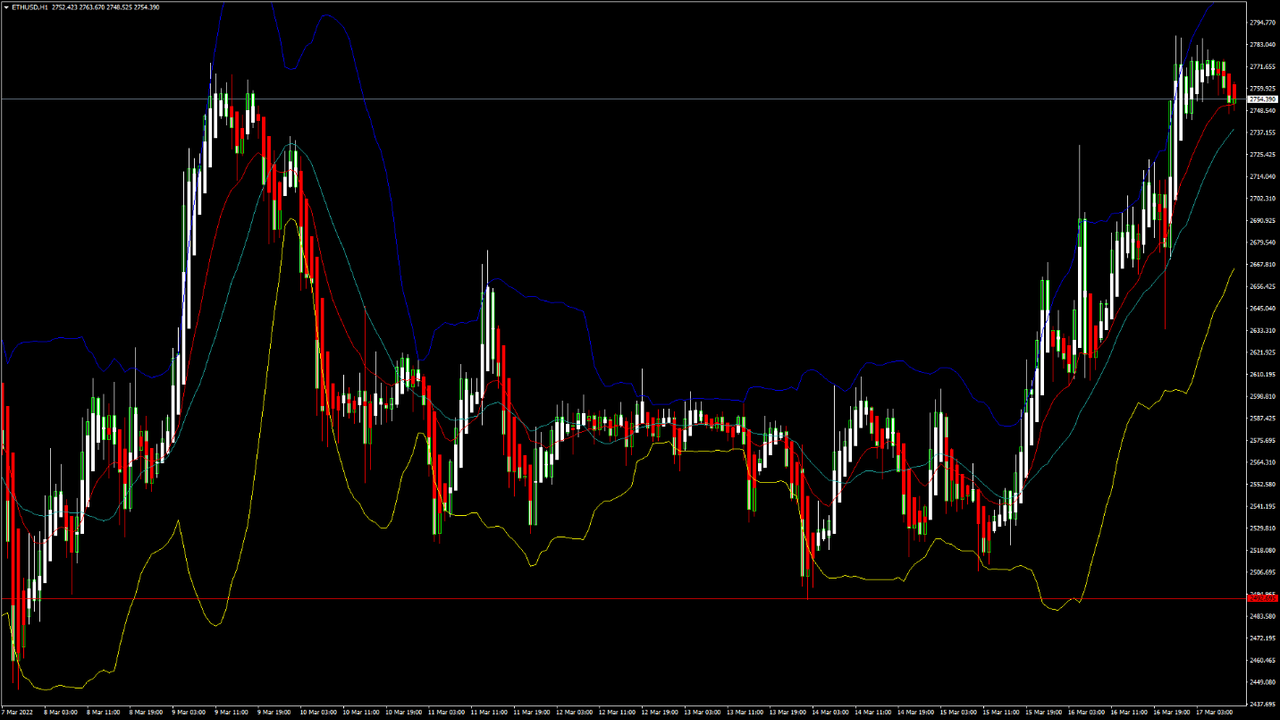
Ethereum ended its bearish phase after touching a low of $2,498 on March 14 and moved into a consolidation channel.
On March 15, ETHUSD entered into a bullish phase which pushed its prices above the $2,700 handle in today’s European trading session.
We can clearly see a bullish engulfing pattern above the $2,400 handle which signifies the end of a bearish phase and the start of a bullish phase in the markets.
ETH is now trading just below its pivot level of $2,755 and moving in a bullish channel. The price of ETHUSD is now testing its classic resistance level of $2,763 and Fibonacci resistance level of $2,773, after which the path towards $2,900 will get cleared.
The relative strength index is at 59 indicating a STRONG demand for Ethereum and the continuation of the buying pressure in the markets.
All of the technical indicators are giving a STRONG BUY market signal.
All of the MAs are giving a BUY signal, and we are now looking at the level of $2,800 to $2,900 in the short-term range.
ETH is now trading above both the 100 Hourly and 200 Hourly SMAs.
Ether: Bullish Reversal Seen Above $2,400
ETHUSD has gained a strong bullish momentum with the prices trading above the $2,700 handle in the European trading session today.
The StochRSI is indicating an OVERSOLD market, which means that a pullback in the levels of Ethereum can be expected soon.
Ethereum is now moving in a bullish continuation pattern, meaning further appreciation in the prices of ETHUSD.
ETHUSD is now facing its immediate resistance level of $2,775, after which we will see a linear progression towards $2,900.
The key support level to watch is $2,300, and this week’s key resistance level is $2,900.
ETH has gained 4.11% with a price change of 108.62$ in the past 24hrs and has a trading volume of 15.881 billion USD.
We can see a 5.84% increase in the total trading volume in the last 24 hrs. which appears to be normal.
The Week Ahead
Ethereum has entered a consolidation channel above the $2,400 handle and is now moving in a bullish momentum towards $3,000.
For the first time in 3 years, the US Federal Reserve hiked its interest rate by 0.25% which has weakened the US dollar and sparked a rally in some crypto currencies, including Ethereum, which had been weighed down by the Russia-Ukraine war.
The immediate short-term outlook for Ether has turned strongly BULLISH, the medium-term outlook has turned bullish, and the long-term outlook for Ether is NEUTRAL in present market conditions.
This week, Ether is expected to move in a range between $2,500 and $2,900, and to enter a consolidation phase above $2,900 next week.
Technical Indicators:
The moving averages convergence divergence (12,26): at 30.92 indicating a BUY
The ultimate oscillator: at 52.02 indicating a BUY
The rate of price change: at 1.712 indicating a BUY
The Williams percent range: at -25.91 indicating a BUY
Read Full on FXOpen Company Blog...
ETHUSD: Bullish Engulfing Pattern Above $2,400
Ethereum ended its bearish phase after touching a low of $2,498 on March 14 and moved into a consolidation channel.
On March 15, ETHUSD entered into a bullish phase which pushed its prices above the $2,700 handle in today’s European trading session.
We can clearly see a bullish engulfing pattern above the $2,400 handle which signifies the end of a bearish phase and the start of a bullish phase in the markets.
ETH is now trading just below its pivot level of $2,755 and moving in a bullish channel. The price of ETHUSD is now testing its classic resistance level of $2,763 and Fibonacci resistance level of $2,773, after which the path towards $2,900 will get cleared.
The relative strength index is at 59 indicating a STRONG demand for Ethereum and the continuation of the buying pressure in the markets.
All of the technical indicators are giving a STRONG BUY market signal.
All of the MAs are giving a BUY signal, and we are now looking at the level of $2,800 to $2,900 in the short-term range.
ETH is now trading above both the 100 Hourly and 200 Hourly SMAs.
- A bullish reversal is seen in ETH above the $2,400 mark
- The short-term range appears to be strongly BULLISH
- The daily RSI is above 50 at 52, indicating a NEUTRAL market
- The average true range is indicating LESSER market volatility
Ether: Bullish Reversal Seen Above $2,400
ETHUSD has gained a strong bullish momentum with the prices trading above the $2,700 handle in the European trading session today.
The StochRSI is indicating an OVERSOLD market, which means that a pullback in the levels of Ethereum can be expected soon.
Ethereum is now moving in a bullish continuation pattern, meaning further appreciation in the prices of ETHUSD.
ETHUSD is now facing its immediate resistance level of $2,775, after which we will see a linear progression towards $2,900.
The key support level to watch is $2,300, and this week’s key resistance level is $2,900.
ETH has gained 4.11% with a price change of 108.62$ in the past 24hrs and has a trading volume of 15.881 billion USD.
We can see a 5.84% increase in the total trading volume in the last 24 hrs. which appears to be normal.
The Week Ahead
Ethereum has entered a consolidation channel above the $2,400 handle and is now moving in a bullish momentum towards $3,000.
For the first time in 3 years, the US Federal Reserve hiked its interest rate by 0.25% which has weakened the US dollar and sparked a rally in some crypto currencies, including Ethereum, which had been weighed down by the Russia-Ukraine war.
The immediate short-term outlook for Ether has turned strongly BULLISH, the medium-term outlook has turned bullish, and the long-term outlook for Ether is NEUTRAL in present market conditions.
This week, Ether is expected to move in a range between $2,500 and $2,900, and to enter a consolidation phase above $2,900 next week.
Technical Indicators:
The moving averages convergence divergence (12,26): at 30.92 indicating a BUY
The ultimate oscillator: at 52.02 indicating a BUY
The rate of price change: at 1.712 indicating a BUY
The Williams percent range: at -25.91 indicating a BUY
Read Full on FXOpen Company Blog...