• The Forex, Binary Options Forum - welcomes you to our Community!

    DigitalCashPalace Forum is dedicated to discussions about Forex, Binary Options, commodities, stocks related.

    Please take a look around, and feel free to .

Daily Market Analysis By FXOpen

BTCUSD and XRPUSD Technical Analysis – 12th APR 2022
bitcoin.jpg


BTCUSD: Double Bottom Pattern Above $39,000

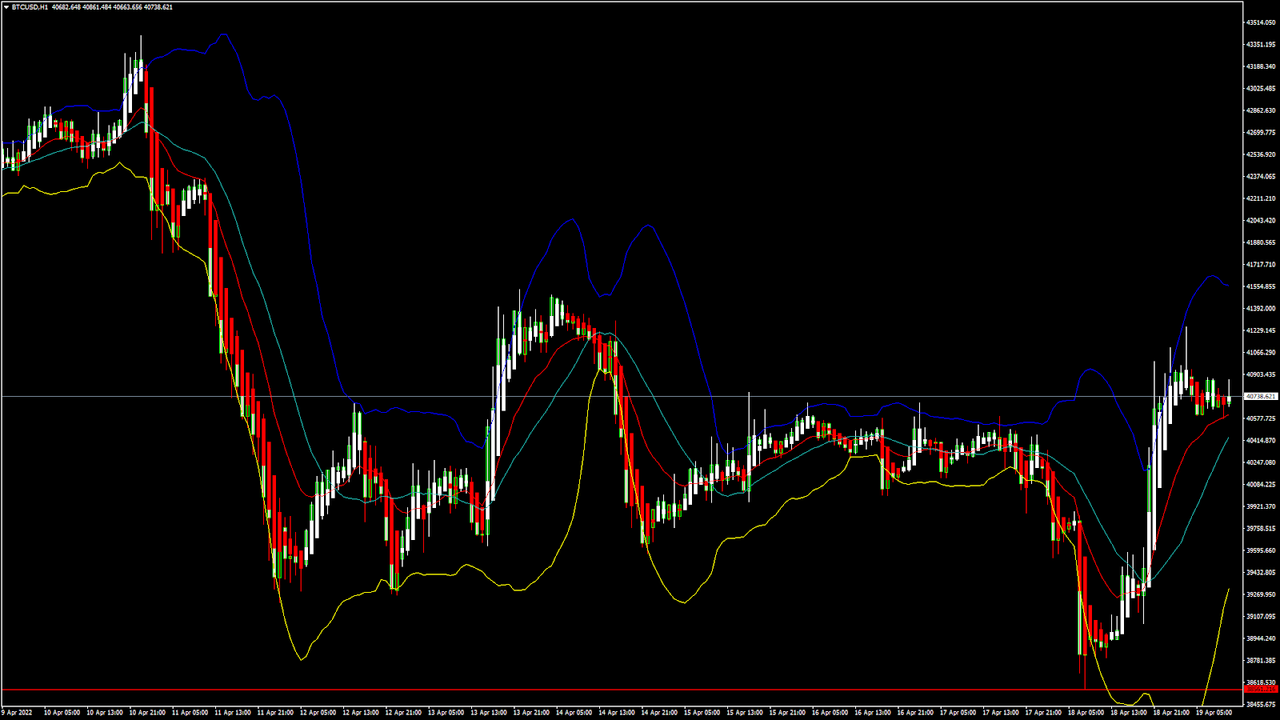
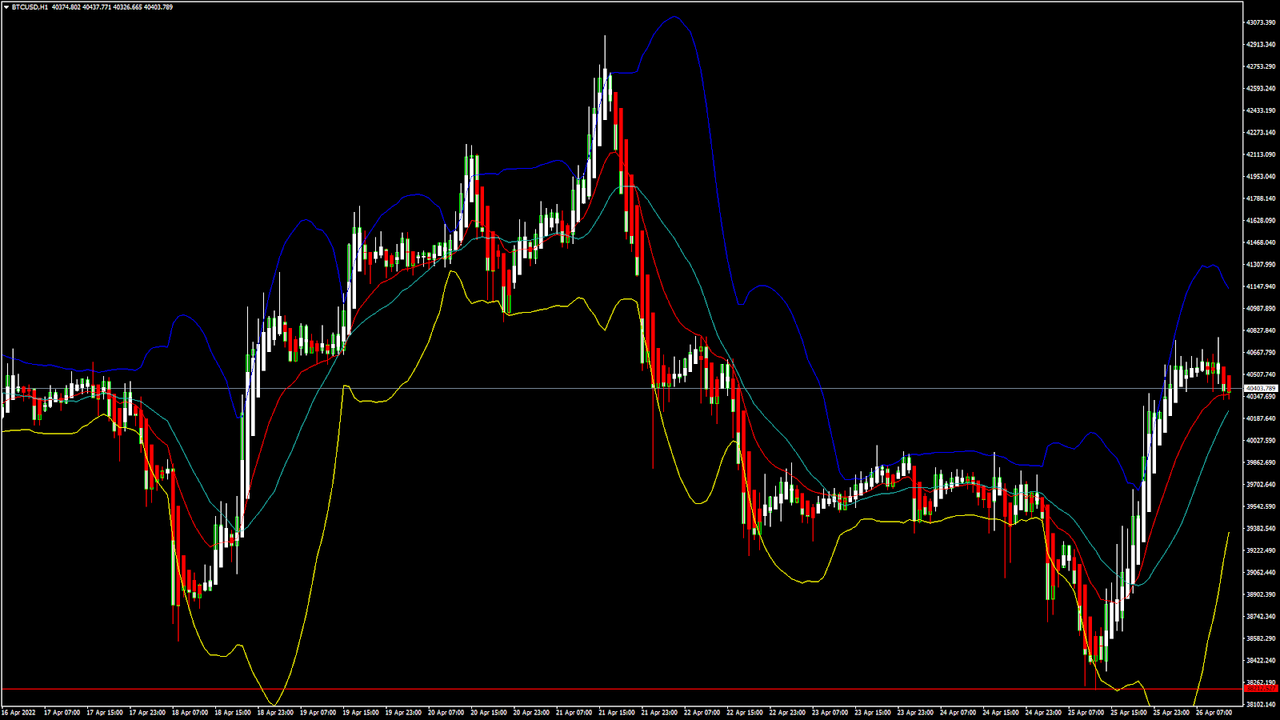
Bitcoin was unable to continue its last week’s bullish momentum and started to decline after touching a high of $47,184 on April 5th.

Bitcoin broke the $40,000 support and touched a low of $36,210 in today’s Asian trading session.

The selloff continues across the crypto markets, and the global investor sentiments are low due to the continuation of the Russia-Ukraine war and its emerging impacts on the prices of energy and stock markets.

After falling below the $40,000 handle, bitcoin found support and has entered a mildly bullish channel in today’s European trading session.

We can clearly see a double bottom pattern above the $39,000 handle which is a bullish reversal pattern because it signifies the end of a downtrend and a shift towards an uptrend.

The Stoch and the Williams percent range are indicating an overbought level which means that in the immediate short term, a decline in the prices is expected.

The relative strength index is at 43 indicating a WEAK demand for bitcoin at the current market levels.

Bitcoin is now moving below its 100 hourly simple moving average and its 200 hourly exponential moving average.

Most of the major technical indicators are giving a BUY signal, which means that in the immediate short term, we are expecting targets of $41,000 and $43,000.

The average true range is indicating LESSER market volatility with a mild bullish momentum.

  • Bullish reversal seen in bitcoin above $39,000
  • The StochRSI is indicating an OVERSOLD level
  • The price is now trading just above its pivot level of $40,236
  • Some of the moving averages are giving a BUY market signal

Bitcoin: Bullish Reversal Seen Above $39,000
btcx.png


Bitcoin continues to move in a mildly bullish momentum with an upwards projection towards the level of $41,000 in the European trading session today.

In the immediate term, we are expecting a continuation of this bullish trend with the price of bitcoin ranging between the levels of $42,000 and $44,000 as it has entered into a consolidation phase now.

The drop in the level of BTCUSD that we saw last week was due to the profit-taking by the short-term investors.

The immediate short-term outlook for bitcoin is mildly bullish; the medium-term outlook is neutral; and the long-term outlook remains neutral under present market conditions.

The price of BTCUSD is now facing its classic resistance level of $40,336 and Fibonacci resistance level of $40,454, after which the path towards $41,000 will get cleared.

We can see that the daily RSI is below 50 printing at 38 which indicates that in the medium-term prices are expected to decline further.

In the last 24hrs, BTCUSD has gone down by 3.17% with a price change of -$1319, and has a 24hr trading volume of USD 36.665 billion. We can see an Increase of 60.52% in the trading volume as compared to yesterday, which is due to the selling by the long-term Investors.

The Week Ahead

The price of bitcoin is now moving in a consolidation phase above the level of $40,000. We can see some range-bounded movements between $41,000 and $43,000.

If the prices of bitcoin continue to remain above the important psychological support level of $40,000, next week, we may see some correction in the midrange upwards towards the $42,000 handle.

In the immediate short term, bitcoin’s mildly bullish momentum is expected to continue pushing to above the $41,000 handle this week.

The price of BTCUSD will need to remain above the important support level of $40,000 this week.

The weekly outlook is projected at $42,000 with a consolidation zone of $41,500.

BTC Market Cap
btccap.png


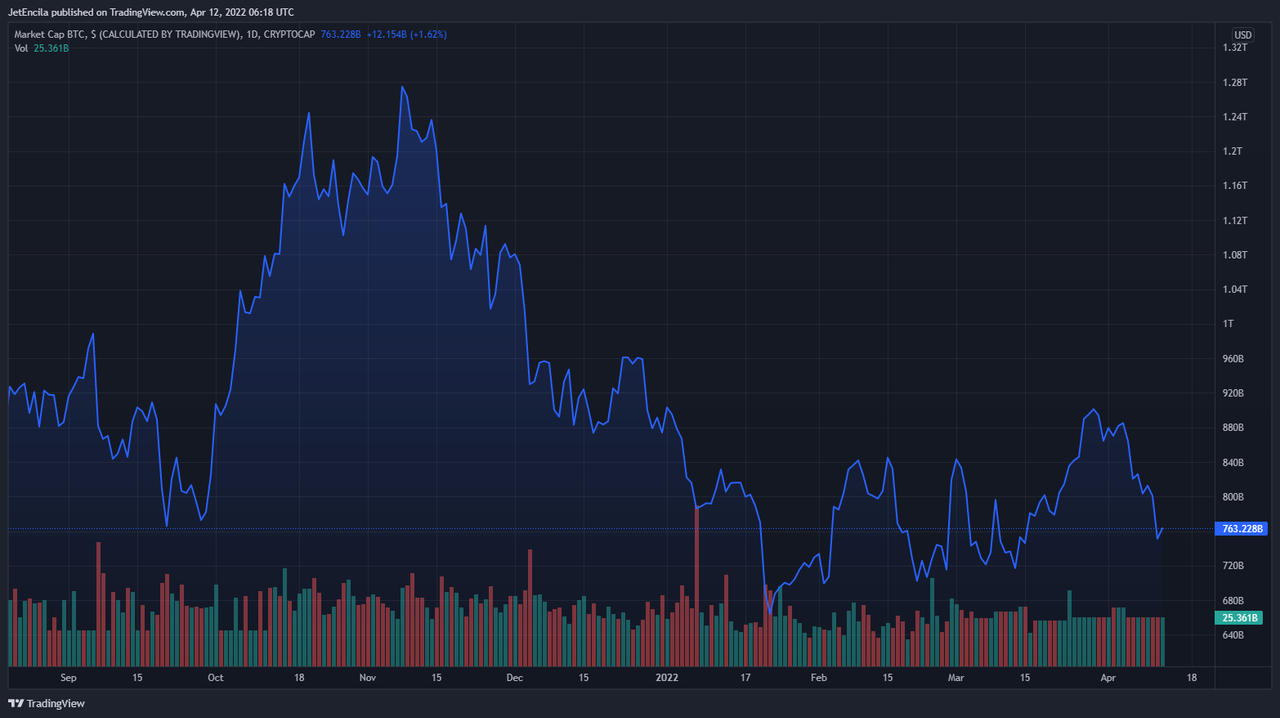
Due to the weak global investor sentiments coupled with the ongoing Russia-Ukraine war and the rising inflation, the BTC market cap has fallen down below $800 billion.

The present total market capitalization of bitcoin stands at $764 billion.

Technical Indicators:

The average directional change (14-day): at 44.90 indicating a BUY

The ultimate oscillator: at 62.26 indicating a BUY

Bull/Bear power (13-day): at 227.32 indicating a BUY

The rate of price change: at 0.88 indicating a BUY


Read Full on FXOpen Company Blog...
 
EUR/USD Remains At Risk While EUR/JPY Eye More Gains
Euro-EURUSD-1.jpg


EUR/USD started a fresh decline from the 1.0940 resistance. EUR/JPY could gain pace if it clears the 136.30 resistance zone.

Important Takeaways for EUR/USD and EUR/JPY


  • The Euro failed to clear the 1.0940 resistance and started a fresh decline.
  • It broke a key contracting triangle with support near 1.0880 on the hourly chart.
  • EUR/JPY gained bullish momentum after it broke the 135.50 resistance zone.
  • Recently, there was a break below a major bullish trend line with support near 136.50 on the hourly chart.

EUR/USD Technical Analysis

The Euro made a couple of attempts to clear the 1.0940 resistance zone against the US Dollar. However, the EUR/JPY pair failed to gain strength above 1.0940 and started a fresh decline.

The pair declined below the 1.0900 support and the 50 hourly simple moving average. There was also a break below a key contracting triangle with support near 1.0880 on the hourly chart. The pair even moved below the 1.0840 support level.

EUR/USD Hourly Chart
EURUSD-Chart-1.jpg


A low is formed near 1.0811 on FXOpen and the pair is now consolidating losses. It corrected above the 23.6% Fib retracement level of the recent decline from the 1.0903 high to 1.0811 low.

On the upside, the pair is facing resistance near the 1.0850 level. It is near the 50% Fib retracement level of the recent decline from the 1.0903 high to 1.0811 low. The next major resistance is near the 1.0865 level and the 50 hourly simple moving average.

A clear break above the 1.0865 resistance could push EUR/USD towards 1.0900. If the bulls remain in action, the pair could rise revisit the 1.0940 resistance zone in the near term.

On the downside, the pair might find support near the 1.0820 level. If there is a downside break below the 1.0820 support, the pair might accelerate lower. The next major support sits near the 1.0765 level, below which there is a risk of a larger decline.


Read Full on FXOpen Company Blog...
 
ETHUSD and LTCUSD Technical Analysis – 14th APR, 2022
etx.jpg


ETHUSD: Double Bottom Pattern Above $2,900

Ethereum failed to continue its bullish momentum last week, and started to decline after touching a high of 3,299 on April 8th.

It touched an intraday low of 3,093 in the Asian trading session, and an intraday high of 3,142 in today’s European trading session.

We can clearly see a double bottom pattern above the $2,900 handle which is a bullish pattern and signifies the end of a bearish phase and the start of a bullish phase in the markets.

ETH is now trading just above its pivot level of 3,111 and moving in a mildly bullish channel. The price of ETHUSD is now testing its classic resistance level of 3,120 and Fibonacci resistance level of 3,128, after which the path towards 3,200 will get cleared.

The relative strength index is at 59 indicating a STRONG demand for Ethereum and the continuation of the bullish trend.

Both the average directional change and commodity channel index are indicating a neutral level which means that the prices are due to enter into a consolidation phase.

Most of the technical indicators are giving a STRONG BUY market signal.

Most of the moving averages are giving a STRONG BUY signal, and we are now looking at the levels of $3,300 to $3,350 in the short-term range.

ETH is now trading below both the 100 hourly and exponential moving averages.

  • Bullish reversal seen in Ether above the $2,900 mark
  • The short-term range appears to be mildly BULLISH
  • The daily RSI is below 50 at 48 indicating a NEUTRAL market
  • The average true range is indicating LESSER market volatility

Ether: Bullish Reversal Seen Above $2,900
eth.png


ETHUSD is now moving in a mildly bullish channel with the price trading above the $3,100 handle in the European trading session today.

Ethereum is now slowly preparing for its next move against the US dollar. We can see the formation of a contraction triangle pattern, which shows price building energy, and we can see the A-C and B-D trendlines.

ETHUSD is now facing its immediate resistance levels of $3,128 and $3,300, after which we will see a linear progression towards the level of $3,400.

The key support levels to watch are $2,906 and $3,034, and the prices of ETHUSD need to remain above these levels for the bullish trend to continue.

ETH has gained 2.05% with a price change of $62.64 in the past 24hrs and has a trading volume of 15.476 billion USD.

We can see a decrease of 19.10% in the total trading volume in the last 24 hrs, which appears to be normal.

The Week Ahead

Last week, we saw Ethereum decline from its highs of 3,299 to the lows of 2,951, but now we can see that the prices have entered a consolidation phase above the level of 3,000.

If the price of ETHUSD remains above $3,000, we may see a linear progression towards the levels of $3,200 and $3,350 this week.

The immediate short-term outlook for Ether has turned mildly BULLISH; the medium-term outlook has turned neutral; and the long-term outlook for Ether is NEUTRAL in present market conditions.

This week, Ether is expected to move in a range between $3,100 and $3,300, and next week, it is expected to enter a consolidation phase above $3,300.

Technical Indicators:

The Williams percent range: at -44.92 indicating a BUY

The moving averages convergence divergence (12,26): at 15.85 indicating a BUY

The rate of price change: at 0.332 indicating a BUY

Bull/Bear power (13-day): at 16.23 indicating a BUY


Read Full on FXOpen Company Blog...
 
Gold Price and Oil Price Could Extend Gains
Gold-price-oil-price-2-1.jpg


Gold price started a fresh increase above the $1,960 resistance. Crude oil price is also rising and might climb further above the $107.

Important Takeaways for Gold and Oil


  • Gold price started a fresh increase above $1,930 and $1,950 against the US Dollar.
  • There is a key bullish trend line forming with support near $1,968 on the hourly chart of gold.
  • Crude oil price gained pace after it broke the $100 and $102 resistance levels.
  • There is a key bullish trend line forming with support near $103.20 on the hourly chart of XTI/USD.

Gold Price Technical Analysis

Gold price formed a support base near $1,910 and started a fresh increase against the US Dollar. The price gained pace for a move above the $1,925 level to move into a positive zone.

There was a clear move above the $1,960 level and the 50 hourly simple moving average. The price even climbed above the $1,975 resistance level. However, it faced resistance near the $1,980 and $1,982 levels.

Gold Price Hourly Chart
Gold-Price-Chart-1.jpg


A high is formed near $1,981 on FXOpen and the price is now consolidating gains. There was a minor decline below $1,970, but the bulls were active near $1,960.

The price recovered and climbed above the 50% Fib retracement level of the downward move from the $1,981 swing high to $1,960 low. The price is now trading well above $1,960 and the 50 hourly simple moving average.

On the upside, the price is facing resistance near the $1,975 level. The main resistance is now forming near the $1,980 level. A close above the $1,980 level could open the doors for a steady increase towards $1,990. The next major resistance sits near the $2,000 level.

On the downside, an initial support is near the $1,970 level. There is also a key bullish trend line forming with support near $1,968 on the hourly chart of gold.

The next major support is near the $1,960 level, below which there is a risk of a larger decline and the price might even struggle to stay above $1,950.


Daily Market Analysis By FXOpen
 
GBP/USD Edge Lower While EUR/GBP Could Surge
GBP-1.jpg


GBP/USD started a fresh decline from well above the 1.3120 level. EUR/GBP is rising and might attempt an upside break above the 0.8300 resistance zone.

Important Takeaways for GBP/USD and EUR/GBP


  • The British Pound started a fresh decline from well above 1.3120 against the US Dollar.
  • There was a break below a key contracting triangle with support near 1.3060 on the hourly chart of GBP/USD.
  • EUR/GBP formed a base above 0.8250 and is currently rising.
  • There is a major bearish trend line forming with resistance near 0.8290 on the hourly chart.

GBP/USD Technical Analysis

The British Pound struggled to settle above the 1.3120 resistance zone against the US Dollar. The GBP/USD pair started a fresh decline below the 1.3080 support zone.

There was a clear move below the 1.3050 level and the 50 hourly simple moving average. The bears pushed the pair below the 50% Fib retracement level of the upward move from the 1.2972 swing low to 1.3146 high.

GBP/USD Hourly Chart
GBPUSD-Chart-2.jpg


Besides, there was a break below a key contracting triangle with support near 1.3060 on the hourly chart of GBP/USD.

The pair is now trading near 1.3020. The next major support sits near the 1.3110 level. It is near the 76.4% Fib retracement level of the upward move from the 1.2972 swing low to 1.3146 high. Any more losses could lead the pair towards the 1.2975 support zone or even 1.2950.

On the upside, an initial resistance is near the 1.3040 level. The next main resistance is near the 1.3070 zone and the 50 hourly simple moving average. A clear upside break above the 1.3070 and 1.3100 resistance levels could open the doors for a steady increase in the near term.


Read Full on FXOpen Company Blog...
 
US Dollar Strengthened Ahead of the Federal Reserve’s May Meeting
dcx.jpg


The main event of the Easter week was the European Central Bank (ECB) meeting that ended last Thursday. The central bank left the monetary policy unchanged and even though it sounded more hawkish than expected, the euro lost ground against the US dollar.

The ECB announced that it would end its asset purchases in the third quarter of this year but acknowledged that the ECB and the Fed are on different paths in their policy normalization plans.

While the ECB may deliver one or two rate hikes this year, the Fed already hiked once. Moreover, many voices inside the FOMC Committee favor a 50bp rate hike in May, thus widening the gap between the interest rates on the two sides of the Atlantic.

Since COVID-19 started two years ago, many have been shocked by the Fed’s and other central banks’ responses to the pandemic. Monetary and fiscal policies expansion have led to excessive inflation, hurting savings and driving investors into inflation-protecting assets.

Some bought cryptocurrencies such as Bitcoin and Ethereum in the hope that they will keep their value intact. Some other ones bought gold, the traditional hedge against inflation.

But the one currency that did appreciate was the US dollar. With all the doom and gloom over the years, the US dollar remains the de-facto world’s reserve currency.

12.jpg


The greenback has no rival, as almost 60% of the world’s reserves are in dollars. The euro comes in a distant second place, while the Japanese yen is in third place.

This is an important statistic ahead of the Fed’s May meeting. The three central banks (the Fed, the ECB, and the Bank of Japan) have different and divergent monetary policies.

As mentioned earlier, the Fed started to tighten the monetary policy. Excessive inflation will push the Fed to hike at every meeting in 2022 and, most likely, more than 25bp.

Moreover, the Fed has begun the process of shrinking its balance sheet. Quantitative tightening is the opposite of quantitative easing, thus contributing to even tighter financial conditions.

The ECB, as argued above, is nowhere near the Fed in terms of policy normalization. While inflation in Europe is above the ECB’s target, the war in Ukraine prevents the central bank from raising rates too fast.

As for the Bank of Japan is involved in a yield curve control process that led to one of the fastest depreciation on record for the Japanese yen.

Therefore, the central banks of the three top currencies in which reserves are kept have divergent policies. They all favor a stronger dollar ahead of the Fed’s May meeting and beyond.


FXOpen Blog
 
BTCUSD and XRPUSD Technical Analysis – 19th APR 2022
bitcoin.jpg


BTCUSD – Bullish Engulfing Pattern Above $38500

Bitcoin was not able to sustain its bullish momentum last week and after touching a high of 41491 on 14th April, started to decline against the US Dollar.

The bearish momentum in Bitcoin continues, which managed to push down its prices below the $39000 handle this week.

After forming a Bearish Triangulation pattern, the prices started to enter into a consolidation phase and staged a recovery above the $38500 handle in the European Trading session today.

We can see a Bullish Engulfing Pattern above the $38500 handle, which is a Bullish reversal pattern because it signifies the end of a Downtrend and a shift towards an Uptrend.

STOCH and Williams Percent Range are indicating Overbought levels which means that in the immediate short term, a decline in the prices is expected.

The relative Strength Index is at 62 indicating a STRONG demand for Bitcoin at the current market levels.

Bitcoin is now moving above its 100 hourly Simple Moving average and its 200 hourly Exponential Moving averages.

Most of the Major Technical Indicators are giving a BUY Signal, which means that in the immediate short term we are expecting targets of 42000 and 43500.

Average True Range is indicating LESS Market Volatility with a Strong Bullish momentum.

  • Bitcoin Bullish Reversal is seen Above $38500.
  • StochRSI is indicating OVERSOLD Levels.
  • The price is now trading just Above its Pivot Levels of $40695.
  • All of the Moving Averages are giving a BUY market signal.

Bitcoin Bullish Reversal is Seen Above $38500
btcx.png


Bitcoin has moved out of the falling trend seen in the last week and now continues to consolidate its gains above the $40000 handle in the European Trading session.

The recent decline in the prices of Bitcoin was due to the weak global investor sentiment which pushed down the prices of all Cryptocurrencies.

When Bitcoin recovers from its losses and trades above the important psychological support levels of $40000 new investors are also willing to enter the markets.

Some short selling is expected at the levels of 40702 and 40741 as indicated by the MA5 and MA10 crossover patterns.

The immediate short-term outlook for Bitcoin is Strong Bullish, the Medium-term outlook has turned Bullish, and the long-term outlook remains Neutral under present market conditions.

The price of BTCUSD is now facing its Classic resistance levels of 40852 and Fibonacci resistance levels of 40967 after which the path towards 42000 will get cleared.

In the last 24hrs, BTCUSD is UP by 4.45% by 1732$ and has a 24hr trading volume of USD 31.487 Billion. We can see an increase of 24.43% in the Trading volume as compared to yesterday, which is due to the buying seen by the medium-term Investors.

The Week Ahead

The prices of Bitcoin touched an Intraday High of $41252 after which we can see some correction below the $41000 handle.

We can see the formation of the Demand zone above the $38500 and the continuation of the bullish trend in the markets.

The On-chain analysis is predicting a short-term Rally at the prices of Bitcoin towards the $45000 handle this week.

The current market condition is suitable for entering into a BUY position with targets of $44000 and $45500 in the next week.

The prices of BTCUSD will need to remain above the important support levels of $41000 this week.

The weekly outlook is projected at $44000 with a consolidation zone of $43500.

Technical Indicators:

Moving Averages Convergence Divergence (12,26): It is at 176.50 indicating a BUY.

Average Directional Change(14days): It is at 38.75 indicating a BUY.

Bull/ Bear Power(13days): It is at 217.06 indicating a BUY.

Relative Strength Index: It is at 62 indicating a BUY.


Read Full on FXOpen Company Blog...
 
EUR/USD Faces Hurdles, USD/JPY Continues To Rally
Euro-Yen-Pound.jpg


EUR/USD is attempting an upside correction above 1.0800. USD/JPY rallied above 128.50 and traded to a new 20-year high.

Important Takeaways for EUR/USD and USD/JPY


  • The Euro started an upside correction from the 1.0760 zone.
  • There was a break above a key bearish trend line with resistance near 1.0805 on the hourly chart of EUR/USD.
  • USD/JPY extended rally above 128.00 and traded to a new 20-year high.
  • There is a major bullish trend line forming with support near 127.75 on the hourly chart.

EUR/USD Technical Analysis

This past week, the Euro started saw bearish moves below the 1.0950 level against the US Dollar. The EUR/USD pair declined heavily below the 1.0900 support zone.

The pair even broke the 1.0850 level and settled below the 50 hourly simple moving average. A low was formed near 1.0757 on FXOpen and the pair is now correcting higher. There was a move above the 1.0800 resistance level.

EUR/USD Hourly Chart
EURUSD-Chart-2.jpg


Besides, there was a break above a key bearish trend line with resistance near 1.0805 on the hourly chart of EUR/USD. The pair climbed above the 1.0810 zone and the 50 hourly simple moving average.

It tested the 38.2% Fib retracement level of the key decline from the 1.0923 swing high to 1.0757 low. An immediate resistance on the upside is near the 1.0825 level. The next major resistance is near the 1.0840 level.

The 50% Fib retracement level of the key decline from the 1.0923 swing high to 1.0757 low is also near the 1.0840 level. The main resistance is near the 1.0850 level. An upside break above 1.0850 could set the pace for a steady increase.

If not, the pair might drop and test the 1.0800 support. The next major support is near 1.0790 or the 50 hourly simple moving average, , below which the pair could drop to 1.0760 in the near term.


Read Full on FXOpen Company Blog...
 
ETHUSD and LTCUSD Technical Analysis – 21st APR, 2022
eth.jpg


ETHUSD: Bullish Engulfing Pattern Above $2,800

Ethereum entered a consolidation channel last week, after which it started to decline touching a low of $2,883 on April 18th in the US trading session.

Ethereum touched an intraday low of $3,066 in the Asian trading session, and an intraday high of $3,108 in the European trading session today.

We can clearly see a bullish engulfing pattern above the $2,800 handle which is a bullish pattern and signifies the end of a bearish phase and the start of a bullish phase in the markets.

ETH is now trading just above its pivot level of 3,092 and moving in a mildly bullish channel. The price of ETHUSD is now testing its classic resistance level of 3,111 and Fibonacci resistance level of 3,121, after which the path towards 3,200 will get cleared.

The relative strength index is at 53 indicating a STRONG demand for Ethereum and the continuation of the bullish trend.

Both the StochRSI and Williams percent range are indicating an overbought level which means that the price is due to decline in the short term.

All of the technical indicators are giving a STRONG BUY market signal. All of the moving averages are giving a STRONG BUY signal, and we are now looking at the levels of $3,300 to $3,400 in the short-term range.

ETH is now trading above both the 100 hourly and exponential moving averages.

  • A bullish reversal seen in Eth above the $2,800 mark
  • The short-term range appears to be mildly BULLISH
  • The daily RSI is below 50 at 49 indicating a NEUTRAL market
  • The average true range is indicating LESS market volatility

Ether: Bullish Reversal Seen Above $2,800
etx.png


ETHUSD is now moving in a mildly bullish channel with the price trading above the $3,100 handle in the European trading session today.

Ethereum is slowly preparing for its next move against the US dollar. We can see the formation of a bullish harami pattern above the $3,000 handle, and further validates the bullish momentum present in the markets.

ETHUSD is now facing its immediate resistance levels of $3,146 and $3,216, after which we will see a linear progression towards the level of $3,300.

The key support levels to watch are $2,898 and $3,022, and the prices of ETHUSD need to remain above these levels for the continuation of the bullish trend.

ETH has gained 0.07% with a price change of $2.31 in the past 24hrs, and has a trading volume of 16.372 billion USD.

We have seen an increase of 19.21% in the total trading volume in the last 24 hrs. which appears to be normal.

The Week Ahead

This week, the price of Ethereum continues to remain above the 200-day SMA and is now poised towards the formation of a rally into the markets.

As ETH 2.0 is nearing, the projected outlook for Ethereum is close to $5,000 after the successful implementation of the upgrade.

If the price of ETHUSD remains above $3,000, we may see a linear progression towards $3,300 and $3,400 this week.

The immediate short-term outlook for Ether has turned mildly BULLISH; the medium-term outlook has turned neutral; and the long-term outlook for Ether is NEUTRAL in present market conditions.

This week, Ether is expected to move in a range between $3,100 and $3,300, and next week, Ether is expected to enter into a consolidation phase above $3,300.

Technical Indicators:

Stoch (9,6): at 57.06 indicating a BUY

The moving averages convergence divergence (12,26): at 2.19 indicating a BUY

The ultimate oscillator: at 54.11 indicating a BUY

Bull/Bear power (13-day): at 20.56 indicating a BUY


Read Full on FXOpen Company Blog...
 
AUD/USD and NZD/USD At Clear Risk of More Downsides
AUD-2.jpg


AUD/USD gained bearish momentum below the 0.7400 support zone. NZD/USD started a major decline after it faced sellers near 0.6815.

Important Takeaways for AUD/USD and NZD/USD


  • The Aussie Dollar started a fresh decline after it struggled near 0.7450 against the US Dollar.
  • There was a break below a key bullish trend line with support near 0.7390 on the hourly chart of AUD/USD.
  • NZD/USD also started a major decline after it failed to stay above 0.6800.
  • There was a move below a key bullish trend line with support near 0.6740 on the hourly chart of NZD/USD.

AUD/USD Technical Analysis

The Aussie Dollar faced a strong selling interest near the 0.7450 level against the US Dollar. The AUD/USD pair started a major decline below the 0.7420 level.

There was a clear move below the 0.7400 and 0.7380 support levels. The pair even declined below the 0.7350 support level and the 50 hourly simple moving average. Besides, there was a break below a key bullish trend line with support near 0.7390 on the hourly chart of AUD/USD.

AUD/USD Hourly Chart
AUDUSD-Chart-1.png


The pair traded as low as 0.7332 on FXOpen and is currently consolidating losses. On the upside, the AUD/USD pair is facing resistance near the 0.7350 level.

The next major resistance is near the 0.7360 level. It is near the 23.6% Fib retracement level of the recent drop from the 0.7457 swing high to 0.7332 low. The first major resistance is now forming near the 0.7400 level.

The 50% Fib retracement level of the recent drop from the 0.7457 swing high to 0.7332 low is also near the 0.7395 level. A close above the 0.7400 level could start a steady increase in the near term. The next major resistance could be 0.7450.

On the downside, an initial support is near the 0.7330 level. The next support could be the 0.7300 level. If there is a downside break below the 0.7300 support, the pair could extend its decline towards the 0.7250 level. Any more downsides might send the pair toward the 0.7220 level.


Read Full on FXOpen Company Blog...
 
GBP/USD Takes A Hit, USD/CAD Eyes More Gains
GBPUSD-Sterling-1.jpg


GBP/USD started a major decline below the 1.3000 support. USD/CAD gained bullish momentum for a move above the 1.2650 level.

Important Takeaways for GBP/USD and USD/CAD


  • The British Pound started a fresh decline from the 1.3100 resistance zone.
  • There is a short-term bearish trend line forming with resistance near 1.2820 on the hourly chart of GBP/USD.
  • USD/CAD started a fresh increase from well below the 1.2550 zone.
  • There was a break above a major bearish trend line with resistance near 1.2550 on the hourly chart.

GBP/USD Technical Analysis

After struggling to clear the 1.3100 resistance zone, the British Pound found started a fresh decline against the US Dollar. GBP/USD traded below the 1.3000 support level to move into a bearish zone.

The bears gained strength for a move below the 1.2900 level and the 50 hourly simple moving average. The pair even spiked below the 1.2800 level and traded as low as 1.2793 on FXOpen. It is now consolidating above the 1.2800 level.

GBP/USD Hourly Chart
GBPUSD-Chart-3.jpg


An immediate resistance is near the 1.2820 level. There is also a short-term bearish trend line forming with resistance near 1.2820 on the hourly chart of GBP/USD.

The next key resistance is near the 1.2860 level. It is near the 23.6% Fib retracement level of the downward move from the 1.3090 swing high to 1.2793 low. The first major resistance is near the 1.2940 level.

The 50% Fib retracement level of the downward move from the 1.3090 swing high to 1.2793 low is also near the 1.2940 level. If there is an upside break above the 1.2940 zone, the pair could rise towards 1.3000. The next key resistance could be 1.3050, above which the pair could gain strength.

On the downside, the first support is near the 1.2800 area. The first major support is near the 1.2750 level. If there is a break below 1.2750, the pair could extend its decline. The next key support is near the 1.2625 level. Any more losses might call for a test of the 1.2550 support.


Read Full on FXOpen Company Blog...
 
BTCUSD and XRPUSD Technical Analysis – 26th APR 2022
btcx.jpg


BTCUSD: Double Bottom Pattern Above $38,000

Bitcoin was not able to sustain its bullish momentum last week, and after touching a high of $42,901 on April 21st, started to decline heavily against the US dollar.

The shortselling continued pushing down the price of BTC below the $39,000 handle, after which we saw some consolidation.

A falling trend channel is forming on the chart, expected to push down the price of bitcoin below the $38,000 handle. We can also see a double bottom pattern above the $38,000 handle — which is a bullish reversal pattern because it signifies the end of a downtrend and a shift towards an uptrend.

The Stoch and Williams percent range are indicating an overbought level, meaning that in the immediate short term, a decline in the price is expected.

The relative strength Index is at 61 indicating a STRONG demand for bitcoin at the current market levels.

Bitcoin is now moving above its 100 hourly SMA and its 200 hourly exponential MA.

Most of the major tech indicators are giving a BUY signal, which means that in the immediate short term, we are expecting targets of $42,000 and $43,000.

The average true range is indicating LESSER market volatility with a strong bullish momentum.

  • Bullish reversal seen in bitcoin above $38,000
  • The StochRSI is indicating an OVERSOLD level
  • The price is now trading just above its pivot levels of $40,429
  • All of the moving averages are giving a BUY market signal

Bitcoin: Bullish Reversal Seen Above $38,000
btc.png


Bitcoin has moved out of the falling trend we observed last week and now continues to consolidate its gains above the $40,000 handle in the European trading session. The bounce that we have seen above the $38,000 handle is expected to continue this week, and we are now looking at the targets of $42,000 and $45,000 in the medium-term range.

The immediate short-term outlook for bitcoin is bullish; the medium-term outlook has turned bullish; the long-term outlook remains neutral under present market conditions.

We are now looking at possible reversal and short selling at $40,500 and $40,450, as indicated by the MA5 and MA10 crossover pattern. This is further validated by the overbought level seen in the Stoch and Williams percent range.

The price of BTCUSD is now facing its classic resistance level of $40,514 and Fibonacci resistance level of $40,627 after which the path towards $42,000 will get cleared.

In the last 24hrs, BTCUSD has gone UP by 4.83% with a price change of 1859$, and has a 24hr trading volume of USD 32.922 billion. We can see an increase of 27.77% in the trading volume compared to yesterday, which is due to the buying by the medium-term investors.

The Week Ahead

The price of bitcoin touched an intraday high of $40,776 after which we saw some correction below the $40,500 handle.

We are now in the low volatility zone, and a surge in the price is expected leading to the increase in volatility levels.

The on-chain analysis is predicting a short-term rally towards the $45,000 handle this week.

The current market condition is suitable for entering into a BUY position with targets of $43,000 and $45,000 for next week.

This week, the price of BTCUSD will need to remain above the important support level of $40,000.

The weekly outlook is projected at $43,000 with a consolidation zone of $42,500.

Technical Indicators:

The moving averages convergence divergence (12,26): at 252.30 indicating a BUY

The average directional change (14-day): at 51.53 indicating NEUTRAL levels

Bull/Bear power (13-day): at 115.78 indicating a BUY

The relative strength index: at 61 indicating a BUY


Read Full on FXOpen Company Blog...
 
EUR/USD Resumes Decline, USD/CHF Eyes More Gains
Euro-EUR-USD.jpg


EUR/USD declined heavily below the 1.0850 and 1.0750 levels. USD/CHF could gain pace if there is a move above the 0.9630 resistance.

Important Takeaways for EUR/USD and USD/CHF


  • The Euro started a major decline from the 1.0935 resistance zone against the US Dollar.
  • There is a major bearish trend line with resistance near 1.0670 on the hourly chart of EUR/USD.
  • USD/CHF formed a base above the 0.9500 support zone and started a decent increase.
  • There is a key bullish trend line forming with support near 0.9600 on the hourly chart.

EUR/USD Technical Analysis

The Euro struggled to gain pace above the 1.0920 resistance level against the US Dollar. The EUR/USD pair started a fresh decline below the 1.0850 and 1.0750 support levels.

There was a clear move below the 1.0700 level and the 50 hourly simple moving average. The pair even declined below the 1.0650 support level. It traded as low as 1.0633 on FXOpen and the pair is now consolidating losses.

EUR/USD Hourly Chart
EURUSD-Chart-3.jpg


On the upside, an initial resistance is near the 1.0665 level. There is also a major bearish trend line with resistance near 1.0670 on the hourly chart of EUR/USD.

The next major resistance is near the 1.0700 level and the 50 hourly simple moving average. It is near the 23.6% Fib retracement level of the key drop from the 1.0936 swing high to 1.0633 low. The next major resistance is near the 1.0750 zone.

A clear upside break above the 1.0750 zone could open the doors for a steady move. In the stated case, the pair might even surpass the 50% Fib retracement level of the key drop from the 1.0936 swing high to 1.0633 low.

On the downside, an immediate support is near the 1.0635 level. The next major support is near the 1.0600 level. A downside break below the 1.0600 support could start another decline.


Read Full on FXOpen Company Blog...
 
ETHUSD and LTCUSD Technical Analysis – 28th APR, 2022
dcx.jpg


ETHUSD: Rounding Bottom Pattern Above $2,700

Ethereum was unable to sustain its bullish momentum this week, and after touching a high of $3,036 on April 26th started to decline against the US dollar.

The bearish momentum has pulled down the prices of Ethereum below the $2,800 handle touching a low of $2,766 on April 26th.

The price has entered a consolidation channel above the $2,700 handle; we are in a mildly bullish phase in the European trading session.

We can clearly see a rounding bottom pattern above the $2,700 handle, which is a bullish pattern signifying the end of a bearish phase and the start of a bullish phase in the markets.

ETH is now trading just above its pivot level of $2,924 and is moving in a mildly bullish channel. The price of ETHUSD is testing its classic resistance level of $2,948 and Fibonacci resistance level of $2,966, after which the path towards $3,100 will get cleared.

The relative strength index is at 63 indicating a STRONG demand for Ethereum and the continuation of the bullish trend.

Both the StochRSI and Williams percent range are indicating an overbought level which means that the prices are due to decline in the short term.

All of the technical indicators are giving a STRONG BUY market signal.

All of the moving averages are giving a STRONG BUY signal, and we are now looking at the levels of $3,200 to $3,350 in the short-term range.

ETH is now trading above both the 100 hourly and exponential MAs.

  • Ether: bullish reversal seen above the $2,700 mark
  • Short-term range appears to be mildly BULLISH
  • The daily RSI is below 50 at 45, indicating a NEUTRAL market
  • The average true range is indicating LESSER market volatility

Ether: Bullish Reversal Seen Above $2,700
etx.png


ETHUSD is now moving in a mildly bullish channel, with the price trading above the $2,900 handle in the European trading session today.

Ethereum’s demand is increasing, which is leading to a slow rise in its levels, and now we are looking at the immediate targets of $3,000 and $3,150.

ETHUSD is now facing its immediate resistance level of $3,149 and $3,203, after which we will see a linear progression towards $3,300. The key support levels to watch are $2,869 and $2,880, and the price of ETHUSD need to remain above these levels for the continuation of the bullish trend.

ETH has gained 1.88% with a price change of 54.35$ in the past 24hrs, and has a trading volume of 17.239 billion USD.

We can see a decrease of 16.56% in the total trading volume in the last 24 hrs, which appears to be normal.

The Week Ahead

We can see the formation of a bearish harami pattern in the 15-minute timeframe, which indicates a potential short-term reversal in its levels. This is also confirmed by the MA200 crossover pattern located at $2,964 and $2,943.

The transaction fees of Ethereum continue to decline by more than 90% in a period of 6 months. At present, the average transaction fee is about $5.80.

The on-chain metrics are also indicating a bullish scenario for Ethereum in the medium-term range with a projection level of $3,800 to $4,000.

The immediate short-term outlook for Ether has turned mildly BULLISH; the medium-term outlook has turned neutral; the long-term outlook for Ether is NEUTRAL in present market conditions.

This week, Ether is expected to move in a range between $3,000 and $3,200, and next week, Ether is expected to enter a consolidation phase above the level of $3,200.

Technical Indicators:

Stoch (9,6): at 51.80 indicating a NEUTRAL level

The moving averages convergence divergence (12,26): at 9.17 indicating a BUY

The ultimate oscillator: at 56.21 indicating a BUY

Bull/ Bear power (13-day): at 78.86 indicating a BUY


Read Full on FXOpen Company Blog...
 
Gold Price And Crude Oil Price Hold Key Support
Gold-price-oil-price-2-2.jpg


Gold price is trading above a major support near $1,850. Similarly, crude oil price must stay above $94.30 to remain in a positive zone.

Important Takeaways for Gold and Oil


  • Gold price started a downside correction from the $2,070 high against the US Dollar.
  • There is a major bullish trend line forming with support near $1,830 on the daily chart of gold.
  • Crude oil price also started a downside correction from the $126.37 high.
  • There is a key bullish trend line forming with support near $97.00 on the daily chart of XTI/USD.

Gold Price Technical Analysis

This past month, gold price started a strong increase from the $1,780 support zone against the US Dollar. There was a clear break above the $1,800 and $1,900 resistance levels.

The price accelerated its gains above the $2,000 level and settled well above the 50-day simple moving average. It traded to a new multi-year high at $2,070 on FXOpen. Recently, it started a downside correction below the $2,000 level.

Gold Price Daily Chart
Gold-Price-Chart-2.jpg


There was a break below the 50% Fib retracement level of the upward move from the $1,780 low to $2,070 high. It even traded below $1,925 and the 50-day simple moving average.

An initial support on the downside is near the $1,872 level. The main support is near the $1,850 level and the 76.4% Fib retracement level of the upward move from the $1,780 low to $2,070 high. There is also a major bullish trend line forming with support near $1,830 on the daily chart of gold.

Any further losses may perhaps open the doors for a larger decline towards the $1,800 and $1,780 levels in the near term. On the upside, an initial resistance is near the $1,925 level.

The first major resistance is near the $1,935 level. A clear break above the $1,935 barrier might call for a move towards $2,000.


Read Full on FXOpen Company Blog...
 
GBP/USD Struggle Continues, GBP/JPY Eyes More Gains
GBPUSD-Sterling.jpg


GBP/USD started another decline from well above the 1.2900 level. GBP/JPY is rising and might gain pace above the 164.20 resistance zone.

Important Takeaways for GBP/USD and GBP/JPY


  • The British Pound started a fresh decline after it failed near 1.2950 against the US Dollar.
  • Recently, there was a break above a key bearish trend line with resistance near 1.2500 on the hourly chart of GBP/USD.
  • GBP/JPY started a fresh increase after it formed a base above the 159.50 level.
  • There is a major bullish trend line forming with support near 163.25 on the hourly chart.

GBP/USD Technical Analysis

This past week, the British Pound started a major decline from the 1.3090 zone against the US Dollar. The GBP/USD pair broke the 1.3000 support zone to enter a bearish zone.

There was a clear move below the 1.2900 support and the 50 hourly simple moving average. It even traded below the 1.2750 and 1.2620 support levels. Finally, there was a move below the 1.2450 level and the pair traded as low as 1.2411 on FXOpen.

GBP/USD Hourly Chart
GBPUSD-Chart.jpg


It is currently attempting an upside correction above 1.2500. There was a move above the 23.6% Fib retracement level of the key decline from the 1.3090 swing high to 1.2411 low.

There was also a break above a key bearish trend line with resistance near 1.2500 on the hourly chart of GBP/USD. However, the pair is facing a major resistance near the 1.3600 and 1.3620 levels. The next major hurdle is near the 1.2750 level.

The 50% Fib retracement level of the key decline from the 1.3090 swing high to 1.2411 low is also near the 1.2750 level. If there is no upside break above 1.2620, the pair could start a fresh decline.

An immediate support is near the 1.2525 level and the 50 hourly simple moving average. The next major support is near the 1.2500 level. If there is a break below the 1.2500 support, the pair could test the 1.2420 support.


Read Full on FXOpen Company Blog...
 
EUR/USD and EUR/JPY Could Extend Downsides
Euro-EUR.jpg


EUR/USD started a fresh decline from the 1.0750 resistance. EUR/JPY could extend downsides if there is a move below the 136.50 support.

Important Takeaways for EUR/USD and EUR/JPY


  • The Euro failed to clear the 1.0750 resistance and started a fresh decline.
  • There is a key bullish trend line forming with support near 1.0500 on the hourly chart.
  • EUR/JPY started a downside correction from the 138.00 resistance zone.
  • A major bearish trend line is forming with resistance near 137.20 on the hourly chart.

EUR/USD Technical Analysis

The Euro made a couple of attempts to clear the 1.0750 resistance zone against the US Dollar. However, the EUR/USD pair failed to gain strength above 1.0750 and started a fresh decline.

The pair declined below the 1.0600 support and the 50 hourly simple moving average. The pair even moved below the 1.0550 support level. A low was formed near 1.0470 on FXOpen before the pair started a short-term upside correction.

EUR/USD Hourly Chart
EURUSD-Chart.jpg


There was a move above the 1.0520 resistance level. It corrected above the 23.6% Fib retracement level of the key drop from the 1.0758 high to 1.0470 low.

On the upside, the pair is facing resistance near the 1.0580 level. It is near the 38.2% Fib retracement level of the key drop from the 1.0758 high to 1.0470 low. The next major resistance is near the 1.0620 level.

A clear break above the 1.0620 resistance could push EUR/USD towards 1.0700. If the bulls remain in action, the pair could revisit the 1.0750 resistance zone in the near term.

On the downside, the pair might find support near the 1.0500 level. There is also a key bullish trend line forming with support near 1.0500 on the hourly chart. If there is a downside break below the 1.0500 support, the pair might accelerate lower. The next major support sits near the 1.0470 level, below which there is a risk of a larger decline.


Read Full on FXOpen Company Blog...
 
ETHUSD and LTCUSD Technical Analysis – 05th MAY, 2022
eth.jpg


ETHUSD: Bullish Engulfing Pattern above $2,750

Ethereum was moving in a bearish phase last week and touched a low of 2,725 on May 1st, after which it entered into a consolidation channel above the $2,750 handle.

This week, ETHUSD started moving in a bullish channel, and managed to cross the $2,900 handle in the European trading session today.

We can clearly see a bullish engulfing pattern above $2,750 which signifies the end of a bearish trend and the start of a bullish trend.

We can see that the price of Ethereum has retracted from its highs due to some profit taking, but the bullish channel continues, and we are aiming for the upsides of $3,100 and $3,300 this week.

ETH is now trading just below its pivot level of 2,936 and moving in a mild bullish momentum. The price of ETHUSD is now facing its classic resistance level of 2,944, Fibonacci resistance level of 2,960, and is now aiming towards the $3,000 handle in the US trading session.

Most of the moving averages are giving a BUY signal.

ETH is now trading below both its 100 hourly and 200 hourly simple MAs.

  • Ethereum is in a mildly bullish channel
  • Short-term trend reversal seen above $2,750
  • All the major technical indicators are giving a NEUTRAL to BUY signal
  • The average true range is indicating LESSER market volatility


Ether: Bullish Channel Above $2900 Confirmed
etx.png


ETHUSD has consolidated its gains above $2,900 in the European trading session, and we can clearly see that the bullish channel is back.

We are now aiming for the upsides of $3,000 to $3,100 in today’s US trading session. The retracement from $2,721 was very strong which suggests that there is more room for the upsides in Ethereum this month, and a level of $3,500 is the next target.

We can see the MA crossover pattern above the level of 2,850 which means that in the immediate short term we will see the continuation of the bullish channel.

ETH has gained 2.86% with a price change of 81.25$ in the past 24hrs, and has a trading volume of 17.890 billion USD.

We can see an increase of 36% in the trading volume as compared to yesterday which means that new buyers are entering the markets and waiting for further correction in the levels of Ethereum.

The Week Ahead

Ether is printing above $2,980 today, and we can see levels of $3,000 to $3,200 this week.

The medium-to-long term outlook for Ether remains bullish with targets of above 3,500 in May.

With the US Federal Reserve increasing its benchmark interest rate by half a percentage point, the price of Ethereum continues rising along with other top cryptocurrencies.

Ether has already broken its major resistance level of $2,800 and is now facing the next resistance level of $3,000.

Technical Indicators:

The commodity channel index (14-day): at 135.24 indicating a BUY

The moving averages convergence divergence (14-day): at 14.80 indicating a BUY

The ultimate oscillator: at 61.44 indicating a BUY

The rate of price change: at 3.39 indicating a BUY


Read Full on FXOpen Company Blog...
 
AUD/USD and NZD/USD Might Struggle To Recover Losses
AUD.jpg


AUD/USD gained bearish momentum below the 0.7150 support zone. NZD/USD started a major decline after it faced sellers near 0.6565.

Important Takeaways for AUD/USD and NZD/USD


  • The Aussie Dollar started a fresh decline after it struggled near 0.7265 against the US Dollar.
  • There was a break below a major bullish trend line with support near 0.7160 on the hourly chart of AUD/USD.
  • NZD/USD also started a major decline after it failed to stay above 0.6550.
  • There was a move below a key bullish trend line with support near 0.6445 on the hourly chart of NZD/USD.

AUD/USD Technical Analysis

The Aussie Dollar faced a strong selling interest near the 0.7265 level against the US Dollar. The AUD/USD pair started a major decline below the 0.7200 level.

There was a clear move below the 0.7160 and 0.7150 support levels. Besides, there was a break below a major bullish trend line with support near 0.7160 on the hourly chart of AUD/USD. The pair declined below the 50% Fib retracement level of the upward move from the 0.7030 swing low to 0.7265 high (formed on FXOpen).

AUD/USD Hourly Chart
AUDUSD-Chart.jpg


The pair even declined below the 0.7120 support level and the 50 hourly simple moving average. Finally, it tested the 76.4% Fib retracement level of the upward move from the 0.7030 swing low to 0.7265 high.

On the upside, the AUD/USD pair is facing resistance near the 0.7120 level. The next major resistance is near the 0.7150 level. A close above the 0.7150 level and the 50 hourly simple moving average could start a steady increase in the near term.

The next major resistance could be 0.7200. On the downside, an initial support is near the 0.7085 level. The next support could be the 0.7050 level.

If there is a downside break below the 0.7050 support, the pair could extend its decline towards the 0.7000 level. Any more downsides might send the pair toward the 0.6920 level.


Read Full on FXOpen Company Blog...
 
GBP/USD and EUR/GBP: British Pound Remains In Downtrend
GBPUSD-Cable.jpg


GBP/USD started a fresh decline from well above the 1.2650 level. EUR/GBP is rising and might attempt an upside break above the 0.8600 resistance zone.

Important Takeaways for GBP/USD and EUR/GBP


  • The British Pound started a fresh decline from well above 1.2650 against the US Dollar.
  • There is a key bearish trend line forming with resistance near 1.2335 on the hourly chart of GBP/USD.
  • EUR/GBP formed a base above 0.8350 and started a fresh increase.
  • There is a major bullish trend line forming with support near 0.8535 on the hourly chart.

GBP/USD Technical Analysis

The British Pound struggled to settle above the 1.2620 resistance zone against the US Dollar. The GBP/USD pair started a fresh decline below the 1.2550 support zone.

There was a clear move below the 1.2500 level and the 50 hourly simple moving average. The bears pushed the pair below the 1.2400 level and a new multi-week low was formed near 1.2278 on FXOpen.

GBP/USD Hourly Chart
GBPUSD-Chart-1.jpg


The pair is now consolidating losses above the 1.2280 level. On the upside, an initial resistance is near the 1.2335 level. There is also a key bearish trend line forming with resistance near 1.2335 on the hourly chart of GBP/USD.

The next main resistance is near the 1.2400 zone and the 50 hourly simple moving average. It is close to the 23.6% Fib retracement level of the key decline from the 1.2637 swing high to 1.2278 low.

The main resistance is now forming near the 1.2450 level. It is close to the 50% Fib retracement level of the key decline from the 1.2637 swing high to 1.2278 low. A clear upside break above the 1.2450 and 1.2460 resistance levels could open the doors for a steady increase in the near term.

If not, the pair might continue to move down below 1.2280. The next major support is near the 1.2220 level. Any more losses could lead the pair towards the 1.2150 support zone or even 1.2120.


Read Full on FXOpen Company Blog...
 
Top