FxGrow Daily Technical Analysis – 15th July, 2016
By FxGrow Research & Analysis Team
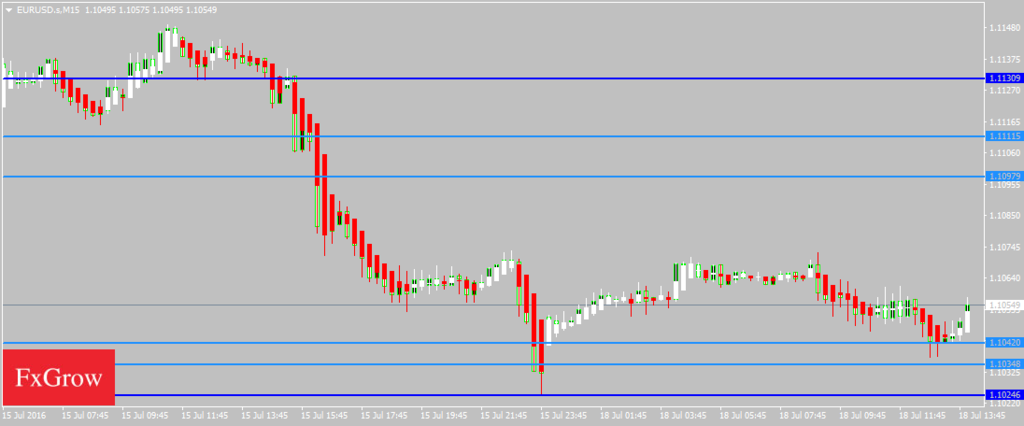
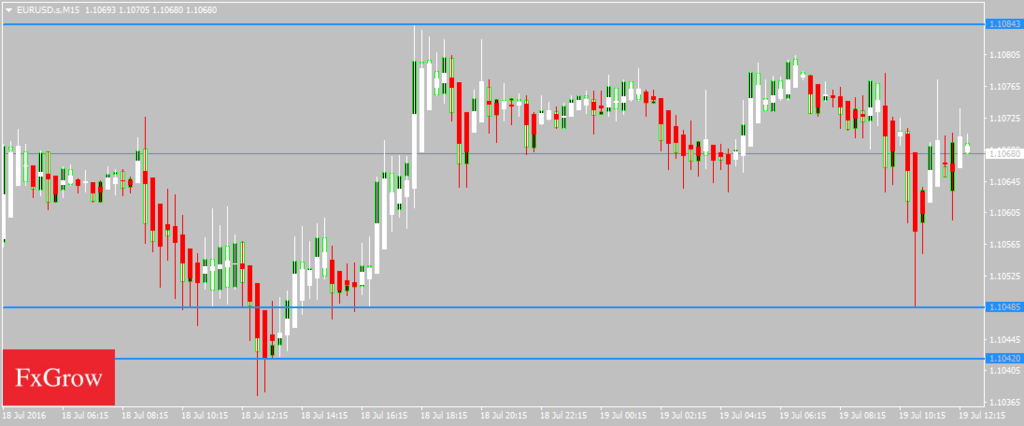
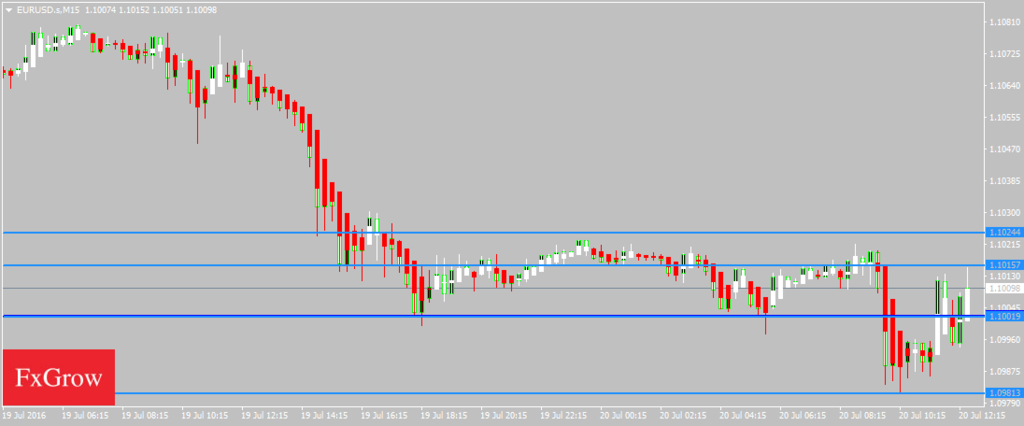
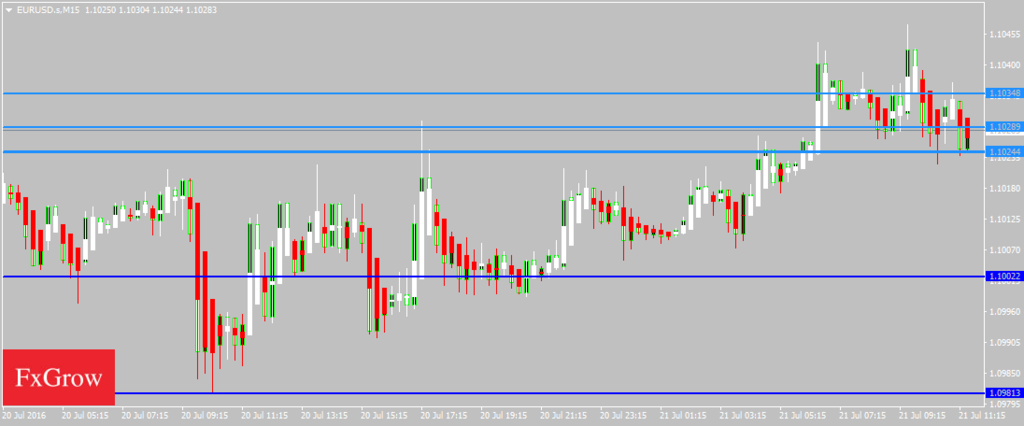
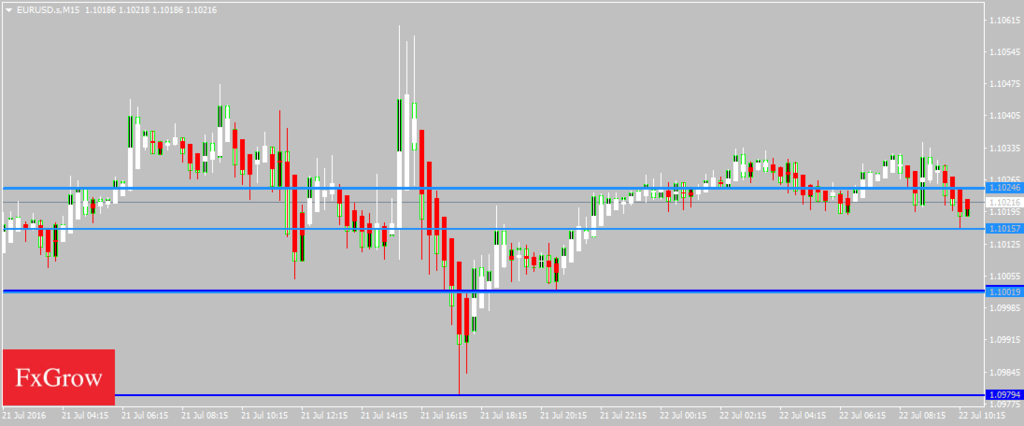
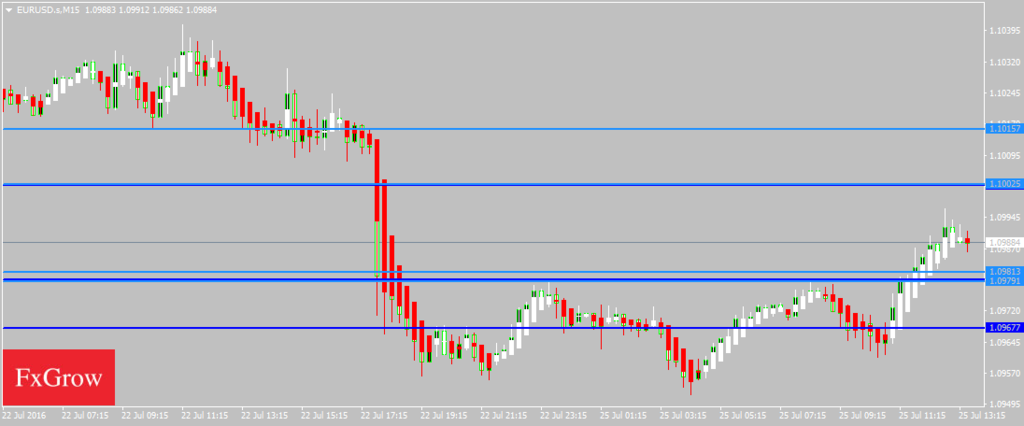
The EURUSD gained ahead of US CPI data
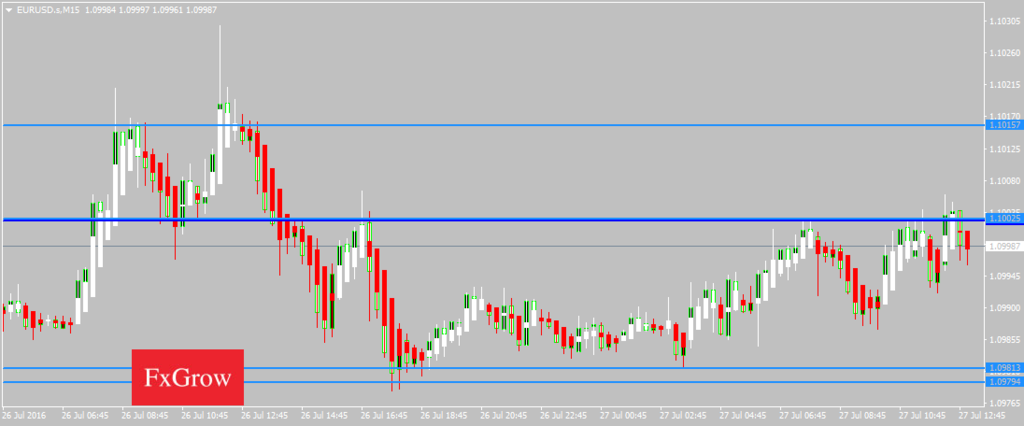
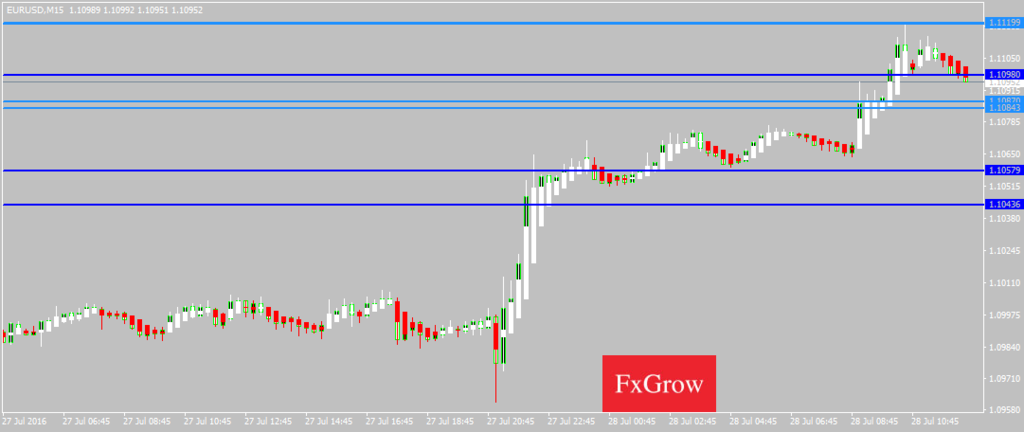
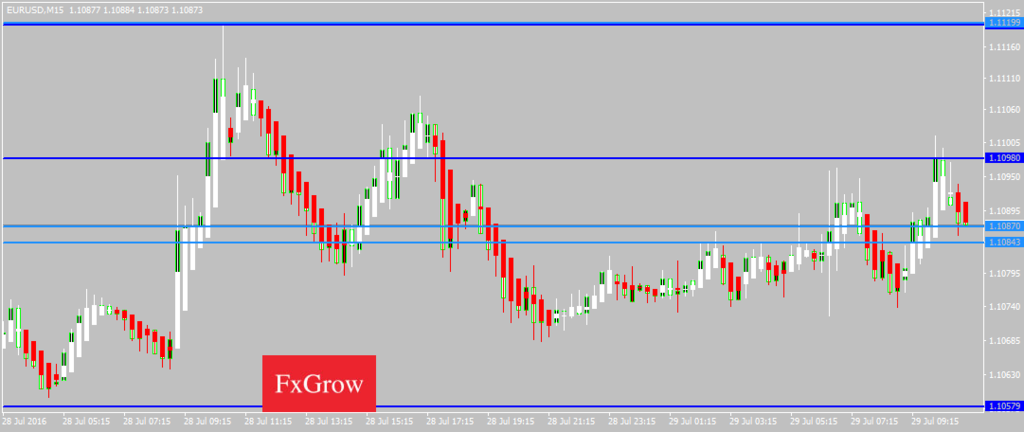
The EURUSD traded higher staying above 1.1100 area on speculations of a drawdown in the core rate of inflation. The EURUSD advanced and gained traction on expectations that weak US economic data will affect Fed hiking rate decision negatively and therefore raises Fed scope to delay interest rate hike for December, and breaking 1.1170 will pave the way through 1.1200 zone to touch 1.1218 and 1.1260.
To read this Full in depth Analysis please visit FxGrowhttp://www.fxgrow.com/analysis-educ...cal-analysis-fxgrow-free-forex-analysis-tools.
Note: This analysis is intended to provide general information and does not constitute the provision of INVESTMENT ADVICE. Investors should, before acting on this information, consider the appropriateness of this information having regard to their personal objectives, financial situation or needs. We recommend investors obtain investment advice specific to their situation before making any financial investment decision.
By FxGrow Research & Analysis Team
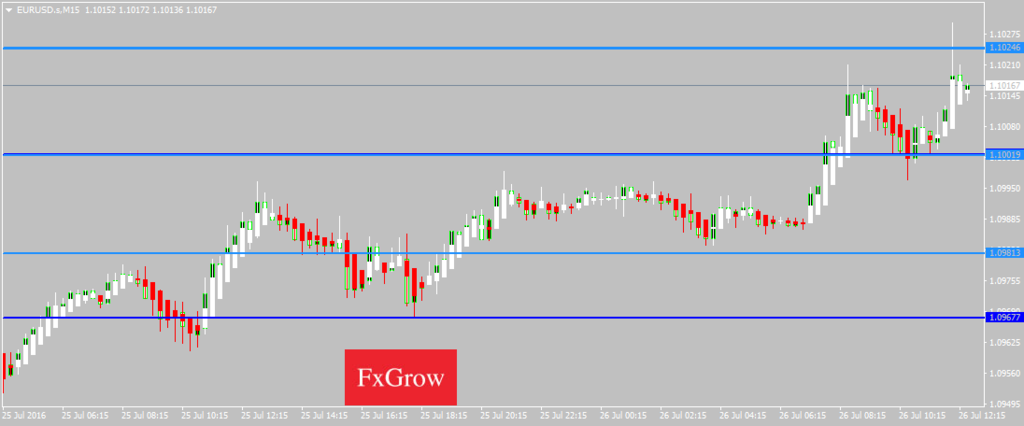
The EURUSD gained ahead of US CPI data
The EURUSD traded higher staying above 1.1100 area on speculations of a drawdown in the core rate of inflation. The EURUSD advanced and gained traction on expectations that weak US economic data will affect Fed hiking rate decision negatively and therefore raises Fed scope to delay interest rate hike for December, and breaking 1.1170 will pave the way through 1.1200 zone to touch 1.1218 and 1.1260.
To read this Full in depth Analysis please visit FxGrowhttp://www.fxgrow.com/analysis-educ...cal-analysis-fxgrow-free-forex-analysis-tools.
Note: This analysis is intended to provide general information and does not constitute the provision of INVESTMENT ADVICE. Investors should, before acting on this information, consider the appropriateness of this information having regard to their personal objectives, financial situation or needs. We recommend investors obtain investment advice specific to their situation before making any financial investment decision.