• The Forex, Binary Options Forum - welcomes you to our Community!

    DigitalCashPalace Forum is dedicated to discussions about Forex, Binary Options, commodities, stocks related.

    Please take a look around, and feel free to .

Daily Technical Analysis by FxGrow

Daily Technical Analysis – 16th June, 2016
By FxGrow Research & Analysis Team

EURUSD

EURUSD_zpsppsvnpwu.png


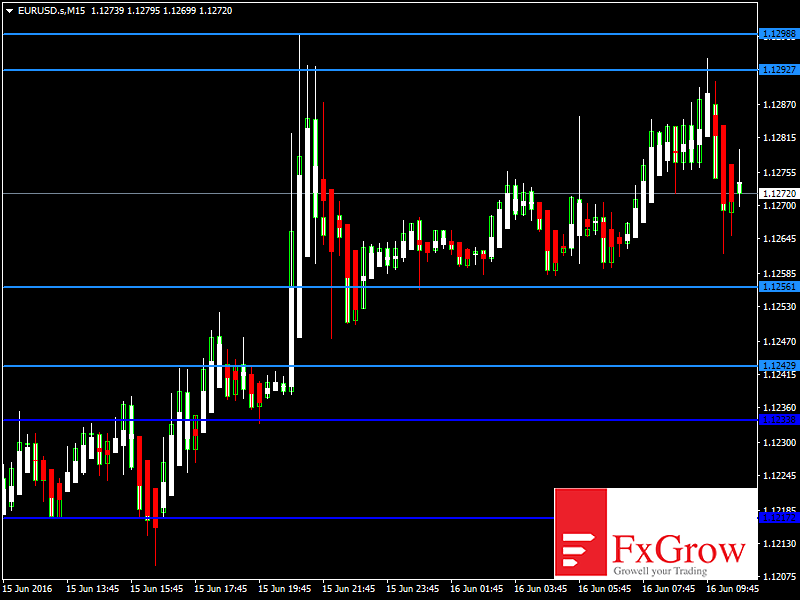
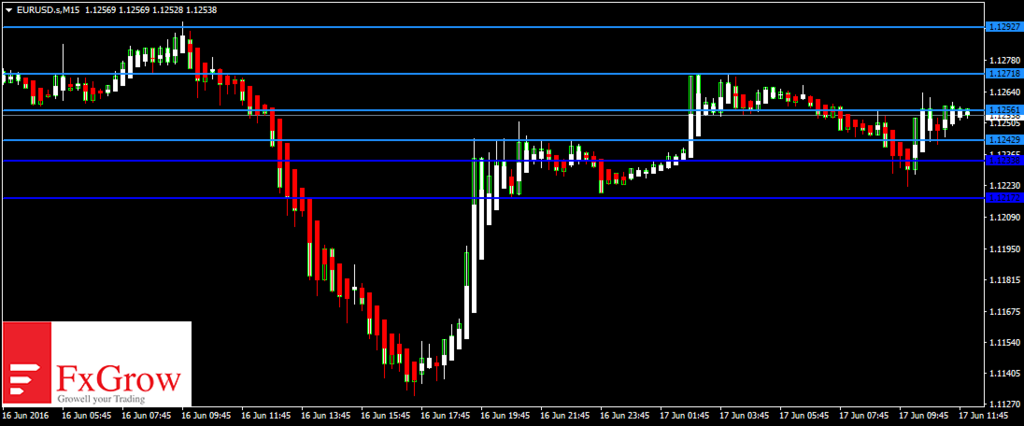
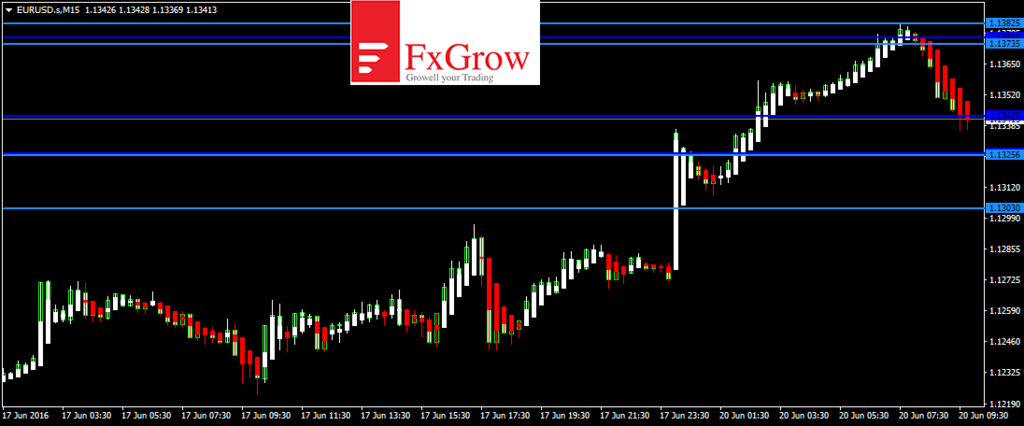
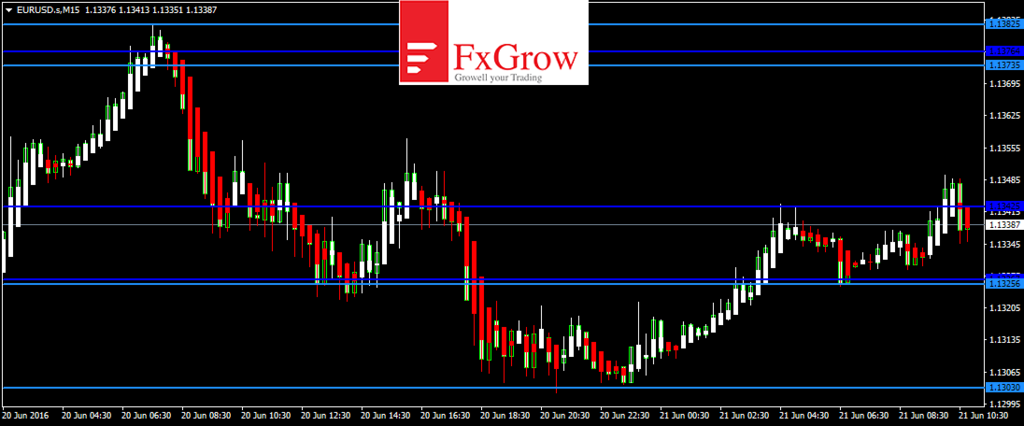
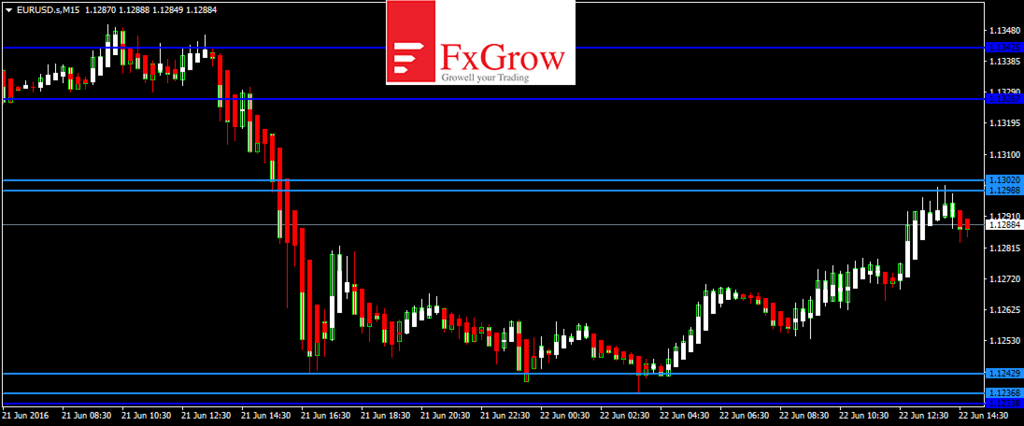
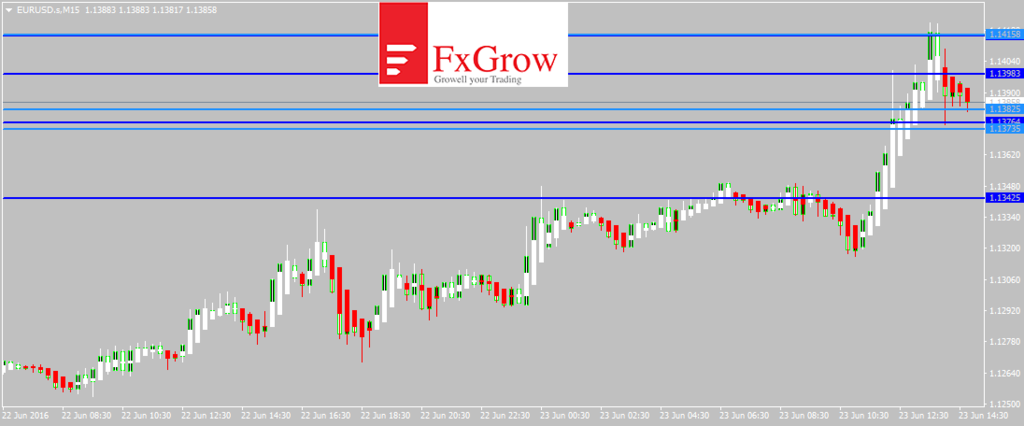
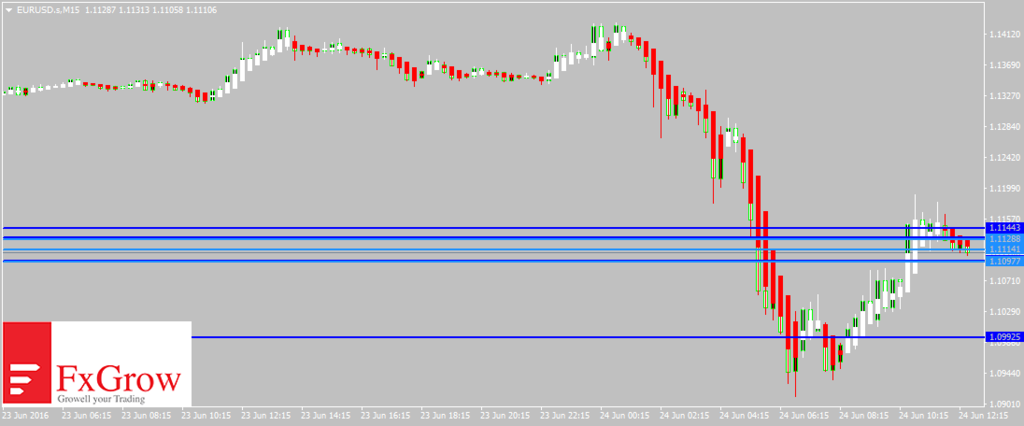
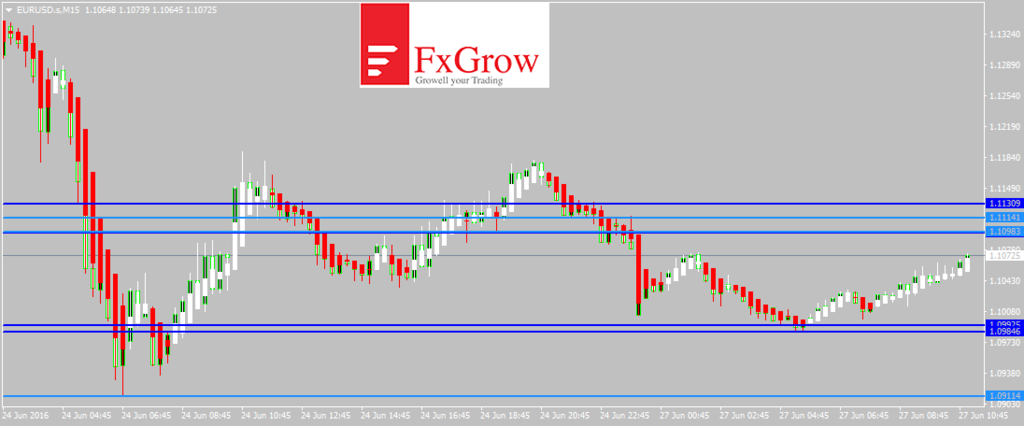
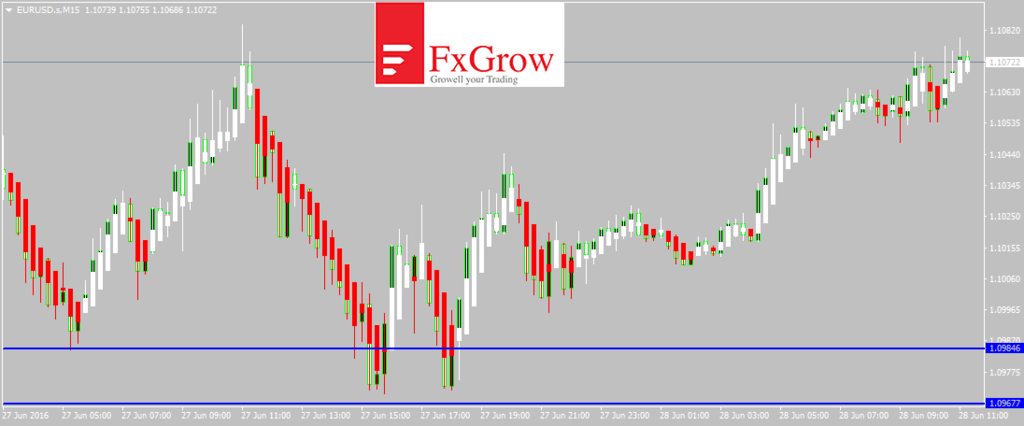
EURUSD continues its bullish momentum crossing 1.1250 yesterday. The near term bias is bullish with targets of 1.1320 to 1.1340

RSI (14), MACD (12, 26), ADX (14), ROC indicate a BUY; STOCHRSI (14) is Oversold; while Average True Range (14) indicates Less Volatility.

Support is at 1.1217 while Resistance is at 1.1292 and 1.1298

16th June 2016 – 08:03hrs GMT


GBPUSD

GBPUSD_zpscsnl1hzq.png


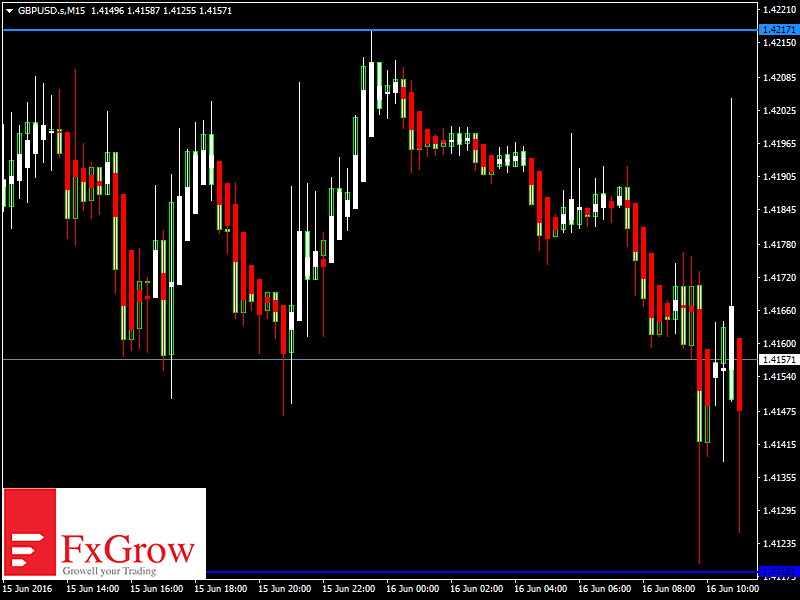
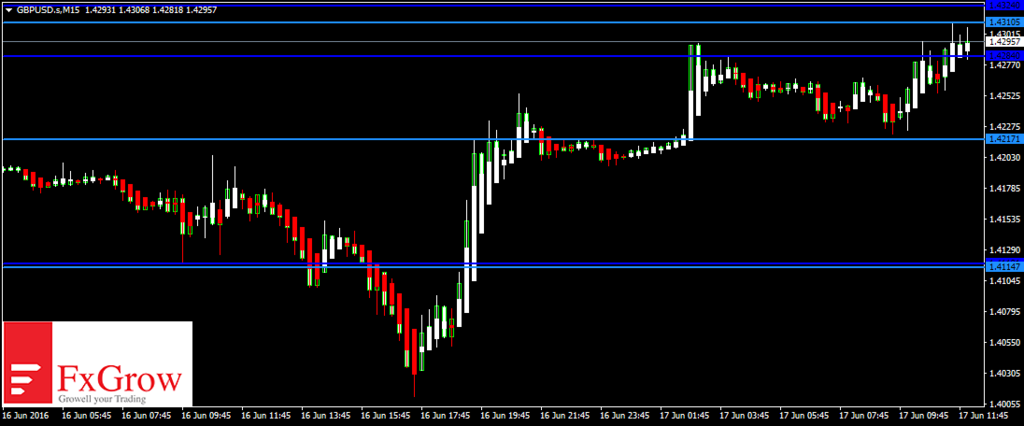
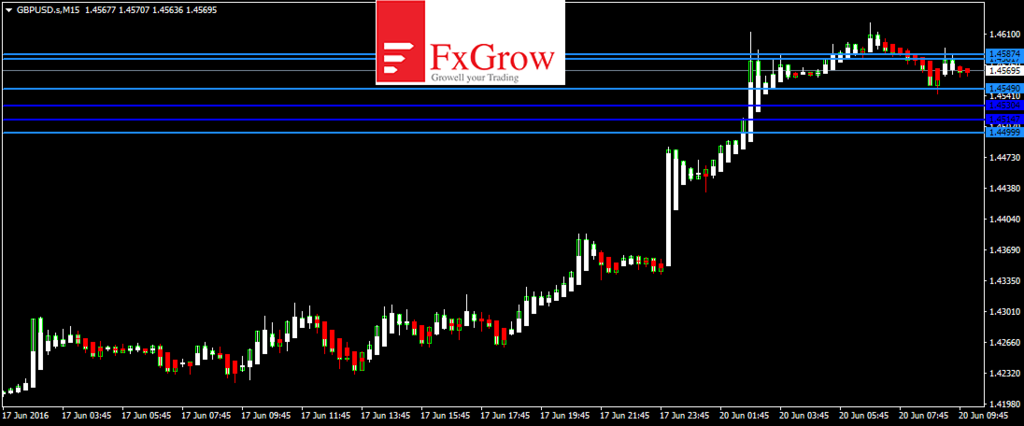
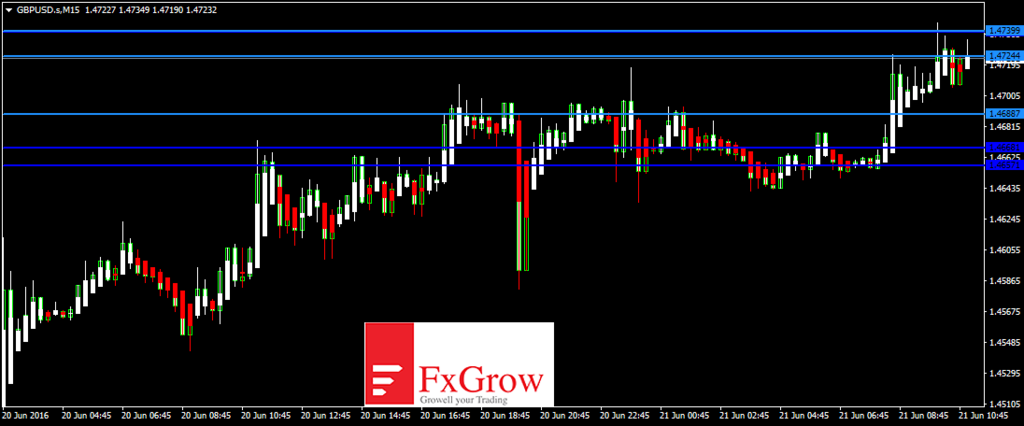
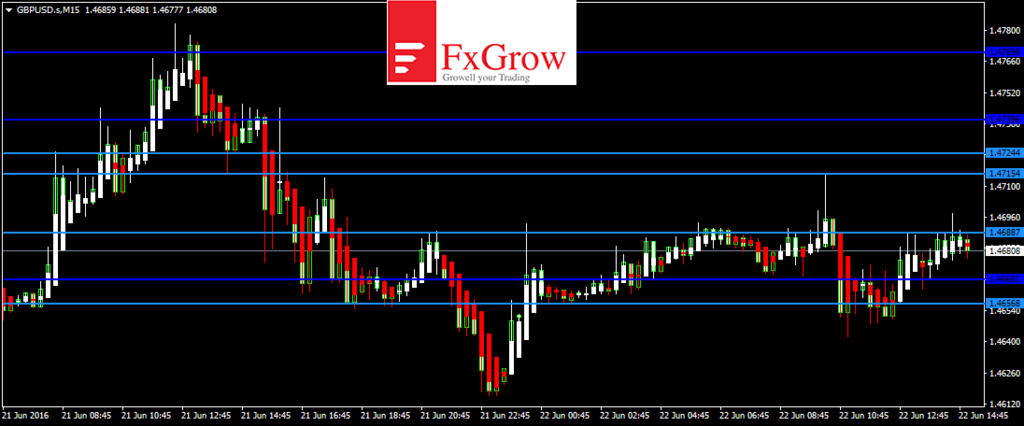
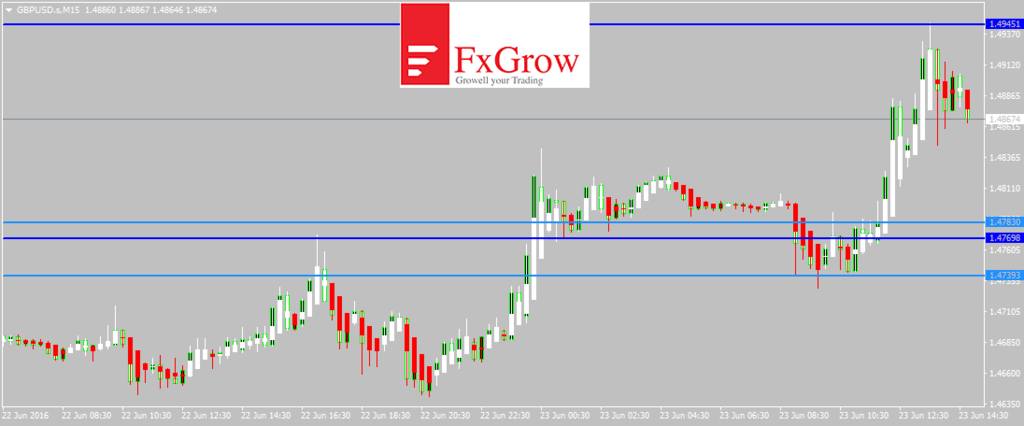
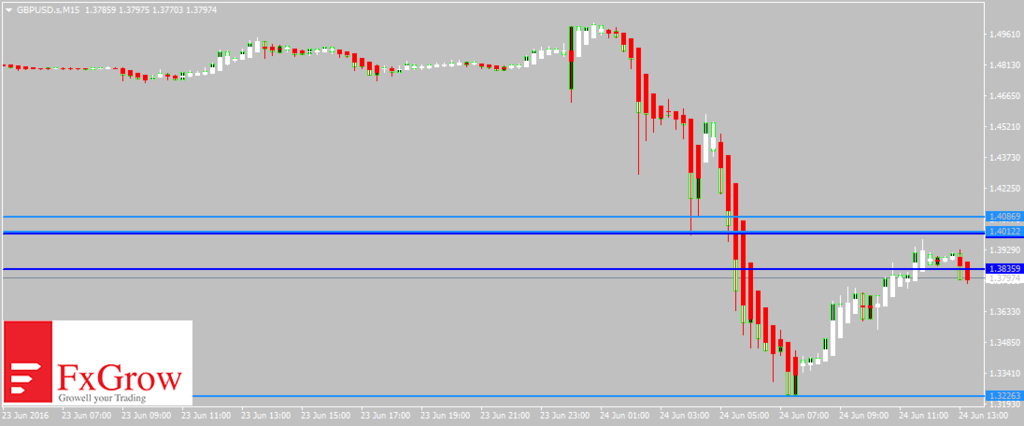
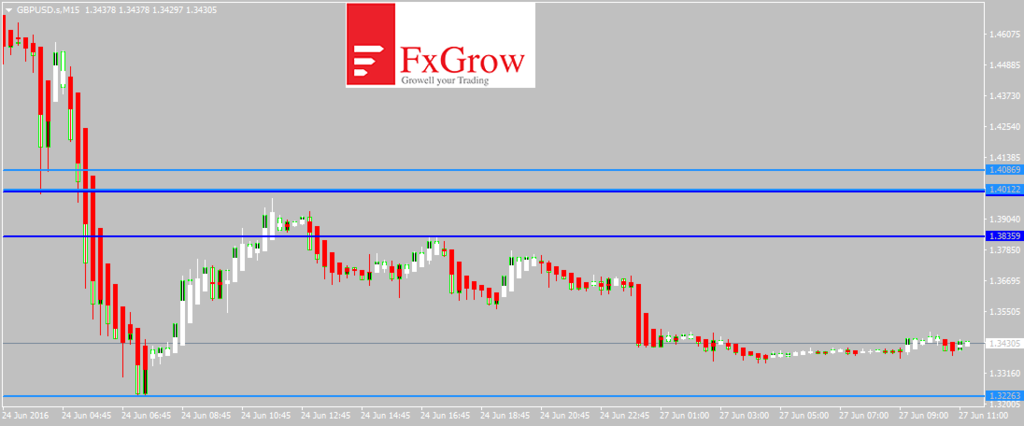
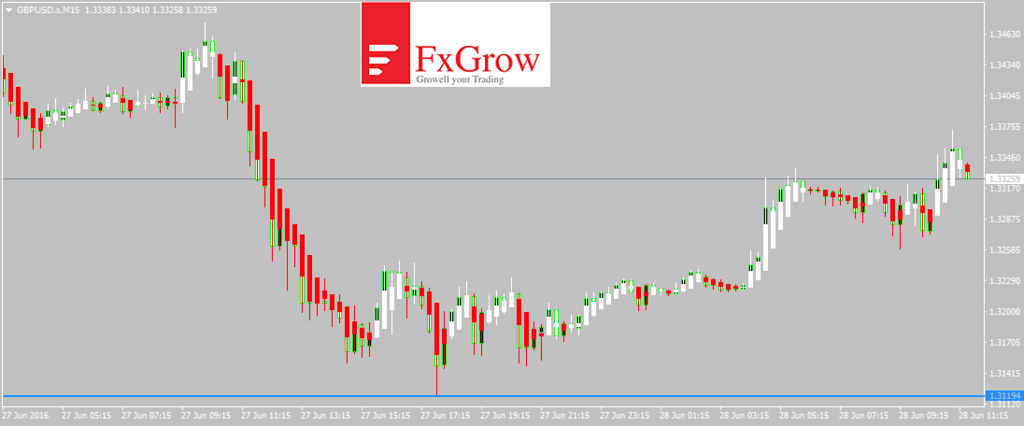
GBPUSD staged a recovery from 1.4090 to cross 1.4200 yesterday. It continues its bearish tone dropping below 1.4150 in the Asian trading session. Some correction is expected in the European trading session and the near term bias is Neutral to bearish with targets of 1.4050

RSI (14), CCI (14), STOCH (9, 6), STOCHRSI (14), ROC indicate a SELL; MACD (12, 26) is Neutral while Average True Range (14) indicates Less Volatility.

Support is at 1.4059 while Resistance is at 1.4257

16th June 2016 – 08:12hrs GMT

For more in depth Research & Analysis please visit FxGrow.http://fxgrow.com/

Note: This analysis is intended to provide general information and does not constitute the provision of INVESTMENT ADVICE. Investors should, before acting on this information, consider the appropriateness of this information having regard to their personal objectives, financial situation or needs. We recommend investors obtain investment advice specific to their situation before making any financial investment decision.
 
Daily Technical Analysis – 16th June, 2016
By FxGrow Research & Analysis Team

AUDUSD

AUDUSD_zpsx9ypzqm9.png


AUDUSD came down yesterday and is presently in the bearish tone trading below 0.7400 handle, the near term bias is bearish with targets of 0.7300 to 0.7250

RSI (14), MACD (12, 26), STOCH (9, 6), ADX (14) indicate a SELL while STOCHRSI (14) is Oversold. Average True Range (14) indicates High Volatility.

Support is at 0.7333 while Resistance is at 0.7425

16th June 2016 – 07:56hrs GMT


USDJPY

USDJPY_zpsty9jqepz.png


USDJPY continues its Bearish trend dropping below 104.50 in the Asian trading session. The near term bias is bearish with targets of 103.50

ADX (14), MACD (12, 26), STOCH (9, 6), STOCHRSI (14) indicate a SELL; while Average True Range (14) indicates High Volatility.

Support is at 103.18 while Resistance is at 104.62

16th June 2016 – 08:17hrs GMT

For more in depth Research & Analysis please visit FxGrow.http://fxgrow.com/

Note: This analysis is intended to provide general information and does not constitute the provision of INVESTMENT ADVICE. Investors should, before acting on this information, consider the appropriateness of this information having regard to their personal objectives, financial situation or needs. We recommend investors obtain investment advice specific to their situation before making any financial investment decision.
 
FxGrow Daily Technical Analysis – 17th June, 2016
By FxGrow Research & Analysis Team

EURUSD
EURUSD_zpswicrcxht.png


EURUSD pushed lower yesterday touching 1.1130 its lowest level this month. After finding support the pair ascended upwards and crossed 1.1200 handle and continues to hold on to its bullish tone. The near term bias is Neutral to bullish with targets of 1.1310

RSI (14), STOCH (9, 6), CCI (14) are Neutral; MACD (12, 26), ROC, MA100 indicate a BUY; while Average True Range (14) indicates Less Volatility.

Support is at 1.1227 while Resistance is at 1.1270 and 1.1281

17th June 2016 – 09:09hrs GMT


GBPUSD
GBPUSD_zpsrmclioqb.png


GBPUSD had a roller coaster drive yesterday as it slipped to lows of 1.4015 and after finding support it staged an upwards rally crossing the 1.4200 handle in the US trading session. It continues to maintain Bullish tone trading above 1.4250 in the European trading session. The near term bias is Bullish with targets of 1.4370

RSI (14), CCI (14), STOCH (9, 6), STOCHRSI (14), MACD (12, 26), ROC indicate a BUY; ADX (14) is Neutral while Average True Range (14) indicates Less Volatility.

Support is at 1.4205 while Resistance is at 1.4373

17th June 2016 – 09:18hrs GMT

For more in depth Research & Analysis please visit FxGrow.http://fxgrow.com/

Note: This analysis is intended to provide general information and does not constitute the provision of INVESTMENT ADVICE. Investors should, before acting on this information, consider the appropriateness of this information having regard to their personal objectives, financial situation or needs. We recommend investors obtain investment advice specific to their situation before making any financial investment decision.
 
FxGrow Daily Technical Analysis – 17th June, 2016
By FxGrow Research & Analysis Team

AUDUSD
AUDUSD_zpsejwaefnd.png


AUDUSD was lower yesterday and touched its base support at 0.7300 after which it recovered and closed above 0.7350 and is presently in the bullish tone trading at 0.7380 levels, the near term bias is Bullish with targets of 0.7400 to 0.7450

RSI (14), MACD (12, 26), STOCHRSI (14), CCI (14) indicate a BUY; ADX (14) is Neutral while Average True Range (14) indicates Less Volatility.

Support is at 0.7285 while Resistance is at 0.7414

17th June 2016 – 09:29hrs GMT


USDJPY
USDJPY_zpszcpv4ack.png


USDJPY had a strong bearish tone yesterday as it slipped to lows of 103.60 and has since then staged a recovery to trade above the 104 handle in the European trading session. The near term bias is bearish with targets of 103.50

RSI (14), ADX (14), MACD (12, 26), STOCH (9, 6) indicate a SELL; STOCHRSI (14) is Oversold while Average True Range (14) indicates Less Volatility.

Support is at 103.54 while Resistance is at 105.62

17th June 2016 – 09:35hrs GMT

For more in depth Research & Analysis please visit FxGrow.http://fxgrow.com/

Note: This analysis is intended to provide general information and does not constitute the provision of INVESTMENT ADVICE. Investors should, before acting on this information, consider the appropriateness of this information having regard to their personal objectives, financial situation or needs. We recommend investors obtain investment advice specific to their situation before making any financial investment decision.
 
FxGrow Daily Technical Analysis – 20th June, 2016
By FxGrow Research & Analysis Team

EURUSD
EURUSD_zpsqjgqnus1.png


EURUSD closed higher at the end of the week and continues its bullish tone crossing 1.1350 in the Asian trading session. The pair is trading in a strong bullish trend trading above its 100day SMA. The near term bias is Bullish with targets of 1.1450

RSI (14), STOCH (9, 6), MACD (12, 26), ADX (14) indicate a BUY; CCI (14) is Neutral while Average True Range (14) indicates Less Volatility.

Support is at 1.1303 while Resistance is at 1.1382 and 1.1397

20th June 2016 – 07:01hrs GMT


GBPUSD
GBPUSD_zpswiwt6g6r.png


GBPUSD closed the week with significant gains and opened up higher this week crossing 1.4500 in the Asian trading session. It continues to maintain Bullish tone trading above 1.4550 in the European trading session. The near term bias is Bullish with targets of 1.4650

RSI (14), CCI (14), STOCH (9, 6), ADX (14), MACD (12, 26), ROC indicate a BUY; while Average True Range (14) indicates Less Volatility.

Support is at 1.4496 while Resistance is at 1.4640

20th June 2016 – 07:07hrs GMT

For more in depth Research & Analysis please visit FxGrow.http://fxgrow.com/

Note: This analysis is intended to provide general information and does not constitute the provision of INVESTMENT ADVICE. Investors should, before acting on this information, consider the appropriateness of this information having regard to their personal objectives, financial situation or needs. We recommend investors obtain investment advice specific to their situation before making any financial investment decision.
 
FxGrow Daily Technical Analysis – 20th June, 2016
By FxGrow Research & Analysis Team

AUDUSD
AUDUSD_zpsdx7cheyi.png


AUDUSD opened this week with a strong bullish tone and is trading above its 100 day SMA of 0.7383 in the Asian trading session. It crossed its daily pivot of 0.7440 and the near term bias is Bullish with targets of 0.7500 to 0.7550

RSI (14), MACD (12, 26), ADX (14), CCI (14) indicate a BUY; STOCH (9, 6) is Overbought while Average True Range (14) indicates Less Volatility.

Support is at 0.7421 while Resistance is at 0.7460

20th June 2016 – 07:15hrs GMT


USDJPY
USDJPY_zpslsejkrlw.png


USDJPY opened this week with a strong bullish tone and is trading above 104.50 in the Asian trading session. It is trading above its 50 day SMA of 104.36 and some correction is expected in the European trading session. The near term bias is Bullish with targets of 105.25

RSI (14), ADX (14), MACD (12, 26), STOCH (9, 6), STOCHRSI (14) indicate a BUY; while Average True Range (14) indicates High Volatility.

Support is at 104.07 while Resistance is at 104.84

20th June 2016 – 07:24hrs GMT

For more in depth Research & Analysis please visit FxGrow.http://fxgrow.com/

Note: This analysis is intended to provide general information and does not constitute the provision of INVESTMENT ADVICE. Investors should, before acting on this information, consider the appropriateness of this information having regard to their personal objectives, financial situation or needs. We recommend investors obtain investment advice specific to their situation before making any financial investment decision.
 
FxGrow Daily Technical Analysis – 21st June, 2016
By FxGrow Research & Analysis Team

EURUSD
EURUSD_zps3n2b5f0e.png


EURUSD had a slight bearish correction yesterday and is now trading in a bullish tone crossing 1.1340 in the Asian trading session. The pair is trading above its 100day SMA of 1.1275; the near term bias is Bullish with targets of 1.1350

RSI (14), STOCH (9, 6), MACD (12, 26), ADX (14), CCI (14) indicate a BUY; STOCHRSI (14) is Overbought while Average True Range (14) indicates Less Volatility.

Support is at 1.1303 while Resistance is at 1.1376 and 1.1382

21st June 2016 – 08:05hrs GMT


GBPUSD
GBPUSD_zps3u8vdqqq.png


GBPUSD continued its strong bullish overtone yesterday and is now trading above the 1.4700 handle in the Asian trading session. Some downside correction is expected in the European trading session. The near term bias is Neutral to Bullish with targets of 1.4750

RSI (14), STOCHRSI (14), MACD (12, 26), ADX (14), CCI (14), ROC indicate a BUY; STOCH (9, 6) is Neutral while Average True Range (14) indicates Less Volatility.

Support is at 1.4657 while Resistance is at 1.4739

21st June 2016 – 08:15hrs GMT

For more in depth Research & Analysis please visit FxGrow.http://fxgrow.com/

Note: This analysis is intended to provide general information and does not constitute the provision of INVESTMENT ADVICE. Investors should, before acting on this information, consider the appropriateness of this information having regard to their personal objectives, financial situation or needs. We recommend investors obtain investment advice specific to their situation before making any financial investment decision.
 
FxGrow Daily Technical Analysis – 21st June, 2016
By FxGrow Research & Analysis Team

AUDUSD
AUDUSD_zpselr0aw79.png


AUDUSD is trading above its 100 day SMA of 0.7409 in the Asian trading session. It is near to its daily pivot of 0.7490 and the near term bias is Bullish with targets of 0.7500 to 0.7550

RSI (14), STOCH (9, 6), MACD (12, 26), ADX (14), CCI (14) indicate a BUY; while Average True Range (14) indicates Less Volatility.

Support is at 0.7430 while Resistance is at 0.7491

21st June 2016 – 08:22hrs GMT

USDJPY
USDJPY_zpsqxj0aduf.png


USDJPY was bearish yesterday as it dropped to lows of 103.80 and is now trading below its 100day SMA of 104.67 in the Asian trading session. The near term bias is Bullish with targets of 105.15

RSI (14), ADX (14), MACD (12, 26), STOCH (9, 6) indicate a BUY; STOCHRSI (14) is Overbought while Average True Range (14) indicates High Volatility.

Support is at 103.58 while Resistance is at 104.84

21st June 2016 – 08:27hrs GMT

For more in depth Research & Analysis please visit FxGrow.http://fxgrow.com/

Note: This analysis is intended to provide general information and does not constitute the provision of INVESTMENT ADVICE. Investors should, before acting on this information, consider the appropriateness of this information having regard to their personal objectives, financial situation or needs. We recommend investors obtain investment advice specific to their situation before making any financial investment decision.
 
FxGrow Daily Technical Analysis – 22nd June, 2016
By FxGrow Research & Analysis Team

EURUSD
EURUSD_zpsyyijruu2.png


EURUSD had a bearish move yesterday as it touched a low of 1.1238 and is now trading just above its 100day SMA of 1.1282 with a mild recovery in the European trading session today. The near term bias is Bullish with targets of 1.1330

RSI (14), STOCH (9, 6), ADX (14), CCI (14), ROC indicate a BUY; STOCHRSI (14) is Overbought while Average True Range (14) indicates Less Volatility.

Support is at 1.1233 while Resistance is at 1.1326 and 1.1342

22nd June 2016 – 12:05hrs GMT


GBPUSD
GBPUSD_zpsm1udofc5.png


GBPUSD continues its bullish trend trading above the 1.4650 handle in the European trading session. The pair is trading above its 100day SMA of 1.4506 and sideways moves are expected. The near term bias is Neutral to Bullish with targets of 1.4700

RSI (14), MACD (12, 26) is Neutral; ADX (14), CCI (14) MA100 indicate a BUY; while Average True Range (14) indicates Less Volatility.

Support is at 1.4656 while Resistance is at 1.4769

22nd June 2016 – 12:10hrs GMT

For more in depth Research & Analysis please visit FxGrow.http://fxgrow.com/

Note: This analysis is intended to provide general information and does not constitute the provision of INVESTMENT ADVICE. Investors should, before acting on this information, consider the appropriateness of this information having regard to their personal objectives, financial situation or needs. We recommend investors obtain investment advice specific to their situation before making any financial investment decision.
 
FxGrow Daily Technical Analysis – 22nd June, 2016
By FxGrow Research & Analysis Team

AUDUSD
AUDUSD_zpsqsvjpa59.png


AUDUSD remained indecisive yesterday as it touched a high of 0.7511 and a low of 0.7448 towards the end of the trading session yesterday. Now it is trading above its 100 day SMA of 0.7431 in the European trading session. The near term bias is Bullish with targets of 0.7530 to 0.7550

RSI (14), MACD (12, 26), ADX (14), CCI (14), Ultimate Oscillator indicate a BUY; STOCH (9, 6), STOCHRSI (14) are Overbought; while Average True Range (14) indicates Less Volatility.

Support is at 0.7445 while Resistance is at 0.7512


22nd June 2016 – 12:16hrs GMT

USDJPY
USDJPY_zps0mcyyvte.png


USDJPY was indecisive yesterday as it touched a low of 103.57 and a high of 105.05 towards the end of the trading session. The pair is now trading above its 100day SMA of 104.40 in the European trading session. The near term bias is Neutral to Bullish with targets of 105.00

RSI (14), STOCH (9, 6), CCI (14) are Neutral; STOCHRSI (14), MACD (12, 26), ADX (14) indicate a BUY; while Average True Range (14) indicates Less Volatility.

Support is at 104.07 while Resistance is at 104.84

22nd June 2016 – 12:22hrs GMT

For more in depth Research & Analysis please visit FxGrow.http://fxgrow.com/

Note: This analysis is intended to provide general information and does not constitute the provision of INVESTMENT ADVICE. Investors should, before acting on this information, consider the appropriateness of this information having regard to their personal objectives, financial situation or needs. We recommend investors obtain investment advice specific to their situation before making any financial investment decision.
 
FxGrow Daily Technical Analysis – 23rd June, 2016
By FxGrow Research & Analysis Team

EURUSD
EURUSD_zpstm0rnda4.png


EURUSD continues its strong Bullish tone in the European trading session today and is now trading above its 100day SMA of 1.1305 with an upside focus towards the end of the trading session. The near term bias is Bullish with targets of 1.1440 to 1.1450

RSI (14), MACD (12, 26), Ultimate Oscillator, ROC indicate a BUY; STOCHRSI (14) and CCI (14) are Overbought while Average True Range (14) indicates Less Volatility.

Support is at 1.1354 while Resistance is at 1.1432 and 1.1432 to 1.1464

23rd June 2016 – 11:00hrs GMT

GBPUSD
GBPUSD_zpsqwuqvzfq.png


GBPUSD continues its strong bullish trend trading above the 1.4850 handle in the European trading session. The pair is trading above its 10day SMA of 1.4801 and some downside correction is expected. The near term bias is Bullish with targets of 1.4950

RSI (14), MACD (12, 26), ADX (14), ROC indicate a BUY; STOCHRSI (14) is Overbought while Average True Range (14) indicates Less Volatility.

Support is at 1.4739 while Resistance is at 1.4945

23rd June 2016 – 11:17hrs GMT

For more in depth Research & Analysis please visit FxGrow.http://fxgrow.com/

Note: This analysis is intended to provide general information and does not constitute the provision of INVESTMENT ADVICE. Investors should, before acting on this information, consider the appropriateness of this information having regard to their personal objectives, financial situation or needs. We recommend investors obtain investment advice specific to their situation before making any financial investment decision.
 
FxGrow Daily Technical Analysis – 23rd June, 2016
By FxGrow Research & Analysis Team

AUDUSD
AUDUSD_zpsfejaxrwj.png


AUDUSD has regained its bullish trend and crossed 0.7550 levels in the European trading session. Now it is trading above its 100 day SMA of 0.7468 with an upside focus towards the 0.7600 handle. The near term bias is Bullish with targets of 0.7600 to 0.7620

RSI (14), STOCH (9, 6), STOCHRSI (14), MACD (12, 26), ADX (14) indicate a BUY; while Average True Range (14) indicates High Volatility.

Support is at 0.7503 while Resistance is at 0.7593

23rd June 2016 – 11:25hrs GMT

USDJPY
USDJPY_zpsdgqvmlop.png


USDJPY maintains its clear uptrend today as it is trading above the 105.50 handle in the European trading session. The pair is now trading above its 100day SMA of 104.48 with an upside focus towards 106 later today. The near term bias is Neutral to Bullish with targets of 106.00

STOCH (9, 6) is Neutral; RSI (14), STOCHRSI (14) and CCI (14) are Overbought; MACD (12, 26), ADX (14), ROC indicate a BUY; while Average True Range (14) indicates High Volatility.

Support is at 105.11 while Resistance is at 106.50

23rd June 2016 – 11:32hrs GMT

For more in depth Research & Analysis please visit FxGrow.http://fxgrow.com/

Note: This analysis is intended to provide general information and does not constitute the provision of INVESTMENT ADVICE. Investors should, before acting on this information, consider the appropriateness of this information having regard to their personal objectives, financial situation or needs. We recommend investors obtain investment advice specific to their situation before making any financial investment decision.
 
FxGrow Daily Technical Analysis – 24th June, 2016
By FxGrow Research & Analysis Team

EURUSD
EURUSD_zpsbpn3n8kc.png


EURUSD touched a high of 1.420 in the early trading hours after which it started its downslide plummeting its 200 day SMA of 1.1271 and further touching lows of 1.0950 in the Asian trading session. The pair has since recovered to trade above 1.1100 handle in the European trading session. The near term bias is Bearish with targets of 1.1040 to 1.1010

RSI (14), STOCH (9, 6), MACD (12, 26), Ultimate Oscillator, ROC indicate a SELL; STOCHRSI (14) and ADX (14) are Neutral while Average True Range (14) indicates High Volatility.

Support is at 1.0992 while Resistance is at 1.1128 and 1.1144

24th June 2016 – 10:16hrs GMT

GBPUSD
GBPUSD_zpswp0ggrrc.png


GBPUSD touched a high of 1.5000 in the early trading session today before posting its biggest decline of more than 10% touching lows of 1.3224 in the Asian trading session. The pair has now recovered some of its losses to trade above 1.3800 handle in the European trading session. The near term bias is Bearish with targets of 1.3700 to 1.3650

RSI (14), STOCH (9, 6), STOCHRSI (14), MACD (12, 26), ROC indicate a SELL; ADX (14), CCI (14) are Neutral; while Average True Range (14) indicates High Volatility.

Support is at 1.3500 while Resistance is at 1.4086

24th June 2016 – 10:27hrs GMT

For more in depth Research & Analysis please visit FxGrow.http://fxgrow.com/

Note: This analysis is intended to provide general information and does not constitute the provision of INVESTMENT ADVICE. Investors should, before acting on this information, consider the appropriateness of this information having regard to their personal objectives, financial situation or needs. We recommend investors obtain investment advice specific to their situation before making any financial investment decision.
 
FxGrow Daily Technical Analysis – 24th June, 2016
By FxGrow Research & Analysis Team

AUDUSD
AUDUSD_zpsizlnxyph.png


AUDUSD was trading above the 0.7600 handle in the early trading session after it started its steep decline breaking the 200 day SMA of 0.7436 in the Asian trading session to touch lows of 0.7320; the near term bias is Bearish with targets of 0.7300 to 0.7280

RSI (14), STOCH (9, 6), STOCHRSI (14), MACD (12, 26), ROC indicate a SELL; while Average True Range (14) indicates High Volatility.

Support is at 0.7327 while Resistance is at 0.7477

24th June 2016 – 10:34hrs GMT

USDJPY
USDJPY_zpskde6cwsm.png


USDJPY crossed the 106 handle in the early trading session today after posing steep decline towards 99 levels in the Asian trading session. The pair is now trading below its 100day SMA of 104.46 at 102.28 in the European trading session. The near term bias is Bearish with targets of 101.00

RSI (14), STOCHRSI (14) MACD (12, 26), ROC indicate a SELL; while Average True Range (14) indicates High Volatility.

Support is at 98.99 while Resistance is at 105.54

24th June 2016 – 10:56hrs GMT

For more in depth Research & Analysis please visit FxGrow.http://fxgrow.com/

Note: This analysis is intended to provide general information and does not constitute the provision of INVESTMENT ADVICE. Investors should, before acting on this information, consider the appropriateness of this information having regard to their personal objectives, financial situation or needs. We recommend investors obtain investment advice specific to their situation before making any financial investment decision.
 
FxGrow Daily Technical Analysis – 27th June, 2016
By FxGrow Research & Analysis Team

EURUSD
EURUSD_zpsqory6kkp.png


EURUSD opened the week lower and dropped to 1.0987 in the Asian trading session. The pair has since recovered to trade above 1.1050 handle in the European trading session. The near term bias is Bullish with targets of 1.1100 to 1.1130

STOCH (9, 6), ADX (14), CCI (14), Ultimate Oscillator indicate a BUY; STOCHRSI (14) is Overbought while Average True Range (14) indicates Less Volatility.

Support is at 1.0911 while Resistance is at 1.1114 and 1.1130

27th June 2016 – 08:14hrs GMT

GBPUSD
GBPUSD_zpsa7roghtv.png


GBPUSD opened the week lower touching 1.3354 in the Asian trading session. The pair continues in a strong bearish momentum and is now trading above the 1.3400 handle in the European trading session. The near term bias is Bearish with targets of 1.3350 to 1.3310

RSI (14), STOCH (9, 6), MACD (12, 26), ADX (14), ROC indicate a SELL; CCI (14) is Neutral; while Average True Range (14) indicates Less Volatility.

Support is at 1.3226 while Resistance is at 1.4012

27th June 2016 – 08:21hrs GMT

For more in depth Research & Analysis please visit FxGrow.http://fxgrow.com/

Note: This analysis is intended to provide general information and does not constitute the provision of INVESTMENT ADVICE. Investors should, before acting on this information, consider the appropriateness of this information having regard to their personal objectives, financial situation or needs. We recommend investors obtain investment advice specific to their situation before making any financial investment decision.
 
FxGrow Daily Technical Analysis – 27th June, 2016
By FxGrow Research & Analysis Team

AUDUSD
AUDUSD_zpsskoeju3f.png


AUDUSD opened the week lower and touched a low of 0.7390 in the Asian trading session. The pair has since recovered and is now trading above the 0.7400 handle in the European trading session, still below its 100day SMA of 0.7485; the near term bias is Bullish with targets of 0.7480 to 0.7500

ADX (14), CCI (14), Ultimate Oscillator indicate a BUY; RSI (14), STOCH (9, 6) are Neutral; while Average True Range (14) indicates Less Volatility.

Support is at 0.7327 while Resistance is at 0.7510

27th June 2016 – 08:29hrs GMT

USDJPY
USDJPY_zpsjotydqts.png


USDJPY opened the week lower and touched a low of 99.90 in the early trading session today after which it has recovered to trade above the 101.50 handle in the European trading session. The near term bias is Neutral with sideways movements and consolidation in the range of 101.50 to 102.00

RSI (14), ADX (14), CCI (14) are Neutral; STOCHRSI (14) is Overbought; while Average True Range (14) indicates Less Volatility.

Support is at 98.99 while Resistance is at 103.58

27th June 2016 – 08:35hrs GMT

For more in depth Research & Analysis please visit FxGrow.http://fxgrow.com/

Note: This analysis is intended to provide general information and does not constitute the provision of INVESTMENT ADVICE. Investors should, before acting on this information, consider the appropriateness of this information having regard to their personal objectives, financial situation or needs. We recommend investors obtain investment advice specific to their situation before making any financial investment decision.
 
FxGrow Daily Technical Analysis – 28th June, 2016
By FxGrow Research & Analysis Team

EURUSD
EURUSD_zpsbrcgbvwm.png


EURUSD is trading in an up channel trend and crossed 1.1070 in the European trading session. The pair is still trading below its 100 day SMA of 1.1173 and the near term bias is Bullish with targets of 1.1100 to 1.1150

RSI (14), STOCH (9, 6), MACD (12, 26), ADX (14), CCI (14), Ultimate Oscillator indicate a BUY; STOCHRSI (14) is Overbought while Average True Range (14) indicates Less Volatility.

Support is at 1.0967 while Resistance is at 1.1090 and 1.1103

28th June 2016 – 08:32hrs GMT

GBPUSD
GBPUSD_zpsssvnxjgb.png


GBPUSD plummeted yesterday to touch lows of 1.3120 after which it found support and started its recovery upwards. In the early Asian trading session the pair crossed the 1.3300 handle and the near term bias is Bullish with targets of 1.3400

STOCH (9, 6), ADX (14), CCI (14), Ultimate Oscillator, ROC indicate a BUY; STOCHRSI (14) is Overbought; while Average True Range (14) indicates Less Volatility.

Support is at 1.3208 while Resistance is at 1.3457

28th June 2016 – 08:44hrs GMT

For more in depth Research & Analysis please visit FxGrow.http://fxgrow.com/

Note: This analysis is intended to provide general information and does not constitute the provision of INVESTMENT ADVICE. Investors should, before acting on this information, consider the appropriateness of this information having regard to their personal objectives, financial situation or needs. We recommend investors obtain investment advice specific to their situation before making any financial investment decision.
 
FxGrow Daily Technical Analysis – 28th June, 2016
By FxGrow Research & Analysis Team

AUDUSD
AUDUSD_zpsv0uwm2zz.png

AUDUSD was bearish yesterday and touched a low of 0.7327 after which it found support and has recovered to trade above the 0.7400 handle in the European trading session. The pair is trading below its 100 day SMA of 0.7462 and the near term bias is Neutral to Bullish with targets of 0.7450

RSI (14), MACD (12, 26) is Neutral; ADX (14), CCI (14), Ultimate Oscillator, ROC indicate a BUY; STOCH (9, 6), STOCHRSI (14) are Overbought; while Average True Range (14) indicates Less Volatility.

Support is at 0.7359 while Resistance is at 0.7430

28th June 2016 – 08:52hrs GMT

USDJPY
USDJPY_zps7kzrcs63.png


USDJPY is moving in a zigzag pattern with no clear direction since yesterday. The pair is holding onto its crucial support levels of 100 and trading below its 100 day SMA of 103.32 in the European trading session. The near term bias is Neutral to Bullish with targets of 102.75

STOCH (9, 6), MACD (12, 26), ADX (14), CCI (14) indicate a BUY; RSI (14) is Neutral; STOCHRSI (14) is Overbought; while Average True Range (14) indicates High Volatility.

Support is at 101.90 while Resistance is at 102.64

28th June 2016 – 09:01hrs GMT

For more in depth Research & Analysis please visit FxGrow.http://fxgrow.com/

Note: This analysis is intended to provide general information and does not constitute the provision of INVESTMENT ADVICE. Investors should, before acting on this information, consider the appropriateness of this information having regard to their personal objectives, financial situation or needs. We recommend investors obtain investment advice specific to their situation before making any financial investment decision.
 
FxGrow Daily Technical Analysis – 29th June, 2016
By FxGrow Research & Analysis Team

EURUSD
5xrhnq.jpg


EURUSD is finding support and trading above 1.1050 in the Asian trading session. Upwards movements are capped below 1.1100 levels. The pair is trading below its 100 day SMA of 1.1120 and the near term bias is Neutral to Bearish with range bound moves in the region of 1.1100 to 1.1000

RSI (14), CCI (14) is Neutral; STOCH (9, 6), STOCHRSI (14), Ultimate Oscillator indicate a SELL; while Average True Range (14) indicates Less Volatility.

Support is at 1.1034 while Resistance is at 1.1098 and 1.1111

29th June 2016 – 06:44hrs GMT

GBPUSD
mkf8sn.jpg


GBPUSD made a recovery yesterday as it crossed the 1.3350 handle and is today trading at the same levels in the Asian trading session. The pair is trading above its 50 day SMA of 1.3296 in the European trading session. The near term bias is Neutral to Bullish with targets of 1.3400

RSI (14), ADX (14), CCI (14) are Neutral; MACD (12, 26), Ultimate Oscillator, ROC indicate a BUY; STOCHRSI (14) is Overbought; while Average True Range (14) indicates Less Volatility.

Support is at 1.3232 while Resistance is at 1.3382

29th June 2016 – 08:53hrs GMT

For more in depth Research & Analysis please visit FxGrow.http://fxgrow.com/

Note: This analysis is intended to provide general information and does not constitute the provision of INVESTMENT ADVICE. Investors should, before acting on this information, consider the appropriateness of this information having regard to their personal objectives, financial situation or needs. We recommend investors obtain investment advice specific to their situation before making any financial investment decision.
 
FxGrow Daily Technical Analysis – 29th June, 2016
By FxGrow Research & Analysis Team

AUDUSD
1hv8up.jpg


AUDUSD remained indecisive yesterday as it touched a high of 0.7415 and a low of 0.7341 towards the end of the trading session. Today Aussie showed some signs of recovery with the pair crossing 0.7400 handle in the European trading session. The near term bias is Neutral to Bullish with targets of 0.7450

RSI (14), ADX (14), CCI (14) are Neutral; STOCH (9, 6), STOCHRSI (14), MACD (12, 26) ROC indicate a BUY; while Average True Range (14) indicates Less Volatility.

Support is at 0.7359 while Resistance is at 0.7415

29th June 2016 – 06:59hrs GMT

USDJPY
2ymshlc.jpg


USDJPY was bullish yesterday but advances were capped below 103 handle. Today the pair is pushing down to below 102.50 levels in the European trading session. The pair is trading below its 100 day SMA of 102.87 in the European trading session. The near term bias is Neutral to Bearish with targets of 102

RSI (14) is Neutral; STOCH (9, 6), ADX (14), CCI (14), ROC indicate a SELL; STOCHRSI (14) is Oversold; while Average True Range (14) indicates Less Volatility.

Support is at 101.92 while Resistance is at 102.49

29th June 2016 – 07:06hrs GMT

For more in depth Research & Analysis please visit FxGrow.http://fxgrow.com/

Note: This analysis is intended to provide general information and does not constitute the provision of INVESTMENT ADVICE. Investors should, before acting on this information, consider the appropriateness of this information having regard to their personal objectives, financial situation or needs. We recommend investors obtain investment advice specific to their situation before making any financial investment decision.
 
Top