FxGrow Daily Technical Analysis – 29th July, 2016
By FxGrow Research & Analysis Team
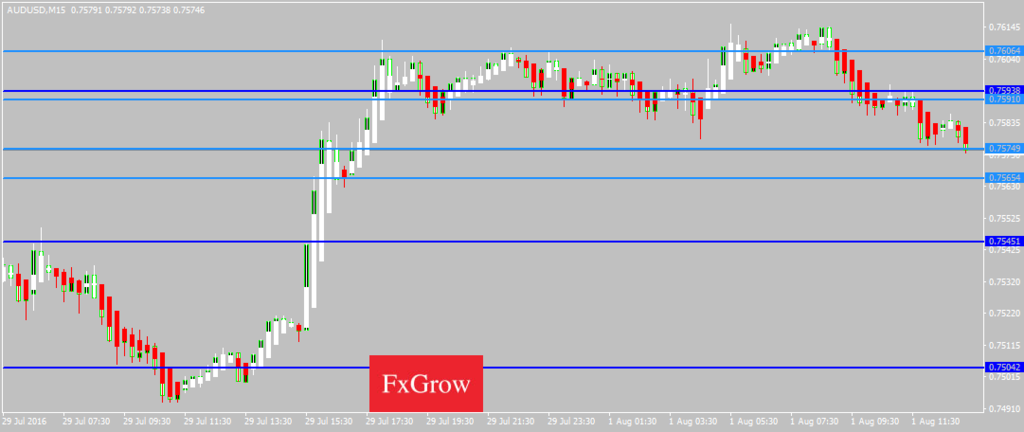
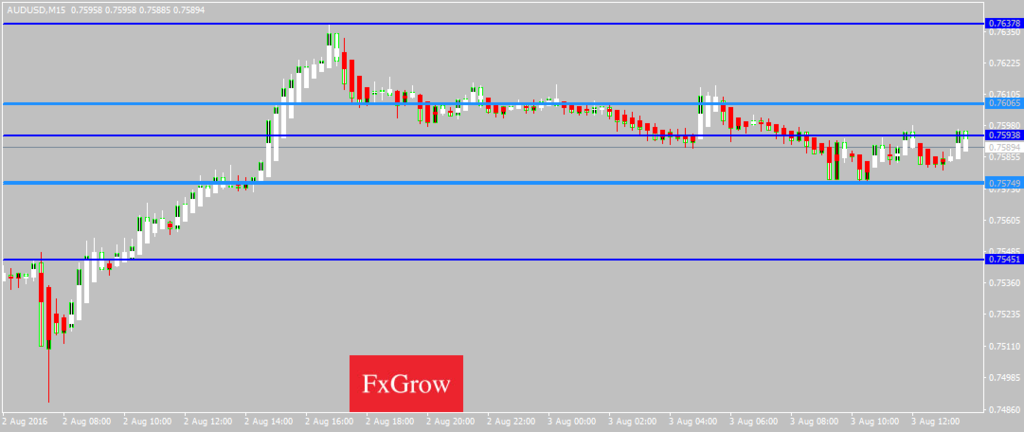
AUDUSD
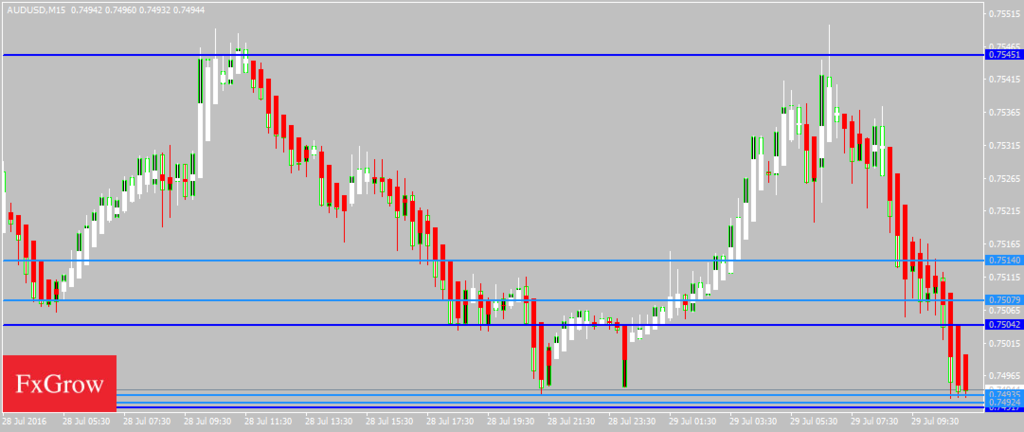
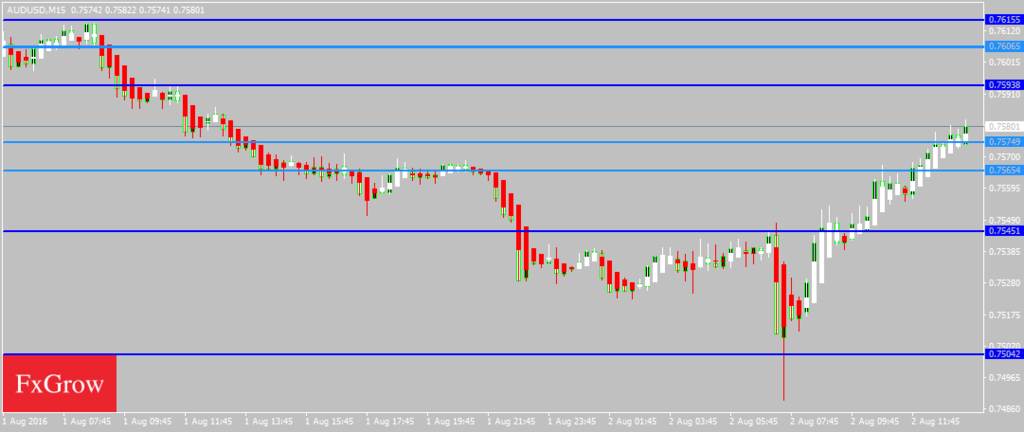
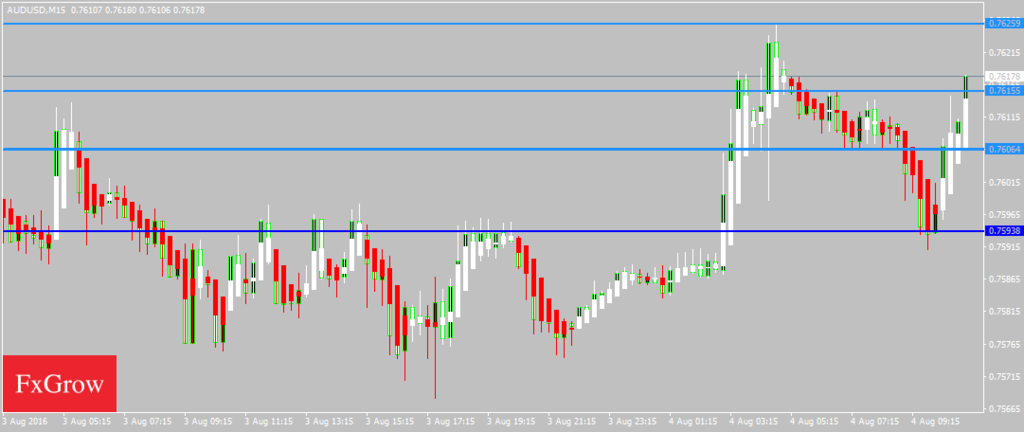
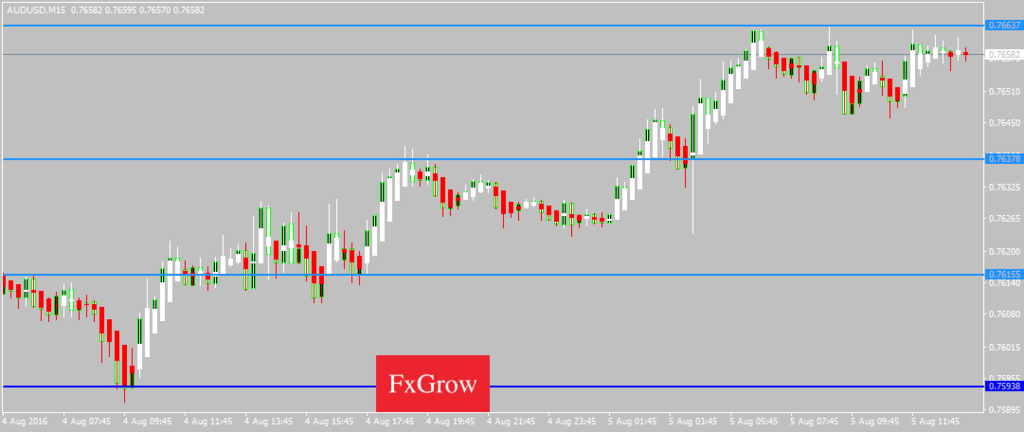
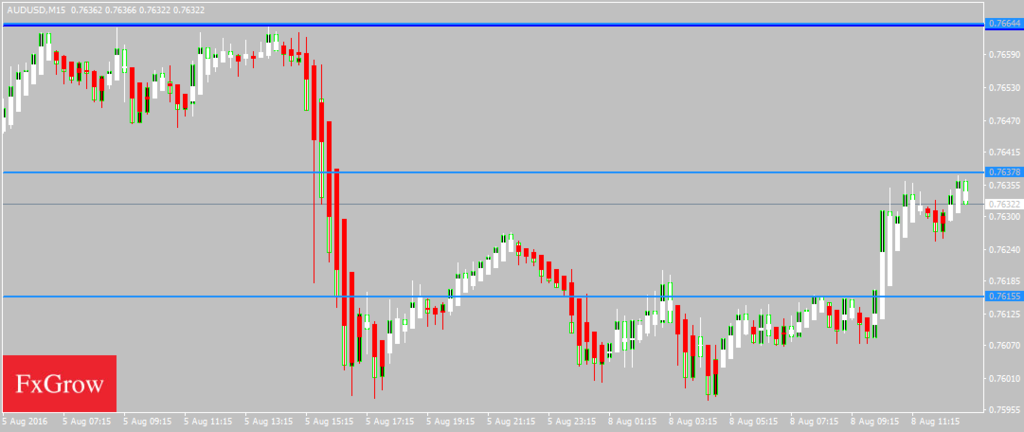
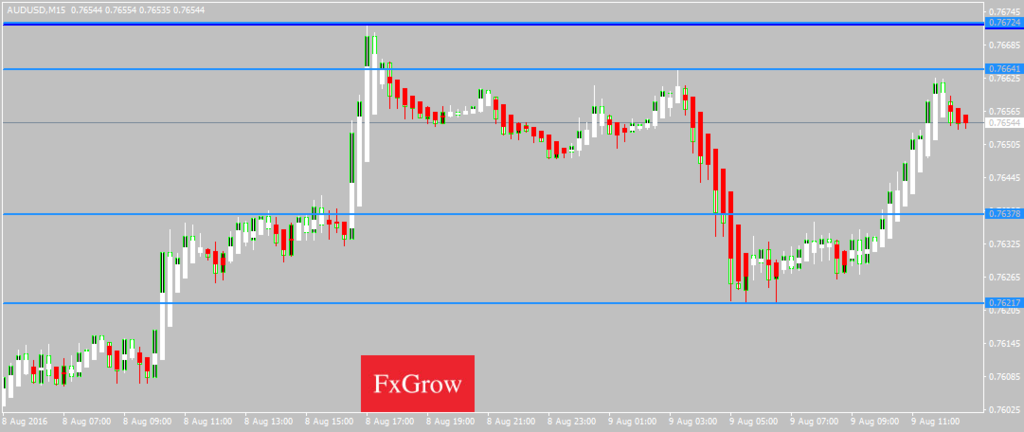
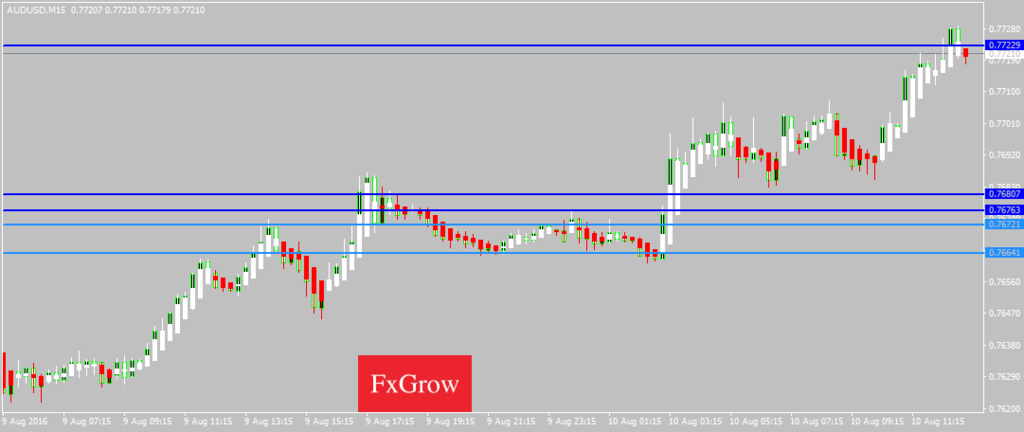
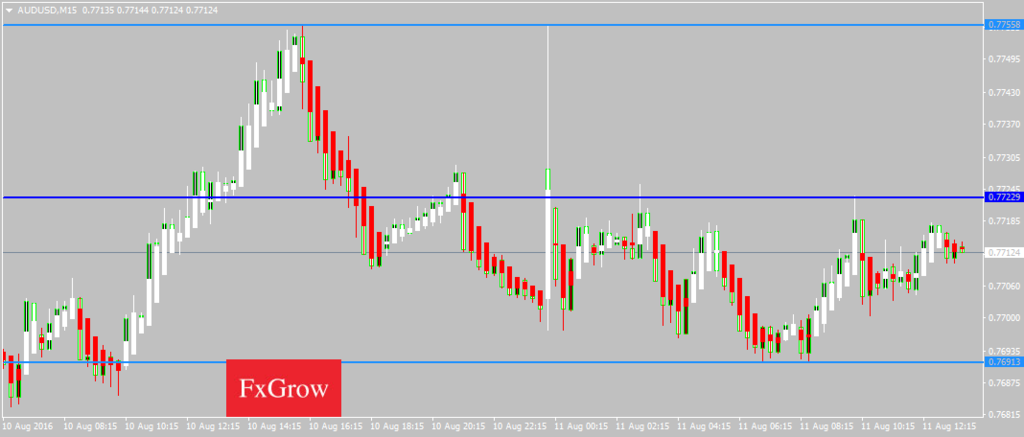
AUDUSD was indecisive yesterday as it touched a high of 0.7547 and a low of 0.7493 towards the end of the trading session. AUDUSD is moving in a mild bearish tone after touching an intraday high of 0.7548 and is now trading below its 100day SMA of 0.7500 in the European trading session. The near term bias is Neutral to Bearish with targets of 0.7450 to 0.7400
RSI (14), STOCH (9, 6), CCI (14), Ultimate Oscillator, ROC indicate a SELL; ADX (14) is Neutral; STOCHRSI (14) is Oversold; while Average True Range (14) indicates High Volatility.
Support is at 0.7493 while Resistance is at 0.7511 and 0.7545
29th July 2016 – 08:30AM (UTC)
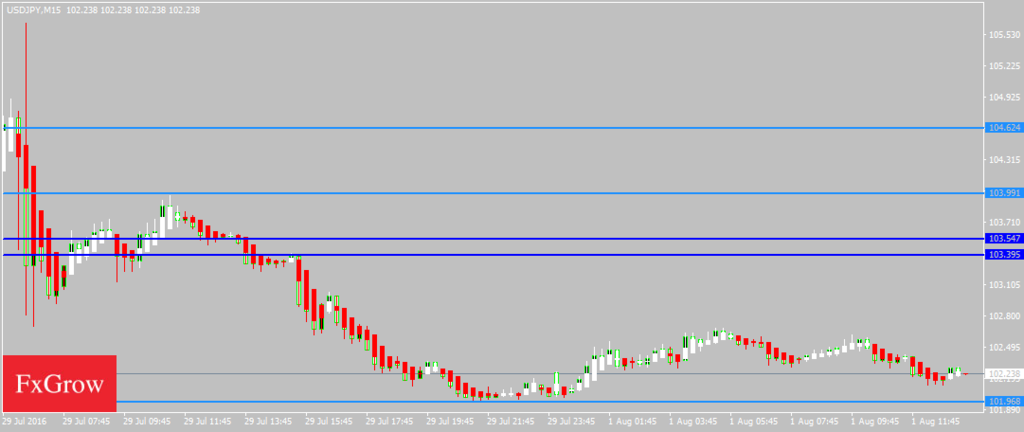
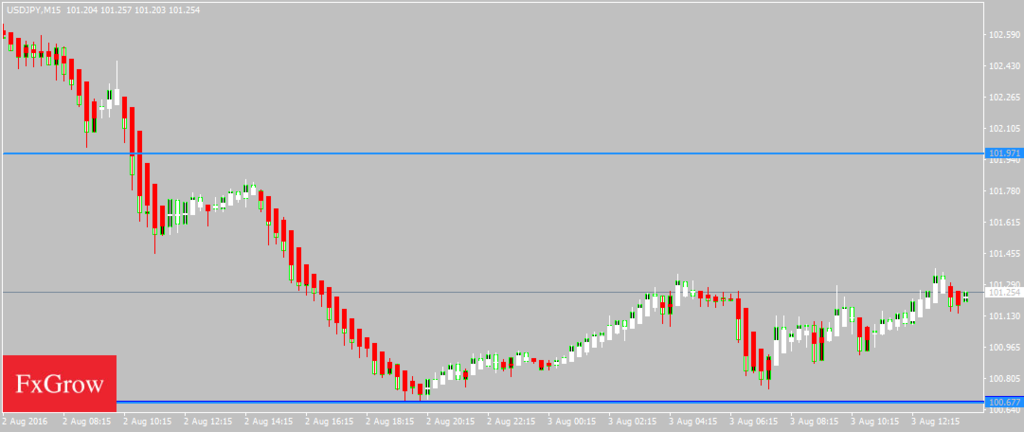
USDJPY
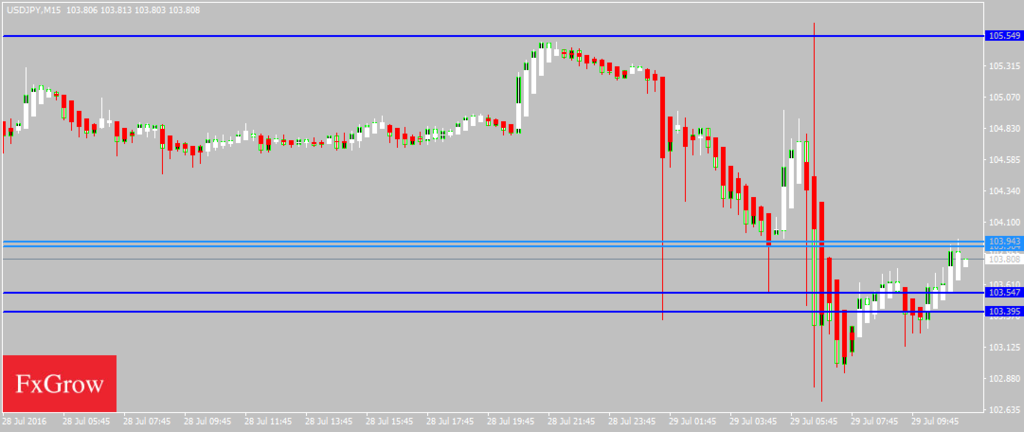
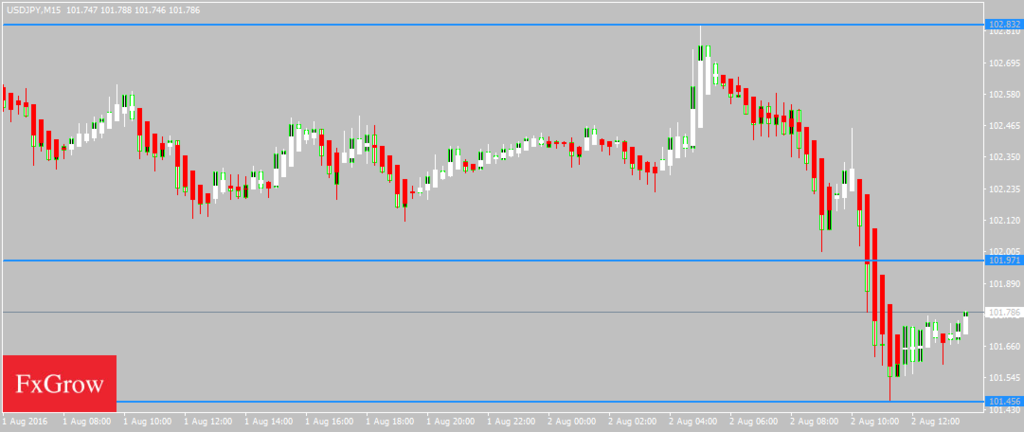
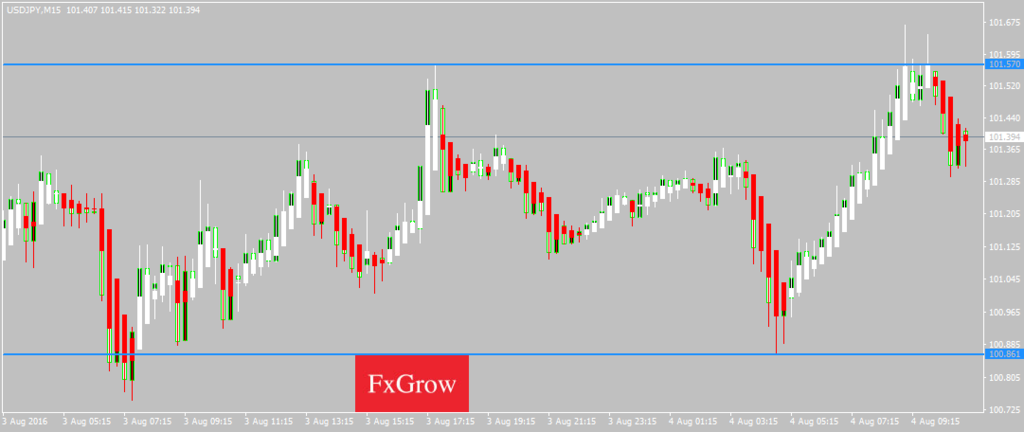
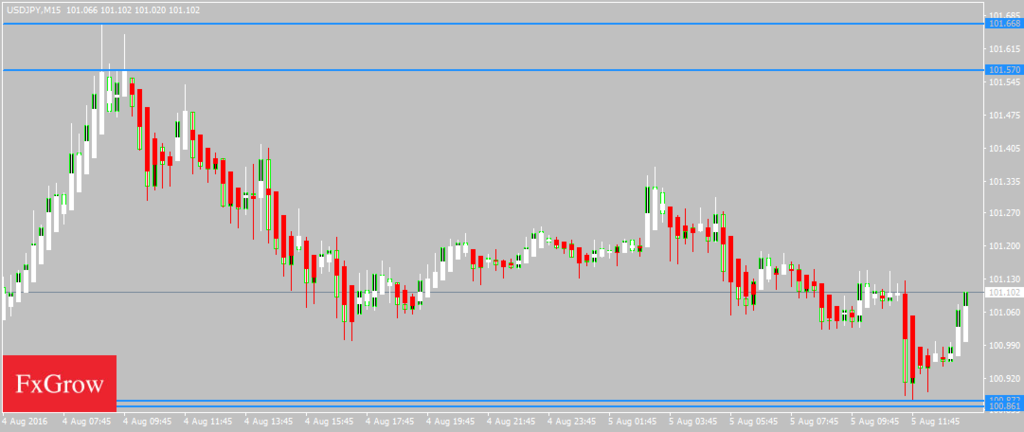
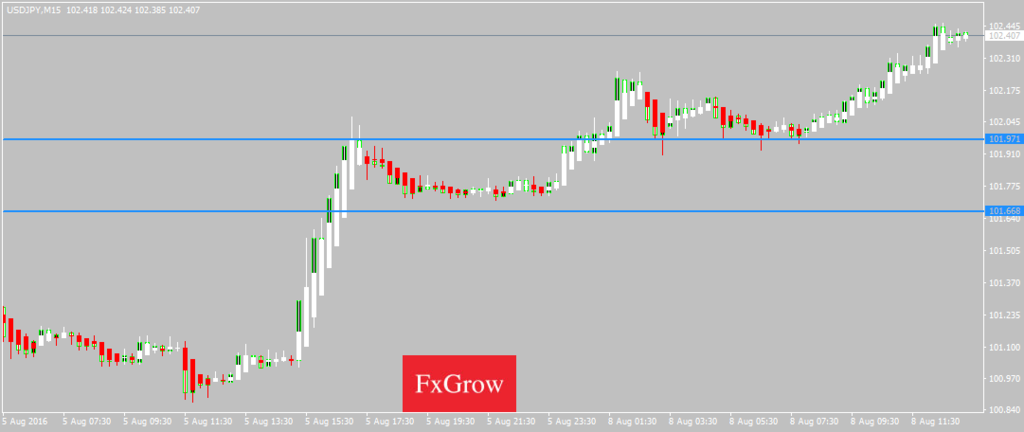
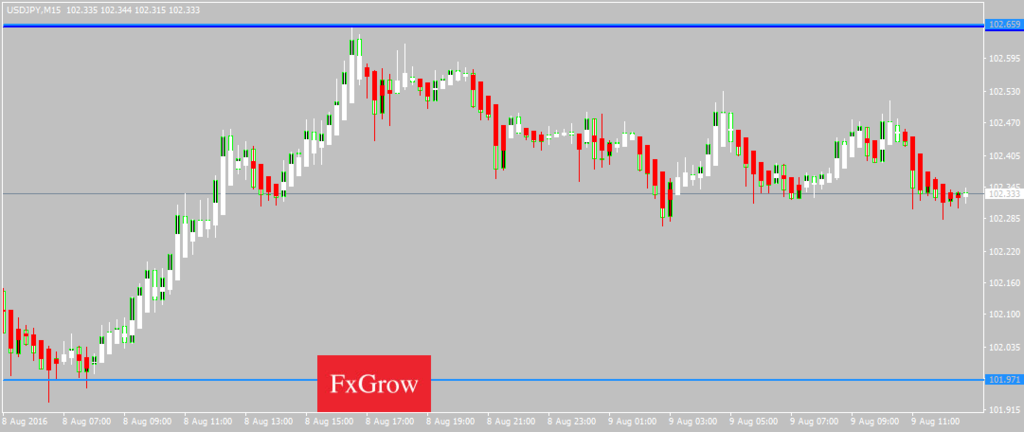
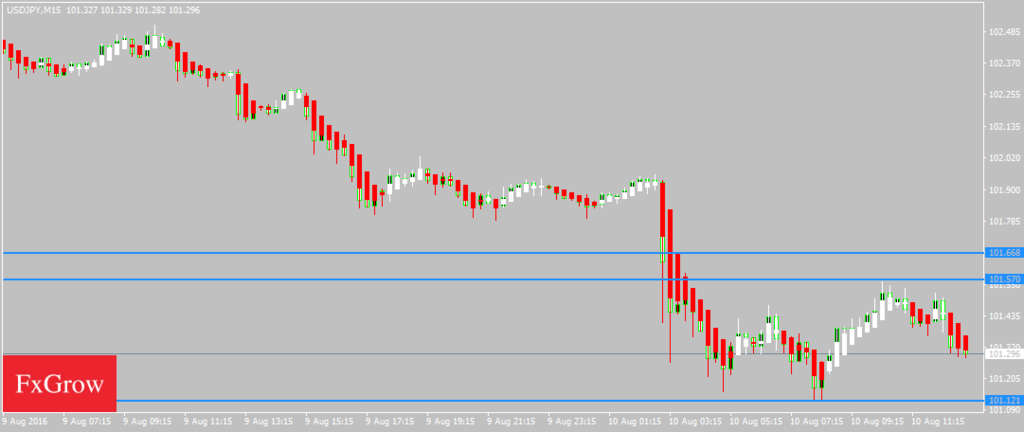
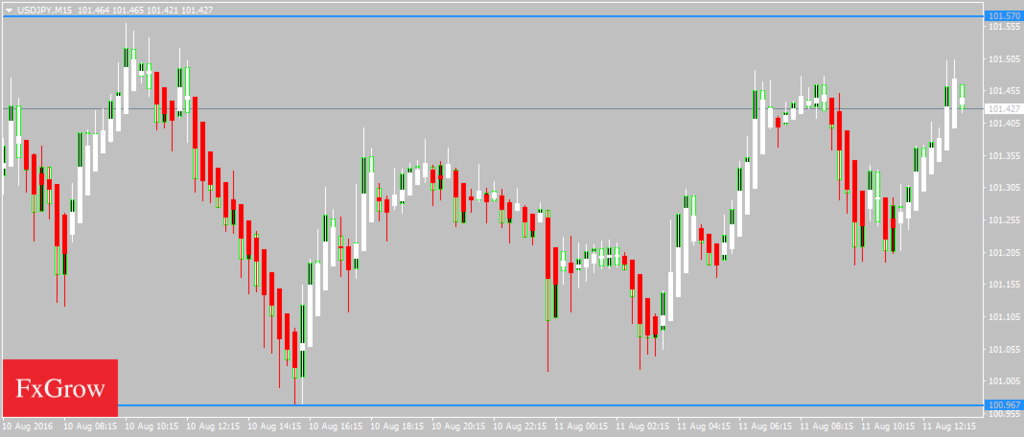
USDJPY traded in a narrow range yesterday as it remained above its support levels of 104.50 towards the end of the trading session. Dollar-Yen is moving in a strong bearish tone as it touched an intraday low of 102.96 and is now trading below its 100day SMA of 105.08 in the European trading session. The near term bias is Bearish with targets of 103
RSI (14), STOCH (9, 6), STOCHRSI (14), MACD (12, 26), CCI (14), ROC indicate a SELL; ADX (14), Ultimate Oscillator are Neutral; while Average True Range (14) indicates High Volatility.
Support is at 103.39 while Resistance is at 104.32 and 105.54
29th July 2016 – 08:38AM (UTC)
For more in depth Research & Analysis please visit FxGrow.http://fxgrow.com/analysis-educatio...alysis-fxgrow-free-forex-analysis-tools#close
Note: This analysis is intended to provide general information and does not constitute the provision of INVESTMENT ADVICE. Investors should, before acting on this information, consider the appropriateness of this information having regard to their personal objectives, financial situation or needs. We recommend investors obtain investment advice specific to their situation before making any financial investment decision.
By FxGrow Research & Analysis Team
AUDUSD
AUDUSD was indecisive yesterday as it touched a high of 0.7547 and a low of 0.7493 towards the end of the trading session. AUDUSD is moving in a mild bearish tone after touching an intraday high of 0.7548 and is now trading below its 100day SMA of 0.7500 in the European trading session. The near term bias is Neutral to Bearish with targets of 0.7450 to 0.7400
RSI (14), STOCH (9, 6), CCI (14), Ultimate Oscillator, ROC indicate a SELL; ADX (14) is Neutral; STOCHRSI (14) is Oversold; while Average True Range (14) indicates High Volatility.
Support is at 0.7493 while Resistance is at 0.7511 and 0.7545
29th July 2016 – 08:30AM (UTC)
USDJPY
USDJPY traded in a narrow range yesterday as it remained above its support levels of 104.50 towards the end of the trading session. Dollar-Yen is moving in a strong bearish tone as it touched an intraday low of 102.96 and is now trading below its 100day SMA of 105.08 in the European trading session. The near term bias is Bearish with targets of 103
RSI (14), STOCH (9, 6), STOCHRSI (14), MACD (12, 26), CCI (14), ROC indicate a SELL; ADX (14), Ultimate Oscillator are Neutral; while Average True Range (14) indicates High Volatility.
Support is at 103.39 while Resistance is at 104.32 and 105.54
29th July 2016 – 08:38AM (UTC)
For more in depth Research & Analysis please visit FxGrow.http://fxgrow.com/analysis-educatio...alysis-fxgrow-free-forex-analysis-tools#close
Note: This analysis is intended to provide general information and does not constitute the provision of INVESTMENT ADVICE. Investors should, before acting on this information, consider the appropriateness of this information having regard to their personal objectives, financial situation or needs. We recommend investors obtain investment advice specific to their situation before making any financial investment decision.