• The Forex, Binary Options Forum - welcomes you to our Community!

    DigitalCashPalace Forum is dedicated to discussions about Forex, Binary Options, commodities, stocks related.

    Please take a look around, and feel free to .

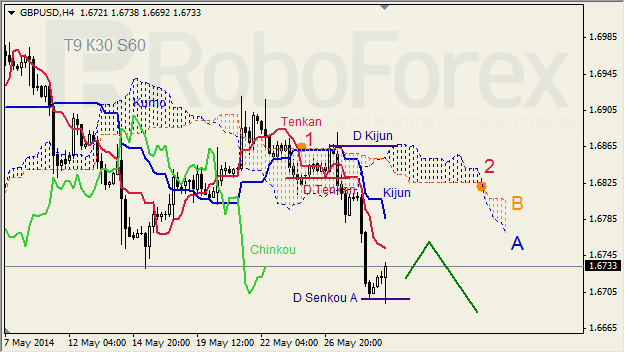
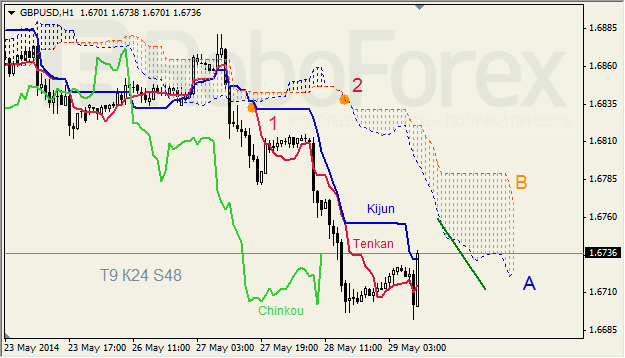
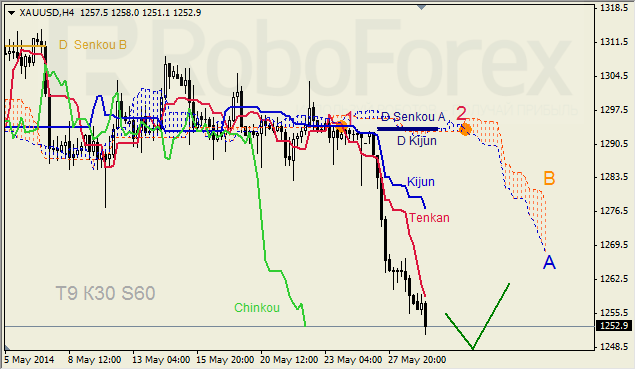
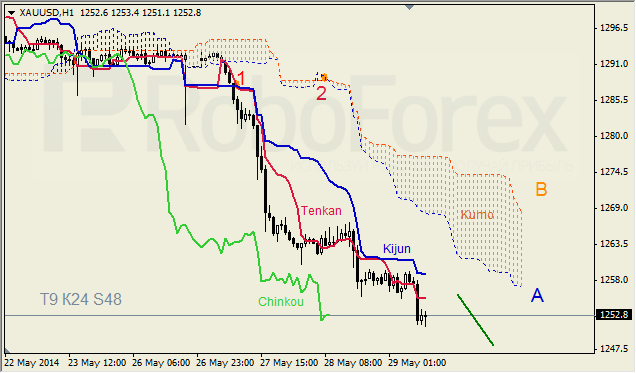
My Ichimuko Analysis

Analysis for May 29th, 2014

GBP USD, “Great Britain Pound vs US Dollar”

GBP USD, Time Frame H4. Tenkan-Sen and Kijun-Sen are influenced by “Dead Cross” (1); all lines are directed downwards. Ichimoku Cloud is going down, and Chinkou Lagging Span is below the chart. Short‑term forecast: we can expect resistance from Tenkan-Sen – Kijun-Sen, and decline of the price.

gbp_usdich1.png
 
GBP USD, Time Frame H1. Tenkan-Sen and Kijun-Sen are influenced by “Dead Cross” (1); Tenkan-Sen and Senkou Span A are directed upwards. Ichimoku Cloud is down (2), and Chinkou Lagging Span is below the chart. Short‑term forecast: we can expect resistance from Senkou Span A.

gbp_usdich2.png
 
XAU USD, “Gold vs US Dollar”

XAU USD, Time Frame H4. Tenkan-Sen and Kijun-Sen are influenced by “Dead Cross” (1); all lines are directed downwards. Ichimoku Cloud is going down (2), Chinkou Lagging Span is far below the chart, and the price is below the lines. Short-term forecast: we can expect decline of the price.


goldich1.png
 
XAU USD, Time Frame H1. Tenkan-Sen and Kijun-Sen are influenced by “Dead Cross” (1). Ichimoku Cloud is going down (2), and Chinkou Lagging Span is below the chart. Short‑term forecast: we can expect resistance from Tenkan-Sen, and decline of the price.

goldich2.png
 
EUR USD, “Euro vs US Dollar”

H4 chart of EUR USD shows descending trend. Bearish Three Methods pattern indicates descending movement. Three Line Break chart and Heiken Ashi candlesticks confirm descending trend.

eur_usdjap1.png
 
H1 chart of EUR USD shows descending trend. Bearish Tweezers pattern, Three Line Break chart, and Heiken Ashi candlesticks confirm descending trend.

eur_usdjap2.png
 
USD JPY, “US Dollar vs Japanese Yen”

At H4 chart of USD JPY, Bearish Three Methods continuation pattern, Three Line Break chart, and Heiken Ashi candlesticks confirm descending movement.

usd_jpyjap1.png
 
H1 chart of USD JPY shows bearish tendency. Closest Window is resistance level. Three Line Break chart and Heiken Ashi candlesticks confirm bearish tendency.

usd_jpyjap2.png
 
Top