• The Forex, Binary Options Forum - welcomes you to our Community!

    DigitalCashPalace Forum is dedicated to discussions about Forex, Binary Options, commodities, stocks related.

    Please take a look around, and feel free to .

Market analysis and trade recommendations by FBS

GBP/USD Daily Analytics
10:12 05.04.2018

1522922513-346e2f1925eabf9e1b6f1728368b7247_1200x1200_q90v3.png


The price is consolidating between the 34 & 55 Moving Averages. Also, there's a 'Flag' pattern, so the pair is likely going to test the closest support at 1.3982 - 1.3228. Meanwhile, if a pullback from this area forms little later on, there'll be a moment for an upward price movement in the direction of the next resistance at 1.4096 - 1.4144.

1522922512-5b4ebea2b9222ba9b6e4f069176b18fd_1200x1200_q90v3.png


There's a consolidation, which is taking place between the levels 1.4010 - 1.4096. It's likely that the pair is going to test the nearest resistance at 1.4069 - 1.4096. A pullback from these levels could be a starting point for a bearish price movement towards another support at 1.4027 - 1.4010.

More:
https://tinyurl.com/ybfd2ym3
 
EUR/USD Daily Analyics
13:49 05.04.2018

1522935904-7ba77d39c3f39bb2a171fd1b564f6e3a_1200x1200_q90v3.png


There's still no any reversal pattern so far, which means the pair is likely going to continue declining. However, if a pullback from the nearest support area forms little later on, there'll be an opportunity to have an upward correction.

1522935904-5876e697dd46ee6a4fccb4ec970e1da5_1200x1200_q90v3.png


We've got a bearish 'Engulfing' pattern, which has been confirmed. So, the market is likely going to continue declining in the direction of the lower 'Window'.

More:
https://tinyurl.com/y7lu4z3g
 
USD/JPY Daily Analytics
13:53 05.04.2018

1522935904-16c98bde6ad195915f49e113a4d3fce4_1200x1200_q90v3.png


The last bullish 'Hammer' led to the current upward price movement. However, if we have a pullback from the nearest resistance area, there'll be time for a bearish correction towards the Moving Averages.

1522935903-15dab119d88367af5a34150bd8e1c3ca_1200x1200_q90v3.png


There's a 'Gravestone Doji', which has been formed at the last local high. Meanwhile, if a pullback from the closest support forms in the coming hours, bulls are likely going to deliver a new local high.

More:
https://tinyurl.com/y7q98jge
 
APRIL OUTLOOK ON THE FX MARKET
15:06 05.04.2018
Trade wars tensions are creating a high volatility in the FX market. Risk-on and risk-off sentiments make currencies rise and fall. However, not only trade wars affect the market. There are a lot of events that will support and weight on currencies this month.

We offer you a short outlook on April events.

USD

US steel and aluminum tariffs exacerbate further what are already tense ties between markets. The US tariffs met retaliations from other countries. For example, China enacted charges on 128 US goods. As a result, tensions between two largest world’s economies put pressure not only on the US dollar and Chinese yuan but also on the Australian dollar, Canadian dollar and Japanese yen.

The US dollar had been suffering from volatility for the previous month.

Besides trade wars issue, NAFTA negotiations were a driver of the greenback’s movement.

According to talks, Mr. Trump plans to agree on a previous version of the new NAFTA agreement to the middle of April. If negotiations are successful, it will support not only the greenback but Canadian dollar too. Pay attention to the Eighth Summit of the Americas that will be held on April 13 and 14, 2018. There is a high possibility that NAFTA parties will discuss the agreement there.

As you know, the Fed raised an interest rate in March. To assess a result of that decision, investors will look at inflation data (CPI m/m and Core CPI m/m on April 11 at 15:30 MT time). The Fed is anticipated to lift the interest rate at least 2 times this year, so the CPI figures will display if there is any reason to increase it to 3 times.

JPY

In March Haruhiko Kuroda was reappointed as the BOJ Governor. Mr. Kuroda is famous for his dovish policy. As a natural result, the Bank of Japan is anticipated to keep an interest rate on hold, that puts pressure on the yen.

Last month the USD/JPY pair fell to 104.625, so the yen reached new highs that is not good for the Japanese economy. Tankan manufacturing index and non-manufacturing index data appeared to be weaker for the first time in two years. Large Japanese manufacturers displayed a concern because of the strong yen as it negatively affects manufacturers.

An important event for this month is the BOJ policy rate on April 27. The possibility of the rate hike is still low as firstly the central bank has to taper its quantitative easing policy. However, the Governor may give some clues on the future monetary policy.
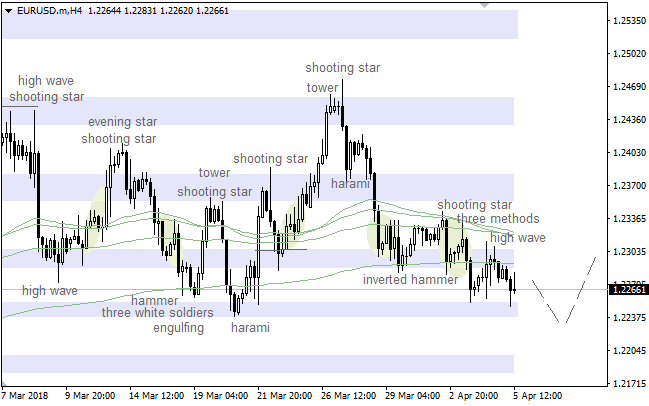
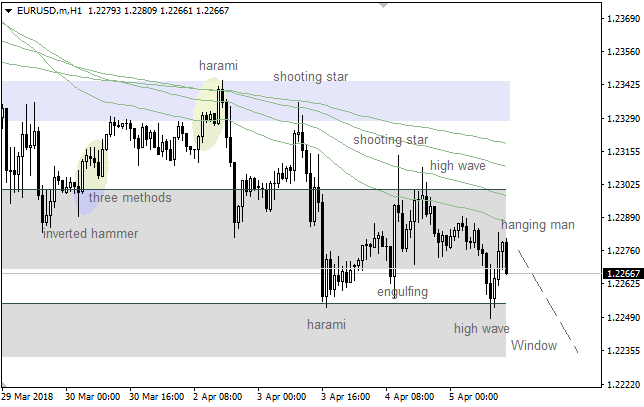
EUR

Trade wars covered not only Chinese and American economies but the European as well. After Trump’s move, the European Union claimed that it is going to impose 25% tariffs on $3.5 billion of American goods. So the previous month was risky for the euro.

The beginning of a new quarter appeared to be difficult for the European currency as well.

The European central bank has hinted on the soon quantitative easing tapering. Let’s look at the interest rate announcement on April 26 at 14:45 MT time. Mario Draghi may give prompts on the monetary policy.

GBP

The pound is showing good results. The UK currency managed to rise based on the positive economic data. However, March was not easy for the currency. Its rate highly depended on the Brexit negotiations. This month will not be an exclusion. If parties find areas of common interest, talks could start.

AUD

In March the Australian dollar plunged to the level of December 2017. The beginning of April is quite positive for the aussie but as you know, a positive trend cannot continue forever. Rate hikes always support domestic currencies. However, as we know the Reserve Bank of Australia does not plan to raise the interest rate until the end of 2018 that can have a negative impact on the aussie.

The RBA explains its decision at the meeting minutes. Follow monetary policy meeting minutes on April 17 at16:30 MT time.

Moreover, the Australian inflation is still below its target of 2-3%. Let’s look at the CPI q/q on April 24 at 4:30 MT time.

NZD

The New Zealand dollar tightly correlated with the US dollar and the Australian dollar.

The second quarter of this year began on a positive note for the New Zealand dollar. This month we do not anticipate a lot of crucial data from New Zealand. However, to predict the kiwi’s direction, you should pay attention to the US economic data. Moreover, follow trade wars news to predict the kiwi’s movement.

CAD

The environment of uncertainty around NAFTA negotiations affected the Canadian dollar. Canada was excluded from the US tariffs, however, it could not prevent the loonie from volatility. If NAFTA’s parties hammer out a deal this month, trade wars tensions will decline, the Canadian dollar will be able to rise.

Canada is one of the top oil producers in the world. So the loonie highly depends on the oil prices. When oil prices go up, the Canadian dollar rises. The OPEC and its allies are trying to control the oil output, however, US crude oil inventories put pressure on the oil market. As soon as the amount of US producers rise, the oil prices decline. The continuation of such rise will negatively affect the market and the Canadian dollar too.

There is a low chance that the Bank of Canada will increase the interest rate this month, however, Governor’s comments are highly important. Look at the BOC monetary policy report at 17:00 MT time on April 18.

Making a conclusion, we highly recommend you to follow the trade wars news to get ideas of the general currencies movement. Furthermore, do not forget about economic data that are crucial for your fundamental analysis.

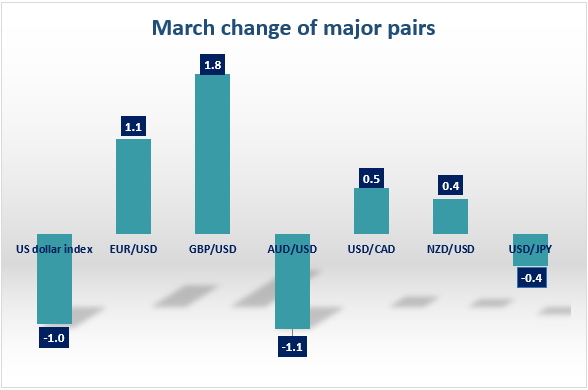
Extra: monthly change of the major currency pairs

1522940708-a58849bb9954b93bb9c3f3a050ddfe95_1200x1200_q90v3.png


More:
https://tinyurl.com/ybjr73ma
 
AUD/USD Daily Analytics
07:05 06.04.2018

Technical levels: support – 0.7610, 0.7660; resistance – 0.7690

Trade recommendations:

Sell — 0.7650; SL — 0.7670; TP1 — 0.7580; TP2 — 0.7530.
Reason: expanding bearish Ichimoku Cloud with falling Senkou Span A; a golden cross of Tenkan-sen and Kijun-sen, but the prices are had entered into the negative area.

1522998332-42a68b4bfa2f0515dfbaa054e9dbae66_1200x1200_q90v3.png


More:
https://tinyurl.com/y966mvz7
 
USD/JPY Daily Analytics
07:07 06.04.2018
Technical levels: support – 106.80; resistance – 107.50.

Trade recommendations:

Sell — 107.50; SL — 107.70; TP1 — 106.80; TP2 — 106.30.
Reason: bullish Ichimoku Cloud with horizontal Senkou Span A and B; a golden cross of Tenkan-sen and Kijun-sen, but the lines are horizontal; the market is overbought and under the strong daily resistance.

1522998332-3dcc4d3b0e9d38341d309e86e7227f36_1200x1200_q90v3.png


More:
https://tinyurl.com/y9gsed4f
 
EUR/USD Daily Analytics
07:30 06.04.2018
Recommendation:

SELL 1.2315 SL 1.237 TP1 1.2215 TP2 1.2095 TP3 1.205

SELL 1.2215 SL 1.227 TP1 1.2115 TP2 1.2095 TP3 1.205

On the daily chart of EUR/USD, bears made the first attempt to pull the pair below support at 1.2245. As a result, it formed the junior pattern “Widening wedge”. To continue the decline the pair has to fall below April minimum.

1522999643-8afba167b3e7c15d0d5d28d0f3c7b966_1200x1200_q90v3.png


On H1, there’s a “Widening wedge”. Pullbacks to 23.8%, 38.2% and 50% as usually are used for selling with targets at 78.6% of the Gartley pattern. At the same time, advance above 1.2417 will increase the odds of uptrend’s resumption.

1522999659-144c086f9efd0dd7367f2818eb875c0e_1200x1200_q90v3.png


More:
https://tinyurl.com/y8y5lbwl
 
EUR/GBP Daily Analytics
07:40 06.04.2018
Recommendation:

SELL 0.8715

SL 0.8770

TP1 0.8615 TP2 0.8590

On the daily chart, EUR/GBP keeps forming a 5-0 pattern. After a pullback to 38.2% of the wave CD of the “Shark” pattern, the initiative returned to bears. At the moment, the inside bars are formed. They point at uncertainty.

1523000297-bc1ce4ebdd72b71af2881b8edc2b5fe5_1200x1200_q90v3.png


On H1, EUR/GBP is consolidating in the 0.8715-0.8755 range. A break of its lower border will create grounds for a “Crab” pattern with a target of 161.8%. On the other hand, successful test of resistance at 0.8755 will increase the risks of a correction.

1523000318-311438cdc50bb0f634d8ee27e47a0113_1200x1200_q90v3.png


More:
https://tinyurl.com/ya5774hh
 
US Nonfarm Payrolls
When we talk about the most important economic indicators, one of the first is the US nonfarm payrolls, also known as NFP. Job creation is a leading indicator of consumer spending, which accounts for the majority of the overall economic activity.

The data is released the first Friday of every month, and this time it will be on April 6. If the actual figure is higher than the forecast one, the greenback will have chances to strengthen. Note that the United States will also release the unemployment rate and average hourly earnings.
Follow these events on the FBS economic Calendar https://goo.gl/BCfsrG

rJQO58c.jpg
 
Now it's more convenient and easier to attract customers!
Our promo materials work great, it's proven by thousands of our partners!
Become an FBS partner now and try it yourself - we are sure you will be surprised by how fast your income increases.
https://goo.gl/429et3

All these can be completed in five steps
1 Select a poster (by type, language and subject)
2 Copy the code with the reference link.
3 Place your poster on your site, your blog, or your forums.
4⃣ Monitor how fast your customer is growing
5⃣ Get the greatest profit ever!

Let's collaborate and make big money together!

22jnHi4.png
 
FOREX BOOKS

50 PIPS A DAY FOREX STRATEGY

In this book, Laurentio Damir teaches the way to construct a reliable forex trading system, with the essential forex trading tools and how to apply solid money management rules and how to avoid making trading mistakes.

With a very simple to follow forex trading strategy to get 50 pips per day or more. It is ideal for beginner traders, but it will give a great deal of help to more experienced traders that have not found a clear strategy to make profits consistently.Easy to understand and to put into practice with very well defined entry, stop loss and exit levels.

Trade on FOREX with FBS with the best trading accounts options
https://goo.gl/jLr2y9

NZgGM0f.png
 
You already know, right?!

We Always By Your Side!
Don't be afraid to start over, it's a new chance to rebuild your own future the way you love.
Start trading with FBS - Start the journey of profits!
www.fbs.com

ZwNJgDm.jpg
 

Andrea ForexMart

Broker Representative
Italy’s Industrial Output Unexpectedly Decline in February


The industrial output of Italy suddenly weakened in February which further showed signs that growth in the Euro area may exceed its peak. The production declined by 0.5 percent since January after it dropped to 1.8 percent, according to the Istat in Rome yesterday. While economists predicted an expansion of 0.8 percent in February based on the median of 24 forecasts in the poll by Bloomberg. In the previous year, the working-day adjustment industrial output increase by 2.5 percent.


The manufacturing of consumer goods fell to 2.4 percent in February which had a major contribution to the monthly tightening. The manufacturing index of the country showed a lower than expected results in March after the failure in general elections to have a clear winner. This triggered concerns for the possible lengthy process prior to forming a new government.


Italy is the third largest economy in the European region and grew in 2017 at its fastest pace from 2010 since weaker consumption was outweighed due to increasing investments and exports. However, the national output hovered below its pre-crisis level where most of the major EU economies were able to recover from its sluggishness.


The German industrial production softens in February because construction shrank as well as the investment goods. The major downturn was 1.6 percent recorded in August 2015. While the research firm Sentix had a pessimistic outlook towards the Italian economy as indicated in their monthly report since July 2016.


itlaysindustrial.PNG
 

Andrea ForexMart

Broker Representative
China’s Economic Growth Slacken in Jan-Mar Period


Chinese economy slowed down gradually in Q1 due to government struggle over credit and financial hazards, while U.S. trade frictions are showing signs of restricted growth based on AFP survey. China is projected to expand by 6.7 percent during the first quarter but remains to be lower than 6.8 percent in the last quarter of 2017 according to 13 economists prior the publication of official numbers. Analysts see that the decline was linked to the country’s massive pile of debt, financial risks, and slackening property market.


The trade war issues with the United States brought a negative impact towards the markets in the past few weeks, as Beijing and Washington appears to have equal retaliations with regards the bilateral trade. However, the fears triggered by US President Donald Trump to have an additional $100 billion in Chinese imports would cause solid damage to the economy, experts said.


The trade data was issued by Beijing on April 13 which supported the news that trade surplus in China with the US increased for the fifth time after the first quarter of the current year. There are indications that growth will reach higher than 6.7 percent based on AFP poll, with numbers greater than the official target of the government at 6.5 percent for this year.


On Thursday, Yi Gang, People's Bank of China (PBOC) Governor, stated that China is scheduled to issue its economic quarterly data exceeding its expectations, which further shows an optimistic outlook in 2018.


President Xi Jinping had a propitiatory note on trade last week and pledged to reduced tariffs on cars and other goods which triggered anger of the United States. Also, to open up the economy which had a warm response from Trump. However, the commerce ministry of second largest economy in the world restated that there are no ongoing talks between the two capital cities due to insincerity showed by Washington.


chinaseconomicgrowth.PNG
 
Learn important events with FBS!

What you need to do is very simple
Follow FBS Economic Calendar
Set your Strategies
Start your trade!

Don't miss anything in Forex!


------------------------------------------
#FX #Economic #Calendar

3dNes1F.jpg
 
FBS Video Lessons

In this video Tutorial LESSON 20. Margin, Leverage, Margin Call, Stop Out
How much money should you have on your account to keep trading? The necessary sum is called margin, tightly linked to the term ‘leverage’.
In addition, you will learn the concepts of Balance, Equity Usable Margin and more...


Do not forget to chose your language from the video's subtitles :)
--------------------------
#FBS #ForexTrading #Forex

0UD3AdM.jpg
 
The indicator of Chinese manufacturers' activity is still steady in April


30.04.2018

The indicator of Chinese manufacturers' activity is still steady. It’s due to the fact the service sector has been expanding for the second month in a row in April.

In April, the index of business activity of the manufacturing sector in this Asian country turned to be 51.4 versus the forecast of leading market experts, who hoped for 51.3. Nevertheless, the figure was below 51.5 – the outcome of the previous month. Besides this, the non-manufacturing activity index managed to tack on to 54.8 in April versus March’ result of 54.6. That’s what the China Bureau of Statistics informed. By the way, it should be noted that the value above 50 drops a hint at an increase. On the contrary, the reading below 50 stands for quite negative dynamics.

Sustained productivity can help to soothe concerns expressed by China's top leadership the previous week that the Chinese economy could slow down more abruptly than anticipated, considering the constant tension in the trade.

Some market experts pointed out that the given figures appear to be solid enough. They added that today’s data openly suggests that surge rates are still upbeat, although risks are over there.

The indicator of new export orders headed south to about 50.7 versus an outcome of 51.3. However, in the last few months it remained generally intact. New orders also inched down to 52.9 from 53.3.

Prices for finished products moderately dived to 53. The stocks of finished products, raw materials, backlogs as well as employment remained in line with previous indications.

The Chinese economy is currently facing a slight downward pressure. That’s what Zhou Hao, economist at Commerzbank AG in Singapore told. Apparently, many recent macro data demonstrate a minor downward trend, although overall PMI turns to be stable.

EiXxeuCuPw3PD9fS_640x320_q80v3.jpg
 
Top