• The Forex, Binary Options Forum - welcomes you to our Community!

    DigitalCashPalace Forum is dedicated to discussions about Forex, Binary Options, commodities, stocks related.

    Please take a look around, and feel free to .

Forex Technical Analysis by FXOpen

BTC and XRP – Breakout seen but first resistance encountered
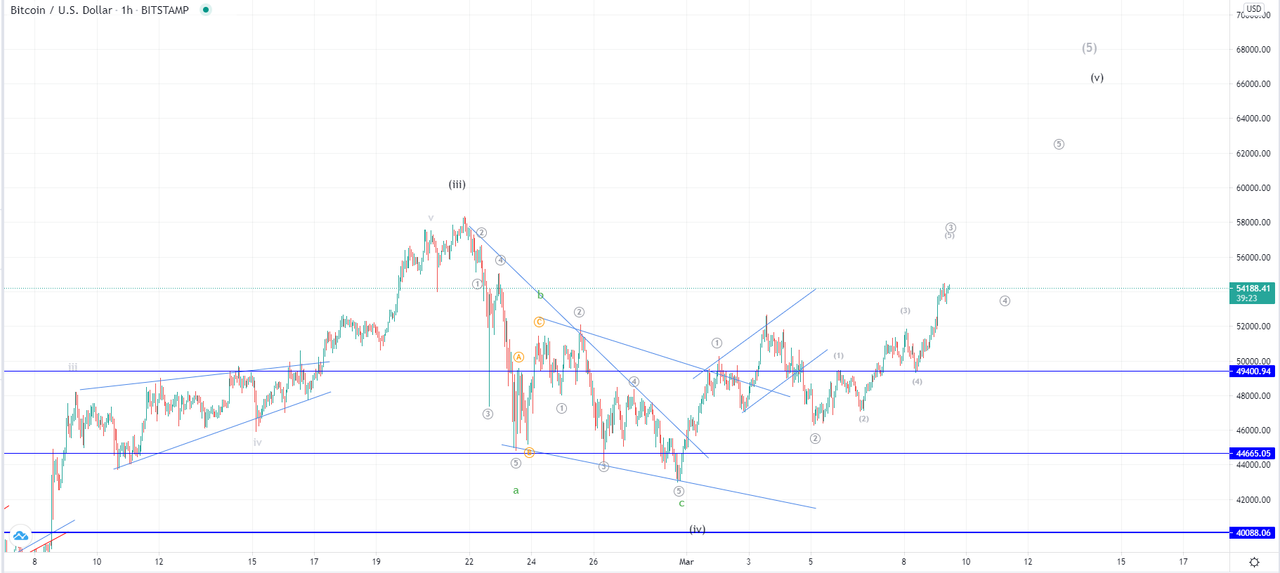
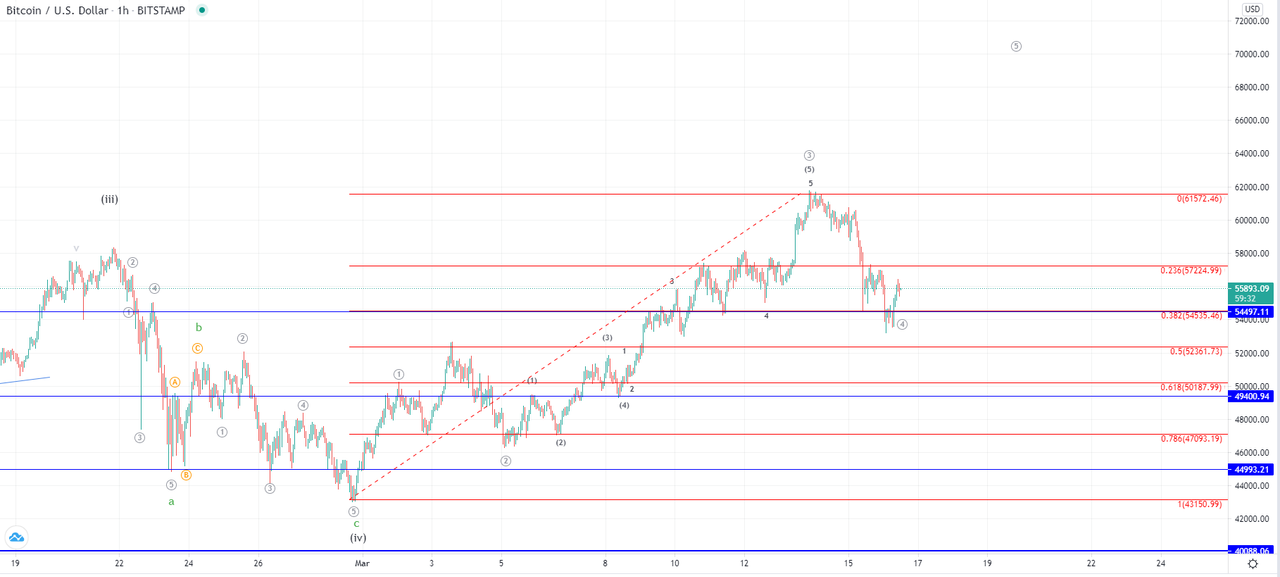
btc-xrp.jpg


BTC/USD

From Sunday’s low at around $43,070, the price of Bitcoin came up $49,579 at its highest point today which was a recovery of 15%. Since today’s high, we have seen a minor pullback but the price is still in an upward trajectory overall.

btcusd-1h.png


This recovery of 15% was a breakout from the descending triangle that formed from the 25th of February and was the 3rd sub-wave from the correctional move that started on the 21st. The price found support on the 0.5 Fib level on Sunday which led to the price increase and ultimately to a breakout but now new resistance has been encountered above the prior local high at the significant horizontal level.

We could have seen the completion of the 4th corrective wave from the higher degree count with the wave structure implying that the descending triangle from which it broke was the C wave from the lower degree count. If this is true, then the current rise is the next starting impulse that is going to push the price of Bitcoin above its prior all-time high onto the next one. But first, there must be a validation which would come in a form of a breakout from the currently interacted horizontal resistance level. This is why now the pullback might continue to the 0.382 Fib level where if the price finds support, further uptrend continuation would be expected.

Read Full on FXOpen Company Blog...
 
EUR/USD Facing Hurdles, USD/JPY Gains Bullish Momentum

Euro-EUR-USD.jpg


EUR/USD declined towards 1.2000 before recovering higher. USD/JPY is following a strong uptrend and it even broke the 106.50 resistance zone.

Important Takeaways for EUR/USD and USD/JPY

  • The Euro tested the 1.2000 support zone and it is now recovering higher.
  • There was a break above a steep bearish trend line with resistance near 1.2020 on the hourly chart of EUR/USD.
  • USD/JPY climbed above the 106.00 and 106.50 resistance levels.
  • There is a major bullish trend line forming with support at 106.70 on the hourly chart.

EUR/USD Technical Analysis

This past week, the Euro topped near the 1.2245 before starting a fresh decline against the US Dollar. The EUR/USD pair broke the 1.2150 and 1.2120 support levels to move into a bearish zone.

The pair even broke the 1.2080 support level and the 50 hourly simple moving average. Finally, there was a spike below the 1.2000 support and the pair traded as low as 1.1991 on FXOpen.

eurusd-chart.png


Recently, the pair started an upside correction above 1.2020. There was a break above a steep bearish trend line with resistance near 1.2020 on the hourly chart of EUR/USD. The pair climbed above the 23.6% Fib retracement level of the downward move from the 1.2245 swing high to 1.1991 low.

It is now trading above the 1.2060 level and the 50 hourly simple moving average. An immediate resistance is near the 1.2100 level.

The first key resistance is near the 1.2120 level. It is close to the 50% Fib retracement level of the downward move from the 1.2245 swing high to 1.1991 low. A clear break above the 1.2100 and 1.2120 levels could open the doors for a move towards the 1.2200 level.

Conversely, the pair could start a fresh decline below the 1.2060 support. The first major support is near the 1.2050 level and the 50 hourly simple moving average.

If there is a downside break below the 50 hourly simple moving average, the pair could dive towards the 1.2000 support in the near term. Any more losses might call for a retest of the 1.1965 support level.

Read Full on FXOpen Company Blog...
 
LTC and EOS – Looking for support

ltc.png


LTC/USD

The price of Litecoin has been on the rise since the start of the month and came up from $154 to $197.24 at its highest point so far which was an increase of 28%. Since yesterday’s high we have seen a pullback to the $182 level above which it is currently being traded.

ltcusd-1h.png


On the hourly chart, you can see that the price of Litecoin is making an interaction with the 0.5 Fib level measured from the 27th of January until the 20th of February which was the five-wave impulse to the upside that developed after a prolonged correction in January. The price made another minor breakout from the start of March from the descending trendline and is now inside another ascending channel.

If the previous upside impulse was the next five-wave impulse to the upside, the price has made a corrective decrease afterward. This would bring the current rise as the next sub-wave of the upward impusle that is set to exceed February’s high of $246. But another possibility could be that the higher degree impulse ended in February with the seen five-wave move in which case the currently seen rise is the 2nd sub-wave of the higher degree correction. This is why now depending on the wave structure behind the move we are going to see which scenario is in play.

If the price makes another three-wave move it would mean that the rise since the start of the month is corrective, but if it continues moving to the upside in a five-wave manner that would be an early indication that we are going to see a further uptrend continuation and new yearly highs for the price of Litecoin above the February’s one.

Read Full on FXOpen Company Blog...
 
Gold Price Slides Below $1,700, Oil Price Approaches $65

Gold-price-oil-price-1.jpg


Gold price started a fresh decline below the $1,750 and $1,720 support levels. Crude oil price is still in a positive zone and it is approaching the $65.00 resistance.

Important Takeaways for Gold and Oil

  • Gold price started a steady decline and it even broke the $1,700 support against the US Dollar.
  • There is a major declining channel forming with resistance near $1,715 on the hourly chart of gold.
  • Crude oil price traded to a new multi-month high near $64.96.
  • There was a break above a key bearish trend line with resistance near $61.50 on the hourly chart of XTI/USD.

Gold Price Technical Analysis

Gold price struggled to stay above the $1,750 support and started a strong decline against the US Dollar. As a result, there was a break below the $1,720 and $1,715 support levels.

The price even declined below the $1,700 support and settled below the 50 hourly simple moving average. It traded as low as $1,687 on FXOpen and it is currently consolidating losses.

gold-price-chart.png


An initial resistance on the upside is near the $1,700 level. It is close to the 38.2% Fib retracement level of the recent decline from the $1,722 swing high to $1,687 low. The first major resistance is near the $1,710 level.

An intermediate resistance is near $1,705. It is close to the 50% Fib retracement level of the recent decline from the $1,722 swing high to $1,687 low. There is also a major declining channel forming with resistance near $1,715 on the hourly chart of gold.

The trend line is close to the 50 hourly simple moving average at $1,716. A close above the trend line resistance and a follow up move above $1,720 is needed for a fresh surge.

On the downside, the first major support is near the $1,688 level. The next major support is near the $1,675 level. Any more losses might call for a move towards the $1,650 support level.

Read Full on FXOpen Company Blog...
 
GBP/USD Turns Red While GBP/JPY Could Rise Further

gbp-1.jpg


GBP/USD surged above 1.4150 before starting a fresh decline below 1.4000. GBP/JPY is rising and it remains supported for more gains above 150.50

Important Takeaways for GBP/USD and GBP/JPY

  • The British Pound started a fresh decline below the 1.4000 support zone against the US Dollar.
  • There was a break below a rising channel with support near 1.3925 on the hourly chart of GBP/USD.
  • GBP/JPY climbed higher steadily above the 149.00 and 150.00 resistance levels.
  • There is a major bullish trend line forming with support near 149.70 on the hourly chart.

GBP/USD Technical Analysis

This past week, the British Pound topped near the 1.4200 level against the US Dollar. The GBP/USD pair started a fresh decline and traded below many key supports near the 1.4100 level.

The pair even broke the 1.4000 support level and settled below the 50 hourly simple moving average. Recently, there was a break below a rising channel with support near 1.3925 on the hourly chart of GBP/USD.

gbpusd-chart-1.png


The pair even spiked below the 1.3800 level. A low is formed near 1.3778 on FXOpen and the pair is currently consolidating losses. An initial resistance is near the 1.3885 level.

The 23.6% Fib retracement level of the recent decline from the 1.4016 high to 1.3778 low is also near the 1.3885 level. The next major resistance is near the 1.3890 level and the 50 hourly simple moving average.

The 50% Fib retracement level of the recent decline from the 1.4016 high to 1.3778 low is the next barrier near 1.3900. A close above the 1.3900 level may possibly lift the pair higher towards the 1.4000 resistance zone.

If not, there is a risk of more downsides below the 1.3800 support zone. The next major support is near the 1.3740 level, below which the pair could decline towards the 1.3680 level.

Read Full on FXOpen Company Blog...
 
Decisive Week Ahead for the ECB and the Euro

ecb.jpg


The first week of the month ended up with the Non-Farm Payrolls (NFP) in the United States showing a strong rebound of the US labor market. The NFP report revealed that the job market added double the number of jobs that the economists forecasted. As such, the perspective of a faster than expected recovery is not an illusion anymore but a fact.

On top of that, the White House announced that the US will have a vaccine available for every adult by the end of April this year. This puts the US economy in front when it comes to the economic recovery after the pandemic, as the vaccines appear to be effective and the rest of the world lags in its vaccination efforts.

Unsurprisingly, the US dollar gained across the board. The USDJPY closed the week above 108, the EURUSD pair fell to 1.19, and even the AUDUSD dropped three big figures from its 0.80 highs.

While the previous week was exciting, as all NFP weeks are, the week ahead is even more interesting. The name of the game this week is what the European Central Bank (ECB) will do at its Thursday meeting.
sp500.jpg


ECB in Focus This Week

The euro area economies did not perform so well as the United States economy did. Just the opposite. In Europe, the COVID-19 pandemic hit the economies multiple times, with two or three pandemic waves resulting in more deaths than expected. As a consequence, most of the economies were closed for most of last year and in 2021 as well.

So, when the US is thinking of the economic growth ahead, Europe barely deals with the pandemic. The European Commission failed to secure vaccines for its population, and the speed of administering the existing ones is much slower than anything we have seen in other countries (e.g., United States, United Kingdom, Israel). Like it or not, the difference will be seen in the economic performances in the period ahead, and Europe is poised to lag its rivals.

More problematic for the ECB is the tightening of long-term yields in the United States. The move higher in the US yields, which are the benchmark for risk-free rates in the world, triggered a similar move in other jurisdictions – e.g., the Bund yields in Germany are on the rise too.

unemployment-rate.jpg


Higher yields signal economic recovery. While in the US, higher yields are a logical market reaction to the improved economic picture and the fast vaccination rate, in Europe, higher yields bring a challenge. When yields are rising, financial conditions tighten. This is a problem for the ECB, as it does not want tightening conditions while the economy continues to underperform.

Hence, Thursday’s ECB meeting is crucial for the ECB and the euro. On the one hand, the ECB must act to wind down the unwanted tightening. On the other hand, the EURUSD exchange rate keeps trading in a tight correlation with the equity markets in the United States. Should the ECB expand the asset-buying program (i.e., PEPP), the EURUSD may fall much lower than the current levels.

FXOpen Blog
 
BTC and XRP – Bullish sentiment continues

btc.jpg


BTC/USD

From last Friday when the price of Bitcoin has been traded at $46,371, we have seen an increase of 17.6% measured to its highest point today at the $54,530 level. After a minor pullback, the price back close to the levels of today’s high and is still on an upward trajectory.

btcusd-1h-1.png


This upside movement is counted as the starting impulse to the upside after a correction ended on the 28th of February. The first two waves should have ended which is why now we are seeing the development of the next 3rd one.

If this is the five-wave impulse the price increase should continue after the completion of this rise which is set to exceed the high on the 3rd. But there is still a possibility that it would end on the 3rd wave in which case that would mean that we have seen the 2nd sub-wave of the higher degree correctional count.

In the first case, a new all-time high would be expected, while in the second the price would go above its low of February 28th which would be the first sub-wave of the higher degree descending move. The pivot point would be the pullback that is expected after the current rise ends, as it manages to stay above the $52,600 area it would validate the 4th wave. But if it continues moving down and even falls below the $50,000 area that would be a clear sign that the price of Bitcoin is headed for a lower low as the 4th wave count would be invalidated.

Read Full on FXOpen Company Blog...
 
EUR/USD Remains at Risk, USD/CHF Correcting Gains

euro-3.jpg


EUR/USD started a fresh decline below the 1.2000 and 1.1920 support levels. USD/CHF traded towards the 0.9375 level before correcting gains.

Important Takeaways for EUR/USD and USD/CHF

  • The Euro started a fresh drop below the 1.2000 and 1.1920 support levels against the US Dollar.
  • There is a key bearish trend line forming with resistance near 1.1890 on the hourly chart of EUR/USD.
  • USD/CHF followed a bullish path and it broke the 0.9300 resistance zone before correcting lower.
  • There was a break below a connecting bullish trend line with support near 0.9295 on the hourly chart.

EUR/USD Technical Analysis

The Euro failed to extend gains above 1.2120 and started a fresh decline against the US Dollar. The EUR/USD pair broke the key 1.2000 pivot zone to move into a bearish zone.

The pair even broke the 1.1920 support level and settled below the 50 hourly simple moving average. The bears were able to push the pair below 1.1880 and a low is formed near 1.1836 on FXOpen.

eurusd-chart-1.png


It is currently correcting higher and trading above 1.1850. It even tested the 23.6% Fib retracement level of the recent decline from the 1.2112 high to 1.1836 low. There is also a key bearish trend line forming with resistance near 1.1890 on the hourly chart of EUR/USD.

If there is a break above the trend line resistance, the pair could correct higher towards the 1.1940 level. The next major resistance is near the 1.1975 level. It is close to the 50% Fib retracement level of the recent decline from the 1.2112 high to 1.1836 low.

If there is no upside break, the pair might continue to move down below 1.1850. The next key support is near the 1.1835 level, below which EUR/USD could decline towards the 1.1800 support. Any more losses could open the doors for a move towards the 1.1750 level.

Read Full on FXOpen Company Blog...
 
LTC and EOS – Did we see an upward correction ending?

ltc.jpg


LTC/USD

The price of Litecoin has been on a decline from its yesterday’s high made at $208 and has decreased by 7.64% today, coming down to $192. Since the price is in a downward trajectory and has made an entry below its prior higher high, further downside could be expected in the upcoming period.

ltcusd-1h.jpg


On the hourly chart, we can see that the price of Litecoin has been on the rise since the start of March after a period of continuous decline. As on the 20th of February, we have seen the completion of the impulsive five-wave move to the upside. This is why a steep descending move was made as a corrective wave. This is why now we could have seen the continuation of the higher degree corrective move as the ABC to the upside from the start of the month.

The first indication that this was an upward ABC instead of the next five-wave impulse is the fact that the price failed to stay above the 0.382 Fib level which was the ending point of the 1st wave to the upside. If this is true then the price of Litecoin is now headed further to the downside below its low made on the 28th of February at $154.


Read Full on FXOpen Company Blog...
 
Gold Price Back Above $1,700, Oil Price Correcting Gains

Gold-price-oil-price-2.jpg


Gold price started a decent recovery and climbed above $1,720. Crude oil price traded to a new yearly high at $67.81 before correcting lower.

Important Takeaways for Gold and Oil

  • Gold price found support near $1,680 and started a short-term recovery against the US Dollar.
  • There was a break above a major bearish trend line at $1,700 on the hourly chart of gold.
  • Crude oil price extended its rally and it traded to a new multi-month high near $67.81.
  • Recently, there was a break below a connecting bullish trend line at $64.20 on the hourly chart of XTI/USD.

Gold Price Technical Analysis

gold-price-chart-1.png


Gold price formed a strong support base above the $1,680 level against the US Dollar. As a result, there was a decent recovery wave above the $1,700 and $1,705 resistance levels.

There was also a break above a major bearish trend line at $1,700 on the hourly chart of gold. It opened the doors for a move above the $1,720 level. The price even cleared the $1,730 level and settled above the 50 hourly simple moving average.

A high is formed near $1,740 on FXOpen and the price is currently correcting lower. There was a break below the $1,730 level. The price is now testing the $1,720 support and the 50 hourly simple moving average.

There is also a connecting bullish trend line with support near $1,721 on the same chart. If there is a downside break below $1,720, the price could revisit $1,700. Any more losses might call for a test of the $1,680 support.

On the upside, an initial resistance is near the $1,730 level. It is close to the 50% Fib retracement level of the recent decline from the $1,740 swing high to $1,719 low.

The first major resistance is near the $1,735 level. The 76.4% Fib retracement level of the recent decline from the $1,740 swing high to $1,719 low is also near $1,735. A convincing break above $1,730 and $1,735 might open the doors for a push above the $1,740 and $1,750 levels.

Read Full on FXOpen Company Blog...
 
GBP/USD Correcting Gains, EUR/GBP is Facing Key Resistance

gbp-usd.jpg


GBP/USD is facing resistance near 1.4000 and it is correcting gains. EUR/GBP is consolidating above 0.8550 and it could start a decent increase if it clears 0.8600.

Important Takeaways for GBP/USD and EUR/GBP

  • The British Pound is struggling to settle above the 1.4000 resistance zone.
  • There was a break below a key bullish trend line with support at 1.3925 on the hourly chart of GBP/USD.
  • EUR/GBP is forming a strong support base above 0.8550 level.
  • There was a break above a connecting bearish trend line at 0.8575 on the hourly chart.

GBP/USD Technical Analysis

After a sharp rally, the British Pound failed to stay above 1.4100 against the US Dollar. The GBP/USD pair declined and it even settled below the 1.4000 support zone.

It even dived towards the 1.3800 level and broke the 50 hourly simple moving average. Recently, there was a strong upward move above the 1.3900 level, but the pair struggled to clear the 1.4000 resistance zone.

gbpusd-chart-2.png


A high is formed near 1.4004 on FXOpen before the pair dipped again. There was a break below a key bullish trend line with support at 1.3925 on the hourly chart of GBP/USD.

It traded as low as 1.3862 before recovering higher. There was a break above the 50% Fib retracement level of the downward move from the 1.4004 high to 1.3862 low.

However, the pair is facing resistance near the 1.3950 level and the 50 hourly simple moving average. The 61.8% Fib retracement level of the downward move from the 1.4004 high to 1.3862 low is also acting as a resistance.

The main resistance is still near 1.4000, above which the pair could rally again. On the downside, the 1.3900 level is a decent support. The next major support sits near the 1.3850 level, below which the pair could slide towards the 1.3800 level. Any more losses might call for a test of the 1.3720 support zone.

Read Full on FXOpen Company Blog...
 
Rising Yields Put Pressure on the Fed at Wednesday’s Meeting

fed.jpg


The main event of the week for financial markets is the Fed’s FOMC meeting on Wednesday. Besides the regular statement, the Fed will reveal its economic projections, and the market will focus on the dots plot that shows the federal funds rate forecast for the next three years.

The event is particularly important for traders because the dollar is at crossroads. If the Fed signals a liftoff before 2024, the markets will take it as a hawkish signal that would trigger a wave of dollar buying. On the other hand, if the dots plot do not show any increase until 2024, the Fed signals its willingness to keep accommodative conditions despite the recent fiscal stimulus.

Challenges for the Fed

rising-yields.jpg


The big challenge for the Fed comes from the long-term yields, which rose recently. While the move higher is insignificant on the long-term charts, it does signal an unwanted tightening of financial conditions.

Moreover, the move higher in the yields generated a dollar rally at the end of February, tempered only by the new round of fiscal stimulus from Biden’s administration. Should the yields rise further, the investors may turn their attention to the dollar again. Yields typically rise during the economic recovery, and the new fiscal stimulus package leads to faster recovery.

Ahead of Wednesday’s meeting, the dollar remains offered – the EURUSD is back above 1.19, the AUDUSD is above 0.77, and the GBPUSD trades close to 1.40. If the Fed hints at no rate hike until 2024, the dollar may take another dive. On the other hand, if the Fed is pressured by the rising yields and hints at a rate hike as early as 2023, the dollar may rally, sending the EURUSD below its recent 1.1840 support.

All in all, traders are guaranteed to see high volatility and quick price action as the Fed unveils its economic projections.

FXOpen Blog
 
February 2021 TOP 10 PAMM Accounts Overview

pamm-review-february-2021.jpg


Although the winter is over, the early spring has not made things much brighter around the world. However, PAMM account managers continue to trade actively, adapting their strategies to the changing market. Investors’ goals are still the same — they want to invest their money in the most promising PAMM accounts with minimum risk and maximum profit.

On March 1, 2021, FXOpen launched a new round of “Money Managers” competition, where participants can not only show their skills in PAMM account management but also win up to 5,000 USD in prizes. Registration is open until May 1.

Read Full on FXOpen Company Blog...
 
BTC and XRP – Support found

btc.jpg


BTC/USD

The price of Bitcoin has fallen today to $53,548 at its lowest point from which we have seen an increase of 5.4% as a minor recovery was made to $56,388. Currently, the price is sitting at $55,893 as a pullback is being made but the price is still in an upward trajectory overall.

btcusd-1h-2.png


Looking at the hourly chart, you can see that the price has fallen back to the 0.382 Fibonacci level measured from the upward impulse from the start of the month to its new all-time high made on the 13th of March. This could be and most likely is the 4th wave out of the five-wave impulse to the upside from the next starting impulse wave to the upside. If that is true, then the price cannot fall inside the territory of the 1st wave which would be below the 0.5 Fib level at $52,361.

Now as we have seen a bounce off of the significant horizontal level at $54,497 it could mark the completion of this 4th wave which is why the increase seen today would be the 1st sub-wave of the next move to the upside that is set to push the price of Bitcoin above its prior all-time high an on to the new one. However, this has to be validated as the price could now be headed further down. The point of validation would be an increase above the 0.236 Fib level or the invalidation if the price continues moving below the 0.382 support.


Read Full on FXOpen Company Blog...
 
EUR/USD and EUR/JPY: Euro is Facing Hurdles

Euro-EUR.jpg


EUR/USD started a fresh decline after it failed to surpass 1.2000. EUR/JPY is correcting gains and it is likely to struggle near the 130.00 zone.

Important Takeaways for EUR/USD and EUR/JPY

  • The Euro topped near the 1.2000 level and started a fresh decline.
  • There is a key declining channel forming with resistance near 1.1930 on the hourly chart of EUR/USD.
  • EUR/JPY tested the 130.50 and recently declined to test the 129.50 support.
  • There is a major bullish trend line forming with support near 129.65 on the hourly chart.

EUR/USD Technical Analysis

Recently, the Euro made an attempt to climb above the 1.2000 resistance against the US Dollar, but it failed. The EUR/USD pair started a fresh decline and broke the 1.1960 support zone.

The pair even broke the 1.1945 support level and the 50 hourly simple moving average. It traded as low as 1.1882 on FXOpen before the pair started consolidating losses. It climbed above 1.1900, but there was no bullish momentum.

eurusd-chart-2.png


An initial resistance is near the 1.1915 level. It is close to the 50% Fib retracement level of the recent decline from the 1.1951 high to 1.1882 low. The next major resistance is near the 1.1925 level and the 50 hourly simple moving average.

There is also a key declining channel forming with resistance near 1.1930 on the hourly chart of EUR/USD. The channel resistance is near the 61.8% Fib retracement level of the recent decline from the 1.1951 high to 1.1882 low.

Therefore, the pair is likely to face a strong resistance near the 1.1925 and 1.1930 levels. A clear break above 1.1930 might start a fresh increase towards the 1.2000 resistance.

If not, there are chances of more losses in EUR/USD below the 1.1880 support zone. The next major support is near the 1.1850 level, below which the pair could dive towards the 1.1800 support level.

Read Full on FXOpen Company Blog...
 
Top