• The Forex, Binary Options Forum - welcomes you to our Community!

    DigitalCashPalace Forum is dedicated to discussions about Forex, Binary Options, commodities, stocks related.

    Please take a look around, and feel free to .

Daily Technical Analysis by FxGrow

FxGrow Daily Technical Analysis – 18th March, 2016
By FxGrow Research & Analysis Team

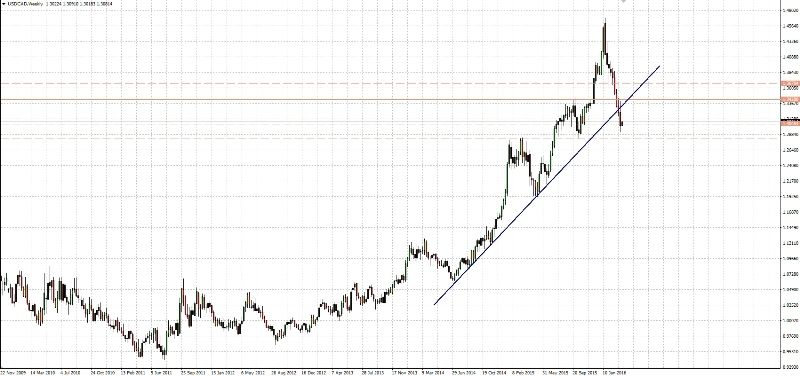
GBPCAD new 10-months low

Since the beginning of the March GBPCAD moved up in correction. Rebound wasn't very strong because upward movement didn't reach even to Fibonacci 38.2% level. Correction finished on Wednesday when new low occurred. Yesterday price reacted at support and 1.8680 level has been defended.

To read this Full in depth Analysis please visit FxGrowhttp://www.fxgrow.com/analysis-educ...cal-analysis-fxgrow-free-forex-analysis-tools.

Note: This analysis is intended to provide general information and does not constitute the provision of INVESTMENT ADVICE. Investors should, before acting on this information, consider the appropriateness of this information having regard to their personal objectives, financial situation or needs. We recommend investors obtain investment advice specific to their situation before making any financial investment decision.
 
FxGrow Daily Technical Analysis – 18th March, 2016
By FxGrow Research & Analysis Team

OIL WTI - nearest target for upward movement is 43.20

Rebound at OIL WTI is in progress. After new low on 11 February, when price reached to 26.00 rebound occurred and it lasts for today. At chart we can indicate uptrend channel in which price is moving.

To read this Full in depth Analysis please visit FxGrowhttp://www.fxgrow.com/analysis-educ...cal-analysis-fxgrow-free-forex-analysis-tools.

Note: This analysis is intended to provide general information and does not constitute the provision of INVESTMENT ADVICE. Investors should, before acting on this information, consider the appropriateness of this information having regard to their personal objectives, financial situation or needs. We recommend investors obtain investment advice specific to their situation before making any financial investment decision.
 
FxGrow Daily Technical Analysis – 21st March, 2016
By FxGrow Research & Analysis Team

USDCAD at key level

USDCAD is continuing downward movement which was started in mid-January 2016. Currently further direction of the main uptrend is endangered. Because uptrend line was broken (that line was respected since 2012), return above 1.3200 - 1.3250 area should be treated as a bullish signal. It will inform that demand returned to the market.

Time-frame W1
2016-03-21_analiza_USDCAD_W1_zpsyv3ayrtf.jpg


To read this Full in depth Analysis please visit FxGrowhttp://www.fxgrow.com/analysis-educ...cal-analysis-fxgrow-free-forex-analysis-tools.

Note: This analysis is intended to provide general information and does not constitute the provision of INVESTMENT ADVICE. Investors should, before acting on this information, consider the appropriateness of this information having regard to their personal objectives, financial situation or needs. We recommend investors obtain investment advice specific to their situation before making any financial investment decision.
 
FxGrow Daily Technical Analysis – 21st March, 2016
By FxGrow Research & Analysis Team

AUDCHF - triangle pattern predicts uptrend continuation

Since almost two weeks AUDCHF is moving inside a triangle. Its breakout will show further direction of price movement. It should occur soon because inside the triangle there is only 100 pips left (0.7330 - 0.7430 range).

Time-frame D1
2016-03-21_analiza_AUDCHF_D1_zpswfw4wf92.jpg


To read this Full in depth Analysis please visit FxGrowhttp://www.fxgrow.com/analysis-educ...cal-analysis-fxgrow-free-forex-analysis-tools.

Note: This analysis is intended to provide general information and does not constitute the provision of INVESTMENT ADVICE. Investors should, before acting on this information, consider the appropriateness of this information having regard to their personal objectives, financial situation or needs. We recommend investors obtain investment advice specific to their situation before making any financial investment decision.
 
FxGrow Daily Technical Analysis – 22nd March, 2016
By FxGrow Research & Analysis Team

GBPUSD - sharp decline after attack in Brussels

Current week began with declines at GBPUSD. Yesterday support at 1.4400 was broken below and today just after attack in Brussels dollar strengthened vs most of the currencies. GBPUSD broke below another support at 1.4300 and right now it is leading towards 1.4220 - 1.4150.

To read this Full in depth Analysis please visit FxGrowhttp://www.fxgrow.com/analysis-educ...cal-analysis-fxgrow-free-forex-analysis-tools.

Note: This analysis is intended to provide general information and does not constitute the provision of INVESTMENT ADVICE. Investors should, before acting on this information, consider the appropriateness of this information having regard to their personal objectives, financial situation or needs. We recommend investors obtain investment advice specific to their situation before making any financial investment decision.
 
FxGrow Daily Technical Analysis – 22nd March, 2016
By FxGrow Research & Analysis Team

SILVER - downtrend line was broken at weekly time-frame

Today's terror at Brussels caused temporary volatility, which was corrected in next trading hours. On silver volatility was huge. After sharp upward movement in the morning, decline and rebound occurred which lead price to daily high.

At time-frame H1 we can see a bullish regression channel and lower limit of that channel is located at 15.40 area. Above that area there is 15.70 (current nearest support). It has to be noted that uptrend on silver continues since December 2015. Important level for demand is located at 116.10, after break above that level price should fast reach 10-months high.

Time-frame W1
2016-03-22_analiza_SILVER_W1_zpscm26cj1z.jpg


To read this Full in depth Analysis please visit FxGrowhttp://www.fxgrow.com/analysis-educ...cal-analysis-fxgrow-free-forex-analysis-tools.

Note: This analysis is intended to provide general information and does not constitute the provision of INVESTMENT ADVICE. Investors should, before acting on this information, consider the appropriateness of this information having regard to their personal objectives, financial situation or needs. We recommend investors obtain investment advice specific to their situation before making any financial investment decision.
 
FxGrow Daily Technical Analysis – 23rd March, 2016
By FxGrow Research & Analysis Team

GBPAUD - after short break price is continuing downward movement

Last week support at 1.8820 caused rebound which was finished just after two days and at the beginning of current week price returned to declines. Declines lasts since August 2015 and there wasn't any bigger rebound in this period. The support at 1.8820 yesterday was broken and today supply is trying to break another support (but weaker) at 1.8620.

To read this Full in depth Analysis please visit FxGrowhttp://www.fxgrow.com/analysis-educ...cal-analysis-fxgrow-free-forex-analysis-tools.

Note: This analysis is intended to provide general information and does not constitute the provision of INVESTMENT ADVICE. Investors should, before acting on this information, consider the appropriateness of this information having regard to their personal objectives, financial situation or needs. We recommend investors obtain investment advice specific to their situation before making any financial investment decision.
 
FxGrow Daily Technical Analysis – 23rd March, 2016
By FxGrow Research & Analysis Team

EURUSD reached support at 1.1160 strengthened by Fibonacci 61,8%

Since last Thursday EURUSD is sliding down without any hints on the next movement. Declines are very small relative to some previous movements. Today price reached very interesting level, which has a chance to prepare field for a rebound. Mentioned level is 1.1160, it is support strengthened by Fibonacci 61,8% of previous upward movement (it was just after FED's meeting).

To read this Full in depth Analysis please visit FxGrowhttp://www.fxgrow.com/analysis-educ...cal-analysis-fxgrow-free-forex-analysis-tools.

Note: This analysis is intended to provide general information and does not constitute the provision of INVESTMENT ADVICE. Investors should, before acting on this information, consider the appropriateness of this information having regard to their personal objectives, financial situation or needs. We recommend investors obtain investment advice specific to their situation before making any financial investment decision.
 
FxGrow Daily Technical Analysis – 24th March, 2016
By FxGrow Research & Analysis Team

USDJPY - rebound in progress

In last analysis I indicated the triangle pattern, as you can see it was broken down. After that declines accelerated, however once again support at 110.90 stopped them and caused rebound. Since the beginning of current week price is moving up and resistance at 111.70 was successfully broken.

To read this Full in depth Analysis please visit FxGrowhttp://www.fxgrow.com/analysis-educ...cal-analysis-fxgrow-free-forex-analysis-tools.

Note: This analysis is intended to provide general information and does not constitute the provision of INVESTMENT ADVICE. Investors should, before acting on this information, consider the appropriateness of this information having regard to their personal objectives, financial situation or needs. We recommend investors obtain investment advice specific to their situation before making any financial investment decision.
 
FxGrow Daily Technical Analysis – 24th March, 2016
By FxGrow Research & Analysis Team

EURGBP - 16-months high

Since the beginning of December 2015 EURGBP moved in strong uptrend. Short correction which started one month ago probably was finished. New 16-months high confirms that correction was ended.

If price keeps standing above 0.7910 next important resistances will be located at 0.8000 and 0.8150 (strong resistance and long term downtrend line which connects highs since January 2009 coincide in this area).

To read this Full in depth Analysis please visit FxGrowhttp://www.fxgrow.com/analysis-educ...cal-analysis-fxgrow-free-forex-analysis-tools.

Note: This analysis is intended to provide general information and does not constitute the provision of INVESTMENT ADVICE. Investors should, before acting on this information, consider the appropriateness of this information having regard to their personal objectives, financial situation or needs. We recommend investors obtain investment advice specific to their situation before making any financial investment decision.
 
FxGrow Daily Technical Analysis – 25th March, 2016
By FxGrow Research & Analysis Team

GBPCAD - support at 1.8540 stopped declines

Last week supply tried again to broke support at 1.8540 but that attempt failed. Since Wednesday rebound is in progress and upward movement should test at least 1.8830 area. If bulls will be strong enough even 1.9080 level may be tested. Currently there isn't any positive signs for bulls.

To read this Full in depth Analysis please visit FxGrowhttp://www.fxgrow.com/analysis-educ...cal-analysis-fxgrow-free-forex-analysis-tools.

Note: This analysis is intended to provide general information and does not constitute the provision of INVESTMENT ADVICE. Investors should, before acting on this information, consider the appropriateness of this information having regard to their personal objectives, financial situation or needs. We recommend investors obtain investment advice specific to their situation before making any financial investment decision.
 
FxGrow Daily Technical Analysis – 29th March, 2016
By FxGrow Research & Analysis Team

EURGBP

This analysis is a continuation of previous one, published on Thursday 24th of March. Since then, EUR/GBP has failed in getting through the last high resistance and corrected a bit. Of course, since last Thursday we had weekend and Easter which froze the market, but during Monday session EUR/GBP touched first demand zone and it does it twice.

EURGBPH4_zpsoferpjhq.png


To read this Full in depth Analysis please visit FxGrowhttp://www.fxgrow.com/analysis-educ...cal-analysis-fxgrow-free-forex-analysis-tools.

Note: This analysis is intended to provide general information and does not constitute the provision of INVESTMENT ADVICE. Investors should, before acting on this information, consider the appropriateness of this information having regard to their personal objectives, financial situation or needs. We recommend investors obtain investment advice specific to their situation before making any financial investment decision.
 
FxGrow Daily Technical Analysis – 29th March, 2016
By FxGrow Research & Analysis Team

Crude oil tests the price gap

On the daily chart of May contracts for crude oil, we can see that price once again tested the support area defined by weekend price gap sketched between March 4-7 (ranging over 1.5USD). Declines reached the above mentioned zone after a failed test of resistance level which is determined thanks to the October 2015 lows (42.58).

To read this Full in depth Analysis please visit FxGrowhttp://www.fxgrow.com/analysis-educ...cal-analysis-fxgrow-free-forex-analysis-tools.

Note: This analysis is intended to provide general information and does not constitute the provision of INVESTMENT ADVICE. Investors should, before acting on this information, consider the appropriateness of this information having regard to their personal objectives, financial situation or needs. We recommend investors obtain investment advice specific to their situation before making any financial investment decision.
 
FxGrow Daily Technical Analysis – 30th March, 2016
By FxGrow Research & Analysis Team

EURUSD - the test of March's high

After side trend in which EURUSD moved for a few days (just above 1.1160 level), finally new upward wave occurred. Yesterday first resistance at 1.1200 was broken and a direct cause of larger volatility was yesterday's public speech of Janet Yellen. Chair of the FED indicated anxiety of the low inflation and she said that Federal Reserve has tools to fight with this problem. This could mean a significant extension of the period of low interest rates in the US.

To read this Full in depth Analysis please visit FxGrowhttp://www.fxgrow.com/analysis-educ...cal-analysis-fxgrow-free-forex-analysis-tools.

Note: This analysis is intended to provide general information and does not constitute the provision of INVESTMENT ADVICE. Investors should, before acting on this information, consider the appropriateness of this information having regard to their personal objectives, financial situation or needs. We recommend investors obtain investment advice specific to their situation before making any financial investment decision.
 
FxGrow Daily Technical Analysis – 30th March, 2016
By FxGrow Research & Analysis Team

GBPUSD - above resistance 1.4400

After last week’s selloff at GBPUSD which started after terrorist attacks in Brussels, declines reached support at 1.4070. Declines were finished last Thursday after local double bottom pattern and bullish candle (at time-frame H4) with long lower shadow. Demand took over control during end of last week but current week it was a capitulation of supply.

To read this Full in depth Analysis please visit FxGrowhttp://www.fxgrow.com/analysis-educ...cal-analysis-fxgrow-free-forex-analysis-tools.

Note: This analysis is intended to provide general information and does not constitute the provision of INVESTMENT ADVICE. Investors should, before acting on this information, consider the appropriateness of this information having regard to their personal objectives, financial situation or needs. We recommend investors obtain investment advice specific to their situation before making any financial investment decision.
 
FxGrow Daily Technical Analysis – 31st March, 2016
By FxGrow Research & Analysis Team

NZDCAD - long PIN BAR candle at the resistance

Yesterday on NZDCAD interesting daily candle occurred. Demand was punished for too rapid attempt of rebound and on the chart PIN BAR candle occurred with a long upper shadow. Shadow of that candle tested resistance at 0.9050.

To read this Full in depth Analysis please visit FxGrowhttp://www.fxgrow.com/analysis-educ...cal-analysis-fxgrow-free-forex-analysis-tools.

Note: This analysis is intended to provide general information and does not constitute the provision of INVESTMENT ADVICE. Investors should, before acting on this information, consider the appropriateness of this information having regard to their personal objectives, financial situation or needs. We recommend investors obtain investment advice specific to their situation before making any financial investment decision.
 
FxGrow Daily Technical Analysis – 04th April, 2016
By FxGrow Research & Analysis Team

USDCAD back to touch highs as it underpinned long-term support

The USDCAD decreased for nine consecutive weeks as the pair hits fresh 2016 lows near 1.2857. This long-term support level provides signals of a reversal trend as the USDCAD touched 1.2832 lows in October 2015. Thus prices are expected to comeback as the pair breaks 1.3075 reaching 1.3090 and 1.3125 respectively.

To read this Full in depth Analysis please visit FxGrowhttp://www.fxgrow.com/analysis-educ...cal-analysis-fxgrow-free-forex-analysis-tools.

Note: This analysis is intended to provide general information and does not constitute the provision of INVESTMENT ADVICE. Investors should, before acting on this information, consider the appropriateness of this information having regard to their personal objectives, financial situation or needs. We recommend investors obtain investment advice specific to their situation before making any financial investment decision.
 
FxGrow Daily Technical Analysis – 04th April, 2016
By FxGrow Research & Analysis Team

EURUSD further upside direction

The EURUSD started pushing higher after Yellen’s comments last week. The EURUSD is attempting to have a bullish breakout after an increase in US unemployment rate producing a slack in US labor market especially as the price cuts 1.1400 as a strong resistance. Thus next resistances are located at 1.1440 and 1.1470.

To read this Full in depth Analysis please visit FxGrowhttp://www.fxgrow.com/analysis-educ...cal-analysis-fxgrow-free-forex-analysis-tools.

Note: This analysis is intended to provide general information and does not constitute the provision of INVESTMENT ADVICE. Investors should, before acting on this information, consider the appropriateness of this information having regard to their personal objectives, financial situation or needs. We recommend investors obtain investment advice specific to their situation before making any financial investment decision.
 
FxGrow Daily Technical Analysis – 05th April, 2016
By FxGrow Research & Analysis Team

AUDUSD rallied as RBA kept lending rate steady

The AUDUSD traded higher as the Reserve Bank of Australia (RBA) weakens rate cut expectations and kept lending rate unchanged at 2%. Breaking 0.7640 increases to 0.7675 as a major resistance level and cutting this point will produce a bullish momentum targeting 0.7723 and 0.7745 respectively.

To read this Full in depth Analysis please visit FxGrowhttp://www.fxgrow.com/analysis-educ...cal-analysis-fxgrow-free-forex-analysis-tools.

Note: This analysis is intended to provide general information and does not constitute the provision of INVESTMENT ADVICE. Investors should, before acting on this information, consider the appropriateness of this information having regard to their personal objectives, financial situation or needs. We recommend investors obtain investment advice specific to their situation before making any financial investment decision.
 
FxGrow Daily Technical Analysis – 05th April, 2016
By FxGrow Research & Analysis Team

EURUSD overbought territory might lead to strong pullback

The EURUSD failed to continue gaining after reaching 1.1437 high this year. Hitting higher lows and failing to cut 1.1420 and the European Central Bank (ECB) dovish outlook for inflation and monetary policy give signs of a strong pullback and will open the door of a downside move. Cutting 1.1365 as a strong point will push the EURUSD lower toward 1.1345, 1.1325 and 1.1295 as next support levels.

To read this Full in depth Analysis please visit FxGrowhttp://www.fxgrow.com/analysis-educ...cal-analysis-fxgrow-free-forex-analysis-tools.

Note: This analysis is intended to provide general information and does not constitute the provision of INVESTMENT ADVICE. Investors should, before acting on this information, consider the appropriateness of this information having regard to their personal objectives, financial situation or needs. We recommend investors obtain investment advice specific to their situation before making any financial investment decision.
 
Top