• The Forex, Binary Options Forum - welcomes you to our Community!

    DigitalCashPalace Forum is dedicated to discussions about Forex, Binary Options, commodities, stocks related.

    Please take a look around, and feel free to .

Daily Market Analysis By FXOpen

Rising Yields Spark Dollar’s Rally

usd.jpg


Financial market participants were taken by surprise last week. The US dollar, on a steady decline since April of last year, has pared losses and started to rally.

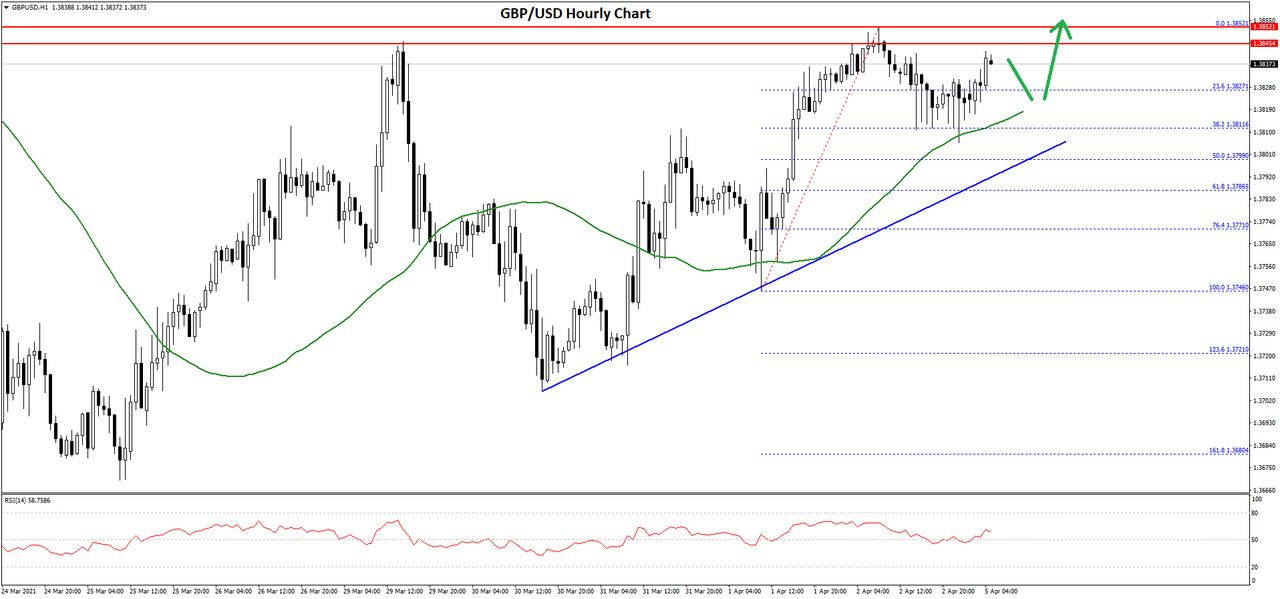
It gained across the board, trading higher against the euro, the pound, or the Australian dollar. The move higher in the dollar comes against all forecasts at the end of last year. Investment banks across the world forecasted a lower dollar to be the theme for the entire 2021, but that trend lasted only for the first two months of the year.

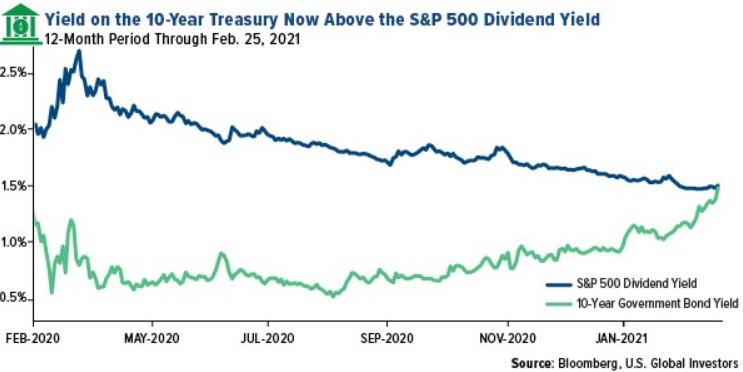
The move higher in the dollar was sparked by a dramatic increase in the US 10y yields. The Treasury yield is already at the end-2021 forecast, with only two months ended in the trading year.

1.jpg


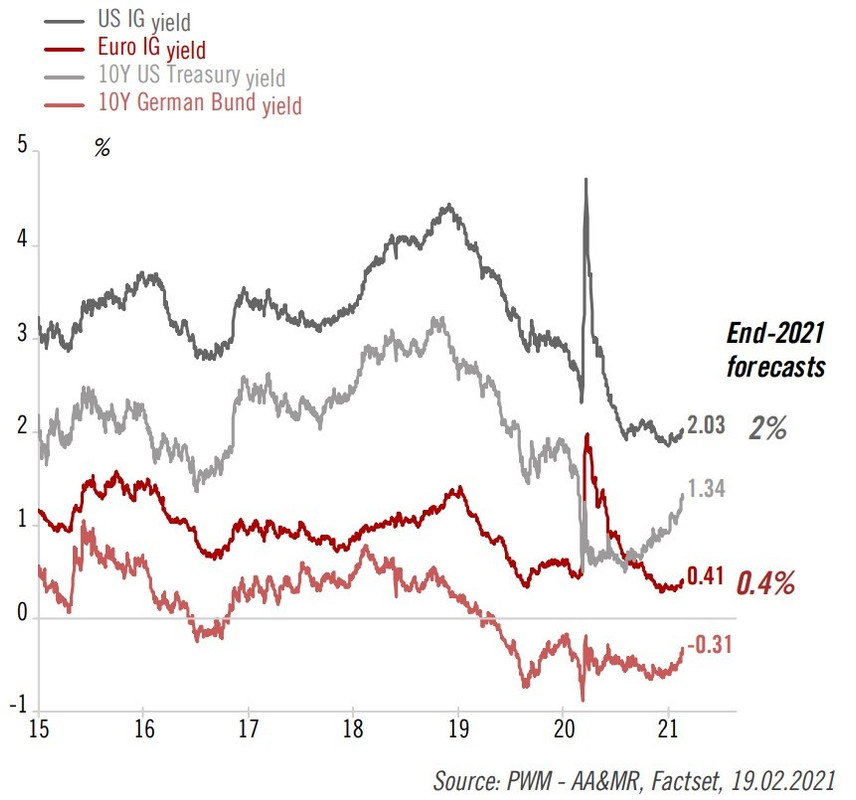
Higher Yields, Higher Dollar

The rising yields pose a threat to the reflation theme and the risk-on environment. Whenever yields are rising, the rise brings an unwanted tightening in financial conditions.

At this point, investors are speculating that the tightening of financial conditions during a pandemic will trigger more action from some central banks. However, the Fed looks trapped due to higher inflation and the Treasury issuance plan. Therefore, the chances are that other central banks, in particular the ECB and the RBA, will likely ease, further fueling the move higher in the dollar.

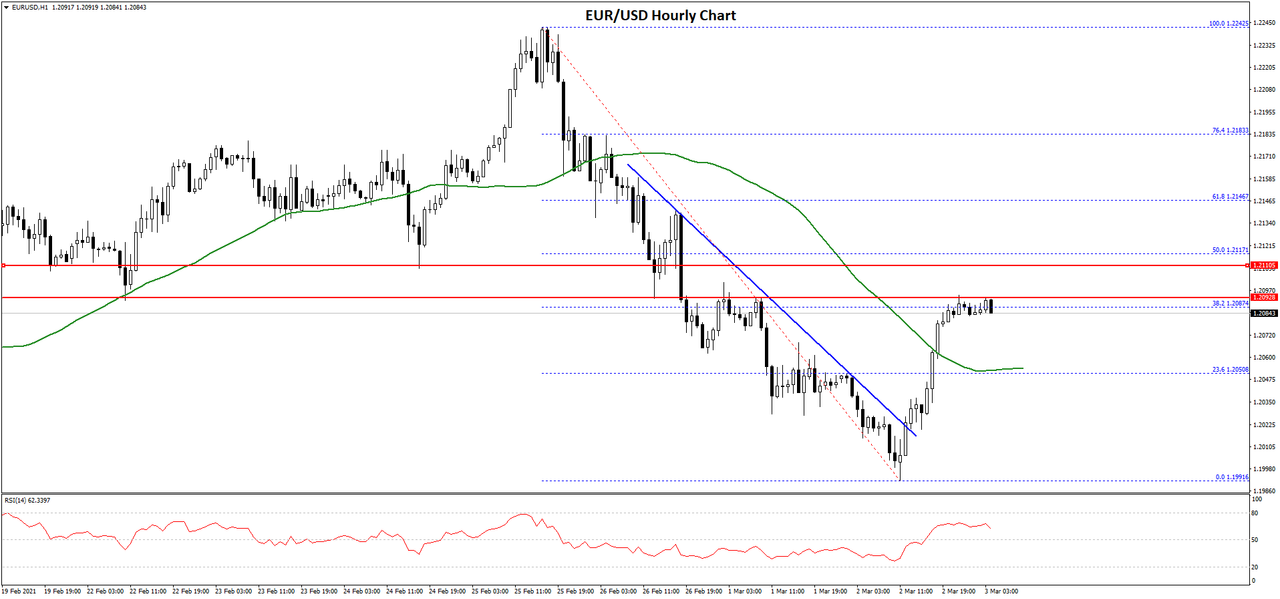
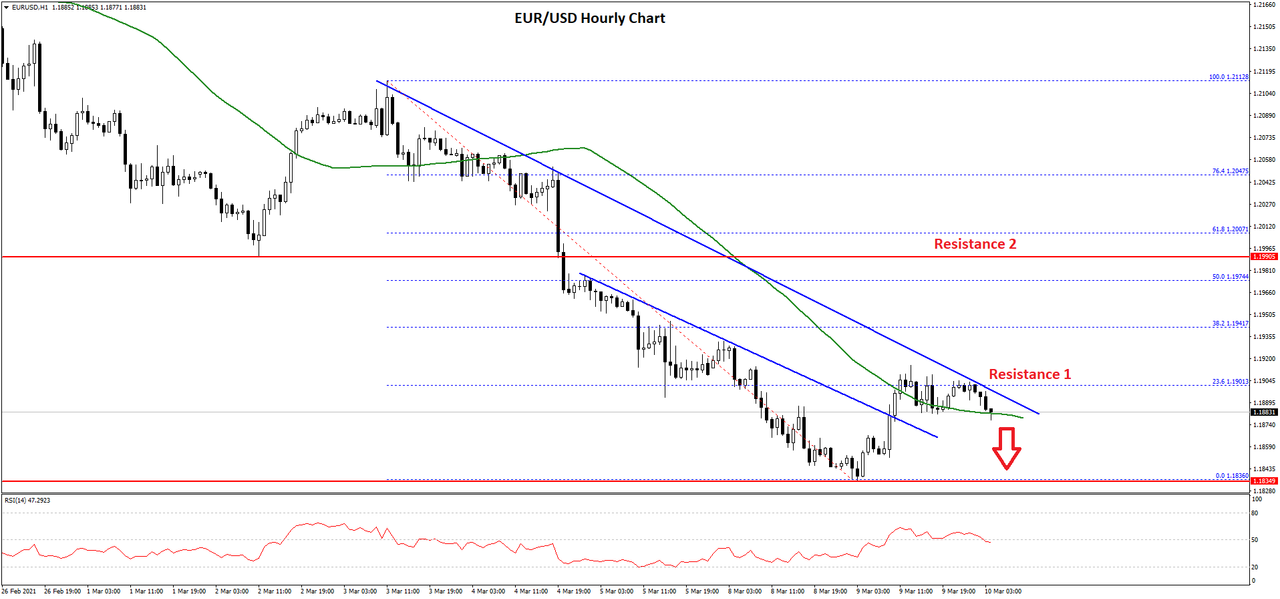
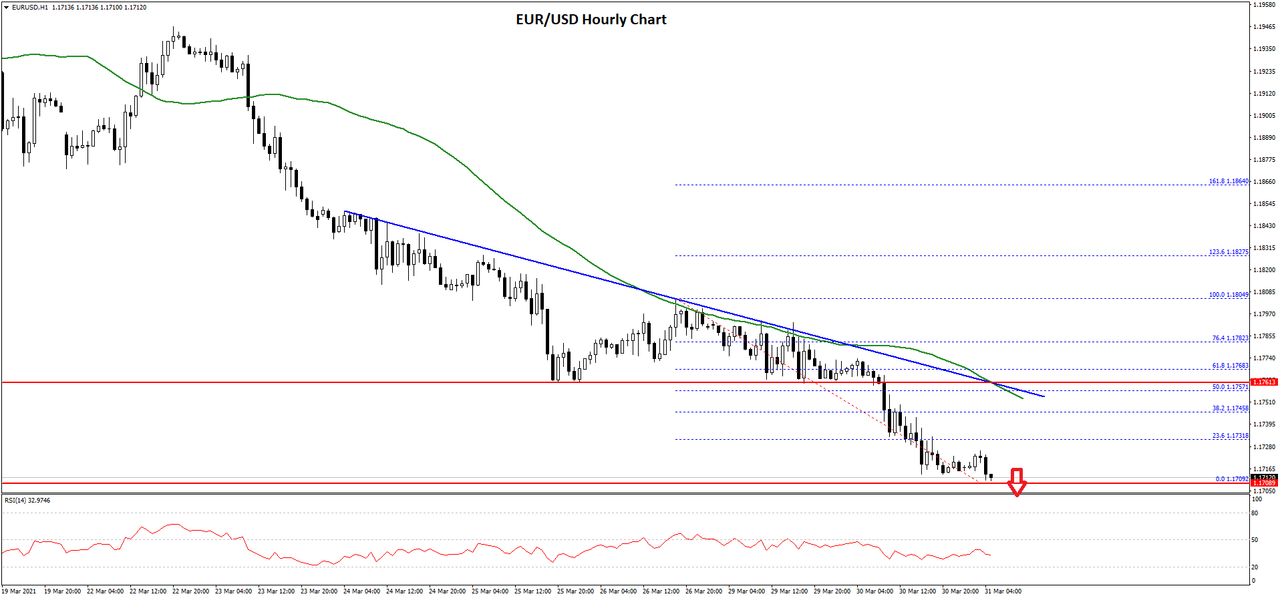
The EURUSD and the AUDUSD pairs lows over two big figures last week, and the trend lower continues. At the time of writing this article, the EURUSD traded close to 1.20, after only last Thursday it was as high as 1.2240. The move lower is almost vertical, and the same is seen on the AUDUSD pair.

In other words, this is a higher dollar move triggered by financial tightening and the risk-on environment changed. Should we see, yields continuing to rise, the dollar’s strength will continue as well.

This is the NFP week, and trading is tricky until the jobs data is released next Friday. However, this time the release may not be so relevant for markets unless the yields give away some of the recent games.

Also, investors will focus on what the RBA will do tomorrow, as well as the signals from the ECB. Any signs of further easing should trigger a new leg lower in the EURUSD and AUDUSD pairs.

FXOpen Blog
 
BTC and XRP – Breakout seen but first resistance encountered

btc-xrp.jpg


BTC/USD

From Sunday’s low at around $43,070, the price of Bitcoin came up $49,579 at its highest point today which was a recovery of 15%. Since today’s high, we have seen a minor pullback but the price is still in an upward trajectory overall.

btcusd-1h.png


This recovery of 15% was a breakout from the descending triangle that formed from the 25th of February and was the 3rd sub-wave from the correctional move that started on the 21st. The price found support on the 0.5 Fib level on Sunday which led to the price increase and ultimately to a breakout but now new resistance has been encountered above the prior local high at the significant horizontal level.

We could have seen the completion of the 4th corrective wave from the higher degree count with the wave structure implying that the descending triangle from which it broke was the C wave from the lower degree count. If this is true, then the current rise is the next starting impulse that is going to push the price of Bitcoin above its prior all-time high onto the next one. But first, there must be a validation which would come in a form of a breakout from the currently interacted horizontal resistance level. This is why now the pullback might continue to the 0.382 Fib level where if the price finds support, further uptrend continuation would be expected.

Read Full on FXOpen Company Blog...
 
EUR/USD Facing Hurdles, USD/JPY Gains Bullish Momentum

Euro-EUR-USD.jpg


EUR/USD declined towards 1.2000 before recovering higher. USD/JPY is following a strong uptrend and it even broke the 106.50 resistance zone.

Important Takeaways for EUR/USD and USD/JPY

  • The Euro tested the 1.2000 support zone and it is now recovering higher.
  • There was a break above a steep bearish trend line with resistance near 1.2020 on the hourly chart of EUR/USD.
  • USD/JPY climbed above the 106.00 and 106.50 resistance levels.
  • There is a major bullish trend line forming with support at 106.70 on the hourly chart.

EUR/USD Technical Analysis

This past week, the Euro topped near the 1.2245 before starting a fresh decline against the US Dollar. The EUR/USD pair broke the 1.2150 and 1.2120 support levels to move into a bearish zone.

The pair even broke the 1.2080 support level and the 50 hourly simple moving average. Finally, there was a spike below the 1.2000 support and the pair traded as low as 1.1991 on FXOpen.

eurusd-chart.png


Recently, the pair started an upside correction above 1.2020. There was a break above a steep bearish trend line with resistance near 1.2020 on the hourly chart of EUR/USD. The pair climbed above the 23.6% Fib retracement level of the downward move from the 1.2245 swing high to 1.1991 low.

It is now trading above the 1.2060 level and the 50 hourly simple moving average. An immediate resistance is near the 1.2100 level.

The first key resistance is near the 1.2120 level. It is close to the 50% Fib retracement level of the downward move from the 1.2245 swing high to 1.1991 low. A clear break above the 1.2100 and 1.2120 levels could open the doors for a move towards the 1.2200 level.

Conversely, the pair could start a fresh decline below the 1.2060 support. The first major support is near the 1.2050 level and the 50 hourly simple moving average.

If there is a downside break below the 50 hourly simple moving average, the pair could dive towards the 1.2000 support in the near term. Any more losses might call for a retest of the 1.1965 support level.

Read Full on FXOpen Company Blog...
 
LTC and EOS – Looking for support

ltc.png


LTC/USD

The price of Litecoin has been on the rise since the start of the month and came up from $154 to $197.24 at its highest point so far which was an increase of 28%. Since yesterday’s high we have seen a pullback to the $182 level above which it is currently being traded.

ltcusd-1h.png


On the hourly chart, you can see that the price of Litecoin is making an interaction with the 0.5 Fib level measured from the 27th of January until the 20th of February which was the five-wave impulse to the upside that developed after a prolonged correction in January. The price made another minor breakout from the start of March from the descending trendline and is now inside another ascending channel.

If the previous upside impulse was the next five-wave impulse to the upside, the price has made a corrective decrease afterward. This would bring the current rise as the next sub-wave of the upward impusle that is set to exceed February’s high of $246. But another possibility could be that the higher degree impulse ended in February with the seen five-wave move in which case the currently seen rise is the 2nd sub-wave of the higher degree correction. This is why now depending on the wave structure behind the move we are going to see which scenario is in play.

If the price makes another three-wave move it would mean that the rise since the start of the month is corrective, but if it continues moving to the upside in a five-wave manner that would be an early indication that we are going to see a further uptrend continuation and new yearly highs for the price of Litecoin above the February’s one.

Read Full on FXOpen Company Blog...
 
Gold Price Slides Below $1,700, Oil Price Approaches $65

Gold-price-oil-price-1.jpg


Gold price started a fresh decline below the $1,750 and $1,720 support levels. Crude oil price is still in a positive zone and it is approaching the $65.00 resistance.

Important Takeaways for Gold and Oil

  • Gold price started a steady decline and it even broke the $1,700 support against the US Dollar.
  • There is a major declining channel forming with resistance near $1,715 on the hourly chart of gold.
  • Crude oil price traded to a new multi-month high near $64.96.
  • There was a break above a key bearish trend line with resistance near $61.50 on the hourly chart of XTI/USD.

Gold Price Technical Analysis

Gold price struggled to stay above the $1,750 support and started a strong decline against the US Dollar. As a result, there was a break below the $1,720 and $1,715 support levels.

The price even declined below the $1,700 support and settled below the 50 hourly simple moving average. It traded as low as $1,687 on FXOpen and it is currently consolidating losses.

gold-price-chart.png


An initial resistance on the upside is near the $1,700 level. It is close to the 38.2% Fib retracement level of the recent decline from the $1,722 swing high to $1,687 low. The first major resistance is near the $1,710 level.

An intermediate resistance is near $1,705. It is close to the 50% Fib retracement level of the recent decline from the $1,722 swing high to $1,687 low. There is also a major declining channel forming with resistance near $1,715 on the hourly chart of gold.

The trend line is close to the 50 hourly simple moving average at $1,716. A close above the trend line resistance and a follow up move above $1,720 is needed for a fresh surge.

On the downside, the first major support is near the $1,688 level. The next major support is near the $1,675 level. Any more losses might call for a move towards the $1,650 support level.

Read Full on FXOpen Company Blog...
 
GBP/USD Turns Red While GBP/JPY Could Rise Further

gbp-1.jpg


GBP/USD surged above 1.4150 before starting a fresh decline below 1.4000. GBP/JPY is rising and it remains supported for more gains above 150.50

Important Takeaways for GBP/USD and GBP/JPY

  • The British Pound started a fresh decline below the 1.4000 support zone against the US Dollar.
  • There was a break below a rising channel with support near 1.3925 on the hourly chart of GBP/USD.
  • GBP/JPY climbed higher steadily above the 149.00 and 150.00 resistance levels.
  • There is a major bullish trend line forming with support near 149.70 on the hourly chart.

GBP/USD Technical Analysis

This past week, the British Pound topped near the 1.4200 level against the US Dollar. The GBP/USD pair started a fresh decline and traded below many key supports near the 1.4100 level.

The pair even broke the 1.4000 support level and settled below the 50 hourly simple moving average. Recently, there was a break below a rising channel with support near 1.3925 on the hourly chart of GBP/USD.

gbpusd-chart-1.png


The pair even spiked below the 1.3800 level. A low is formed near 1.3778 on FXOpen and the pair is currently consolidating losses. An initial resistance is near the 1.3885 level.

The 23.6% Fib retracement level of the recent decline from the 1.4016 high to 1.3778 low is also near the 1.3885 level. The next major resistance is near the 1.3890 level and the 50 hourly simple moving average.

The 50% Fib retracement level of the recent decline from the 1.4016 high to 1.3778 low is the next barrier near 1.3900. A close above the 1.3900 level may possibly lift the pair higher towards the 1.4000 resistance zone.

If not, there is a risk of more downsides below the 1.3800 support zone. The next major support is near the 1.3740 level, below which the pair could decline towards the 1.3680 level.

Read Full on FXOpen Company Blog...
 
Decisive Week Ahead for the ECB and the Euro

ecb.jpg


The first week of the month ended up with the Non-Farm Payrolls (NFP) in the United States showing a strong rebound of the US labor market. The NFP report revealed that the job market added double the number of jobs that the economists forecasted. As such, the perspective of a faster than expected recovery is not an illusion anymore but a fact.

On top of that, the White House announced that the US will have a vaccine available for every adult by the end of April this year. This puts the US economy in front when it comes to the economic recovery after the pandemic, as the vaccines appear to be effective and the rest of the world lags in its vaccination efforts.

Unsurprisingly, the US dollar gained across the board. The USDJPY closed the week above 108, the EURUSD pair fell to 1.19, and even the AUDUSD dropped three big figures from its 0.80 highs.

While the previous week was exciting, as all NFP weeks are, the week ahead is even more interesting. The name of the game this week is what the European Central Bank (ECB) will do at its Thursday meeting.
sp500.jpg


ECB in Focus This Week

The euro area economies did not perform so well as the United States economy did. Just the opposite. In Europe, the COVID-19 pandemic hit the economies multiple times, with two or three pandemic waves resulting in more deaths than expected. As a consequence, most of the economies were closed for most of last year and in 2021 as well.

So, when the US is thinking of the economic growth ahead, Europe barely deals with the pandemic. The European Commission failed to secure vaccines for its population, and the speed of administering the existing ones is much slower than anything we have seen in other countries (e.g., United States, United Kingdom, Israel). Like it or not, the difference will be seen in the economic performances in the period ahead, and Europe is poised to lag its rivals.

More problematic for the ECB is the tightening of long-term yields in the United States. The move higher in the US yields, which are the benchmark for risk-free rates in the world, triggered a similar move in other jurisdictions – e.g., the Bund yields in Germany are on the rise too.

unemployment-rate.jpg


Higher yields signal economic recovery. While in the US, higher yields are a logical market reaction to the improved economic picture and the fast vaccination rate, in Europe, higher yields bring a challenge. When yields are rising, financial conditions tighten. This is a problem for the ECB, as it does not want tightening conditions while the economy continues to underperform.

Hence, Thursday’s ECB meeting is crucial for the ECB and the euro. On the one hand, the ECB must act to wind down the unwanted tightening. On the other hand, the EURUSD exchange rate keeps trading in a tight correlation with the equity markets in the United States. Should the ECB expand the asset-buying program (i.e., PEPP), the EURUSD may fall much lower than the current levels.

FXOpen Blog
 
EUR/USD Remains at Risk, USD/CHF Correcting Gains

euro-3.jpg


EUR/USD started a fresh decline below the 1.2000 and 1.1920 support levels. USD/CHF traded towards the 0.9375 level before correcting gains.

Important Takeaways for EUR/USD and USD/CHF

  • The Euro started a fresh drop below the 1.2000 and 1.1920 support levels against the US Dollar.
  • There is a key bearish trend line forming with resistance near 1.1890 on the hourly chart of EUR/USD.
  • USD/CHF followed a bullish path and it broke the 0.9300 resistance zone before correcting lower.
  • There was a break below a connecting bullish trend line with support near 0.9295 on the hourly chart.

EUR/USD Technical Analysis

The Euro failed to extend gains above 1.2120 and started a fresh decline against the US Dollar. The EUR/USD pair broke the key 1.2000 pivot zone to move into a bearish zone.

The pair even broke the 1.1920 support level and settled below the 50 hourly simple moving average. The bears were able to push the pair below 1.1880 and a low is formed near 1.1836 on FXOpen.

eurusd-chart-1.png


It is currently correcting higher and trading above 1.1850. It even tested the 23.6% Fib retracement level of the recent decline from the 1.2112 high to 1.1836 low. There is also a key bearish trend line forming with resistance near 1.1890 on the hourly chart of EUR/USD.

If there is a break above the trend line resistance, the pair could correct higher towards the 1.1940 level. The next major resistance is near the 1.1975 level. It is close to the 50% Fib retracement level of the recent decline from the 1.2112 high to 1.1836 low.

If there is no upside break, the pair might continue to move down below 1.1850. The next key support is near the 1.1835 level, below which EUR/USD could decline towards the 1.1800 support. Any more losses could open the doors for a move towards the 1.1750 level.

Read Full on FXOpen Company Blog...
 
February 2021 TOP 10 PAMM Accounts Overview

pamm-review-february-2021.jpg


Although the winter is over, the early spring has not made things much brighter around the world. However, PAMM account managers continue to trade actively, adapting their strategies to the changing market. Investors’ goals are still the same — they want to invest their money in the most promising PAMM accounts with minimum risk and maximum profit.

On March 1, 2021, FXOpen launched a new round of “Money Managers” competition, where participants can not only show their skills in PAMM account management but also win up to 5,000 USD in prizes. Registration is open until May 1.

Read Full on FXOpen Company Blog...
 
BTC and XRP – Support found

btc.jpg


BTC/USD

The price of Bitcoin has fallen today to $53,548 at its lowest point from which we have seen an increase of 5.4% as a minor recovery was made to $56,388. Currently, the price is sitting at $55,893 as a pullback is being made but the price is still in an upward trajectory overall.

btcusd-1h-2.png


Looking at the hourly chart, you can see that the price has fallen back to the 0.382 Fibonacci level measured from the upward impulse from the start of the month to its new all-time high made on the 13th of March. This could be and most likely is the 4th wave out of the five-wave impulse to the upside from the next starting impulse wave to the upside. If that is true, then the price cannot fall inside the territory of the 1st wave which would be below the 0.5 Fib level at $52,361.

Now as we have seen a bounce off of the significant horizontal level at $54,497 it could mark the completion of this 4th wave which is why the increase seen today would be the 1st sub-wave of the next move to the upside that is set to push the price of Bitcoin above its prior all-time high an on to the new one. However, this has to be validated as the price could now be headed further down. The point of validation would be an increase above the 0.236 Fib level or the invalidation if the price continues moving below the 0.382 support.


Read Full on FXOpen Company Blog...
 
AUD/USD and NZD/USD Showing Signs of a Breakdown

aud-22.jpg


AUD/USD started a fresh decline from well above 0.7800 and declined below 0.7750. NZD/USD is also declining and it seems like it could break the 0.7150 support zone.

Important Takeaways for AUD/USD and NZD/USD

  • The Aussie Dollar started a fresh decline below the 0.7820 and 0.7800 support levels against the US Dollar.
  • There was a break below a couple of bearish continuation patterns near 0.7800 and 0.7755 on the hourly chart of AUD/USD.
  • NZD/USD declined sharply after it failed to surpass the 0.7270 resistance area.
  • There is a crucial bullish trend line forming with support near 0.7160 on the hourly chart of NZD/USD.

AUD/USD Technical Analysis

After a decent upward move above 0.7800, the Aussie Dollar faced sellers near 0.7850 against the US Dollar. The AUD/USD pair traded as high as 0.7848 on FXOpen and recently started a fresh decline.

There was a break below a few important supports near 0.7800. There was also a break below a couple of bearish continuation patterns near 0.7800 and 0.7755 on the hourly chart of AUD/USD.

audusd-chart.png


The pair even broke the 0.7780 support level and the 50 hourly simple moving average. A low is formed near 0.7724 on FXOpen and the pair is currently struggling to recover. An initial resistance on the upside is near the 0.7753 level.

It is close to the 23.6% Fib retracement level of the downward move from the 0.7848 high to 0.7724 low. The next major resistance is near the 0.7770 level or the 50 hourly simple moving average.

The main resistance is forming near the 0.7785 level. The 50% Fib retracement level of the downward move from the 0.7848 high to 0.7724 low is also near 0.7785. If there is no recovery above 0.7770 or 0.7785, there is a risk of more losses.

An initial support is near the 0.7725 level. If there is a downside break below 0.7725 and 0.7710, the pair could accelerate lower. In the stated case, it could even decline below 0.7700 and test 0.7650.

Read Full on FXOpen Company Blog...
 
Crude Oil Price Drops from the Highs, But Bullish Pressure Remains

oil.jpeg


One of the most spectacular market rallies this year formed on the oil market. After the dip below the zero level in April 2020, the price of oil rallied to $68 in March 2021.

The move higher comes in line with rising global demand as the global trade volume reaches pre-pandemic levels. However, the price of oil is higher now than the pre-pandemic levels and triggers expectations of higher inflation ahead.

Oil and Inflation – Why Should Traders Care?
oil.jpg


The problem with higher oil prices is that they trigger higher inflation expectations. As such, central banks are forced to intervene because they all use inflation as part of their mandate. More precisely, higher inflation above a central bank’s target leads to the central bank rising the interest rates. Hence, the currency market is the first one to be impacted by a move in the price of oil. Because traders try to anticipate the moves well ahead, the volatility in the currency market increases with the volatility in the oil market.

Last week’s drop of over 7% on a single trading day spooked some investors, but the price of oil found strong support at the $60 level. Moving forward, the focus shifts to the OPEC+ meeting scheduled at the start of April.

While the global oil demand increased in the last months as more economies reopen after lockdowns generated by the pandemic, there is still room to go. At current levels, demand is still less than pre-pandemic levels, so the price of oil may make new highs if the supply does not meet demand.

Speaking of supply, if OPEC does not increase production in the second quarter of the year, the risk is that the price of oil will make new highs. The vaccination pace in advanced economies is strong enough to trigger rapid economic recovery, creating a positive environment for further advances in the price of oil.

FXOpen Blog
 
EUR/USD Turns Red, USD/JPY Is Correcting Gains

Euro-EUR.jpg


EUR/USD started a fresh decline and traded below the key 1.1880 support zone. USD/JPY is correcting gains and it is now trading below the 108.80 support.

Important Takeaways for EUR/USD and USD/JPY

  • The Euro failed to continue higher above 1.1950 and started a fresh decline.
  • There is a key bearish trend line forming with resistance near 1.1915 on the hourly chart of EUR/USD.
  • USD/JPY started a downside correction from well above the 109.00 level.
  • There is a major bearish trend line forming with resistance near 108.65 on the hourly chart.

EUR/USD Technical Analysis

In the past few days, the Euro struggled to gain bullish momentum above 1.1950 against the US Dollar. The EUR/USD pair formed a swing high near 1.1946 on FXOpen and recently started a fresh decline.

There was a break below a few important supports near the 1.1890 and 1.1880 levels. The pair even settled below the 1.1880 support zone and the 50 hourly simple moving average. A low is formed near 1.1836 and the pair is currently consolidating losses.

eurusd-chart-3.png


An initial resistance is near the 1.1860 level. It is close to the 23.6% Fib retracement level of the recent decline from the 1.1946 swing high to 1.1836 low.

The first major resistance is now forming near the 1.1890 and 1.1880 levels. The 50% Fib retracement level of the recent decline from the 1.1946 swing high to 1.1836 low is also near 1.1891. Moreover, there is a key bearish trend line forming with resistance near 1.1915 on the hourly chart of EUR/USD.

Therefore, the pair must clear 1.1880 and 1.1920 to start a strong increase in the coming sessions. Conversely, the pair could continue to move down below the 1.1836 low. The first major support is near the 1.1820 level.

If there is a downside break below the 1.1820 support, the pair could dive towards the 1.1750 support in the near term. Any more losses might call for a test of the 1.1715 support level.

Read Full on FXOpen Company Blog...
 
LTC and EOS – Decrease seen but for how long?

ltc-1.jpg


LTC/USD

From the start of the week, the price of Litecoin has been in a decline, coming from its Monday’s high at $197.68 to $170.92 at its lowest point today, which was a decrease of 13.53% It is now stabilizing around $173 after a steep downfall made from yesterday when the price decreased by 12.7% as the price recovered close to the levels of Monday’s high before moving to the downside again.

ltcusd-1h-2.png


Looking at the hourly chart, you can see that the bearish count has been validated in which from the start of March we have seen an ABC correction to the upside. In that case, the descending move from the 13th of March is the 3rd wave from the higher degree correction and is now forming as a five-wave move. It appears that could end very soon around the 0.618 Fibonacci level at tje $167 area, but there would be a possibility that the descending might continue to the 0.786 one.

This is because by projecting the length of the first wave from the higher degree correction when the price of Litecoin was $245 and went to $155, we come up with a price target of $143.

Read Full on FXOpen Company Blog...
 
Gold Price Stuck Below $1,750, Oil Price Facing Hurdles

gold-price.jpg


Gold price started consolidating in a range above the $1,720 support. Crude oil price is now trading below $60.00 and $60.50 resistance levels.

Important Takeaways for Gold and Oil

  • Gold price is trading in a range above the $1,720 support against the US Dollar.
  • There are two connecting bearish trend lines forming with resistance near $1,738 on the hourly chart of gold.
  • Crude oil price is holding the key $57.50 and $57.40 support levels.
  • There is a major bearish trend line forming with resistance near $59.80 on the hourly chart of XTI/USD.

Gold Price Technical Analysis

gold-price-chart-2.png


Gold price made an attempt to surpass the $1,750 resistance against the US Dollar, but it failed. As a result, there was a fresh decline, but the bulls were active above the $1,720 support.

It seems like the price is forming a strong support base above the $1,720 zone. The recent low was formed near $1,722 on FXOpen before the price started an upward move. It broke the 23.6% Fib retracement level of the recent decline from the $1,745 swing high to $1,722 low.

An immediate resistance is near the $1,730 level and the 50 hourly simple moving average. The next key resistance is near the $1,733 level. It is close to the 50% Fib retracement level of the recent decline from the $1,745 swing high to $1,722 low.

There are also two connecting bearish trend lines forming with resistance near $1,738 on the hourly chart of gold. To start a strong increase, the price must clear trend lines and $1,740.

The main resistance is still near $1,750, above which the price could start a strong rally. Conversely, the price could fail to continue higher and it might decline below the $1,725 level.

The main support is near the $1,720 zone. A clear break below the $1,720 support may possibly start a strong decline towards $1,700 or even $1,680 in the near term.

Read Full on FXOpen Company Blog...
 
GBP/USD and GBP/JPY: British Pound Eyes Additional Gains

GBPUSD-Cable-Sterling.jpg


GBP/USD found support near 1.3670 and it is now correcting higher. GBP/JPY is rising and it remains supported for more gains above 150.00

Important Takeaways for GBP/USD and GBP/JPY

  • The British Pound declined below 1.3800, but it found support near 1.3670 against the US Dollar.
  • There was a break above a major bearish trend line with resistance near 1.3740 on the hourly chart of GBP/USD.
  • GBP/JPY is trading nicely above the 105.00 and 105.20 resistance levels.
  • There was also a break above a key bearish trend line with resistance near 149.20 on the hourly chart.

GBP/USD Technical Analysis

This past week, the British Pound saw a bearish wave below the 1.3850 support zone against the US Dollar. The GBP/USD pair even broke the 1.3720 support level.

However, the pair found support near the 1.3670 zone. A low was formed near 1.3670 on FXOpen and the pair recently started a fresh increase. It broke the 1.3700 and 1.3720 resistance levels.

gbpusd-chart-4.png


There was also a break above a major bearish trend line with resistance near 1.3740 on the hourly chart of GBP/USD. The pair is now trading nicely above the 1.3750 level and the 50 hourly simple moving average.

It is testing the 38.2% Fib retracement level of the key decline from the 1.4001 high to 1.3670 low. The first major resistance on the upside is near the 1.3825 level.

The next major resistance is near 1.3835 level or the 50% Fib retracement level of the key decline from the 1.4001 high to 1.3670 low. A clear upside break above the 1.3825 and 1.3835 resistance levels could open the doors for a larger increase.

If there is a fresh decline, the previous resistance near 1.3740 or the 50 hourly simple moving average might provide support. If there are additional losses, the pair could decline towards the 1.3700 level.

Read Full on FXOpen Company Blog...
 
BTC and XRP – Looking bullish

btc-xrp.jpg


BTC/USD

The price of Bitcoin has been on the rise since the 25th of March when it fell to $50,420 level. From there a recovery of 17.38% was measured to its highest point so far at $59,236. Currently, it is being traded slightly lower but is still on an upward trajectory.

btcusd-1h-4.png


The low on the 25th was the end of the corrective stage in which the price was since the 13th of March and as the third wave ended we have seen the start of the next impulsive move to the upside.

As its first wave looks like it has already developed now we could be already seeing the start of 3rd sub-wave from the five-wave impulse. The price would be now expected to continue moving upward above its last all-time high and potential somewhere around $68,000-$72,000 zone.

It is still soon to project the ending point so we are going to watch closely how the price action develops and reevaluate our projection accordingly. There could be a possibility that we are seeing an even higher degree impulse wave, increasing the room for growth.

Read Full on FXOpen Company Blog...
 
EUR/USD Dives, USD/CHF Likely To Continue Higher

EURUSD.png


EUR/USD started a fresh decline below the 1.1800 and 1.1780 support levels. USD/CHF is rising and it is likely to continue higher above 0.9450.

Important Takeaways for EUR/USD and USD/CHF

  • The Euro started a fresh drop below the 1.1850 and 1.1800 support levels against the US Dollar.
  • There is a major bearish trend line forming with resistance near 1.1755 on the hourly chart of EUR/USD.
  • USD/CHF is trading in a bullish zone above the 0.9350 resistance zone.
  • There is a key ascending channel forming with support near 0.9405 on the hourly chart.

EUR/USD Technical Analysis

eurusd-chart-4.png


The Euro failed to stay above the 1.1900 zone and started a fresh decline against the US Dollar. The EUR/USD pair broke the key 1.1850 pivot zone to move into a bearish zone.

The pair even broke the 1.1820 support level and settled below the 50 hourly simple moving average. The bears were able to push the pair below 1.1800 and a low is formed near 1.1709 on FXOpen.

It is currently showing a lot of bearish signs and it seems like there are high chances of more losses below the 1.1700 support zone. The next major support could be near the 1.1660 level, below which the pair may possibly test the 1.1620 support.

On the upside, an initial resistance is near the 1.1730 level. It is close to the 23.6% Fib retracement level of the recent decline from the 1.1804 high to 1.1709 low.

There is also a major bearish trend line forming with resistance near 1.1755 on the hourly chart of EUR/USD. The trend line is close to the 50% Fib retracement level of the recent decline from the 1.1804 high to 1.1709 low.

The 50 hourly simple moving average is also near 1.1760. If there is a break above the trend line resistance, the pair could correct higher towards the 1.1800 zone. The next major resistance is near the 1.1850 level.

Read Full on FXOpen Company Blog...
 
LTC and EOS – More upside expected

ltc.jpg


LTC/USD

The price of Litecoin has been on the rise from the 25th when it was being traded at $169. We have seen an increase of 18.7% as the price came up to $200 at its highest point today. Currently it is being traded slightly lower but is still in an upward trajectory overall.

ltcusd-1h.jpg


Looking at the hourly chart, we can see that the price came up to the 0.382 Fibonacci level and made an attempt to break out above it but failed to do so. The first attempt was made on the 29th from which we have seen some sideways movement below the level before finally another attempt was made today. The price would now be expected to make pullback as the 3rd attempt for a breakout failed, but we haven’t seen a rejection just yet.

If from the 25th we have seen the development of the 4th corrective wave out of the five-wave impulse to the downside now the price would be starting the development of its 5th wave to the downside which would be set to achieve a lower low compared to the 25th one. However, there could be a possibility that the decrease ended as a three-wave move as the part of the higher degree complex correction count, in which case the ascending move would be the first sub-wave of the next starting impulse to the upside.

In either way, we are going to see from the interaction with the 0.382 Fib level what would be the scenario, as if it manages to go above it, it would enter the territory of the 1st wave and invalidated the possibility of a lower low.

Read Full on FXOpen Company Blog...
 
GBP/USD Could Accelerate Higher, EUR/GBP Remains At Risk

GBPUSD-Sterling-1.jpg


GBP/USD is facing resistance near 1.3850, but it might accelerate higher. EUR/GBP is facing an increase in selling pressure below 0.8550.

Important Takeaways for GBP/USD and EUR/GBP

  • The British Pound is showing positive signs, but it is facing resistance near 1.3850.
  • There is a key bullish trend line forming with support at 1.3810 on the hourly chart of GBP/USD.
  • EUR/GBP declined below the 0.8580 and 0.8550 support levels.
  • There is a connecting bearish trend line forming with resistance near 0.8510 on the hourly chart.

GBP/USD Technical Analysis

gbpusd-chart.png


After forming a support base above 1.3720, the British Pound started a fresh increase against the US Dollar. The GBP/USD pair broke the 1.3780 and 1.3800 resistance levels to move into a positive zone.

There was also a close above the 1.3800 level and the 50 hourly simple moving average. The pair is now facing a strong resistance near the 1.3850 level. The recent high was formed near 1.3852 on FXOpen before there was a minor downside correction.

There was a break below the 1.3825 level. The pair even declined below the 23.6% Fib retracement level of the upward move from the 1.3746 swing low to 1.3852 high.

The pair is now holding the 1.3800 support zone and the 50 hourly simple moving average. There is also a key bullish trend line forming with support at 1.3810 on the hourly chart of GBP/USD. The trend line is close to the 50% Fib retracement level of the upward move from the 1.3746 swing low to 1.3852 high.

If there is a downside break below the trend line, the pair could decline towards the 1.3780 and 1.3770 support levels. Any more losses might lead the pair towards the key 1.3720 support.

On the upside, the pair is facing hurdles near the 1.3850 level. A clear upside break above the 1.3850 level could open the doors for a steady increase. In the stated case, GBP/USD could rise towards the 1.6000 level in the near term.


Read Full on FXOpen Company Blog...
 
Top