Gold Price and Crude Oil Price Could Start Fresh Increase
Gold price is trading in a positive zone above the $1,850 support. Crude oil price must clear $80.00 to start a fresh increase in the near term.
Important Takeaways for Gold and Oil
Gold Price Technical Analysis
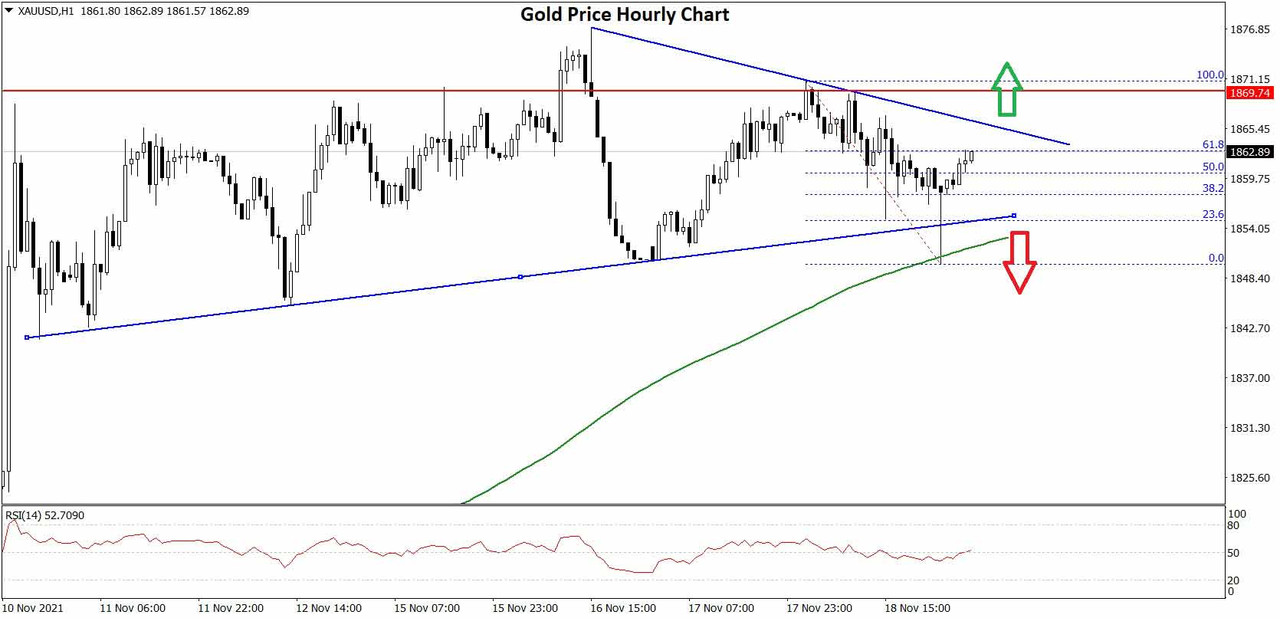
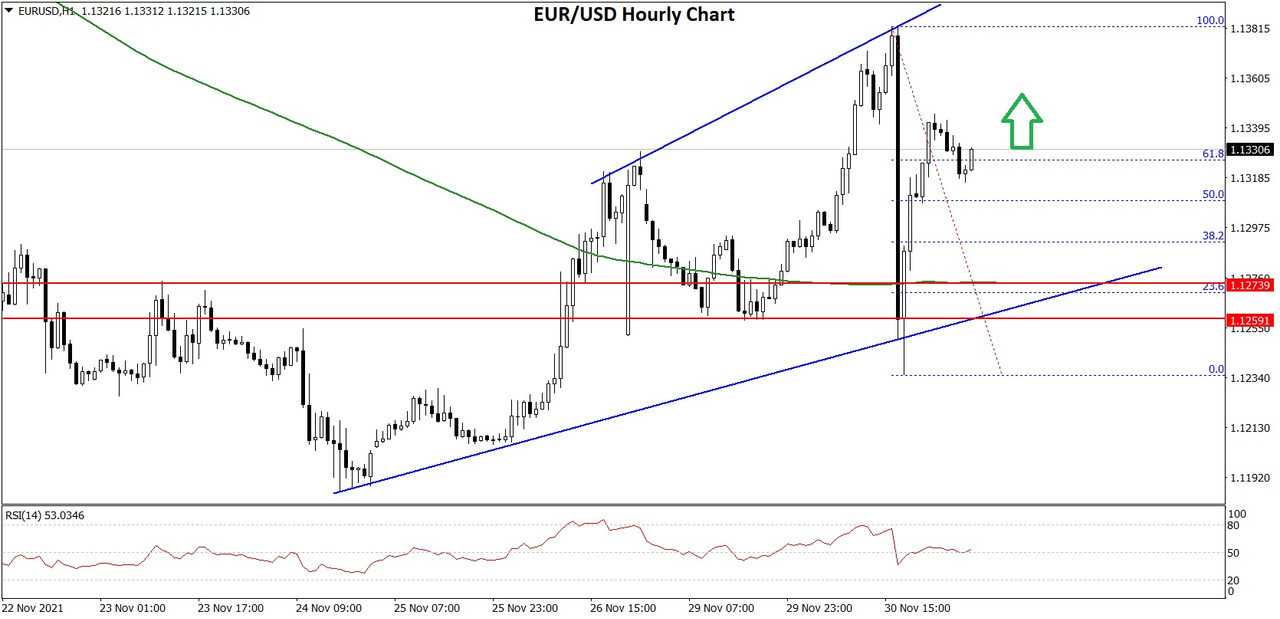
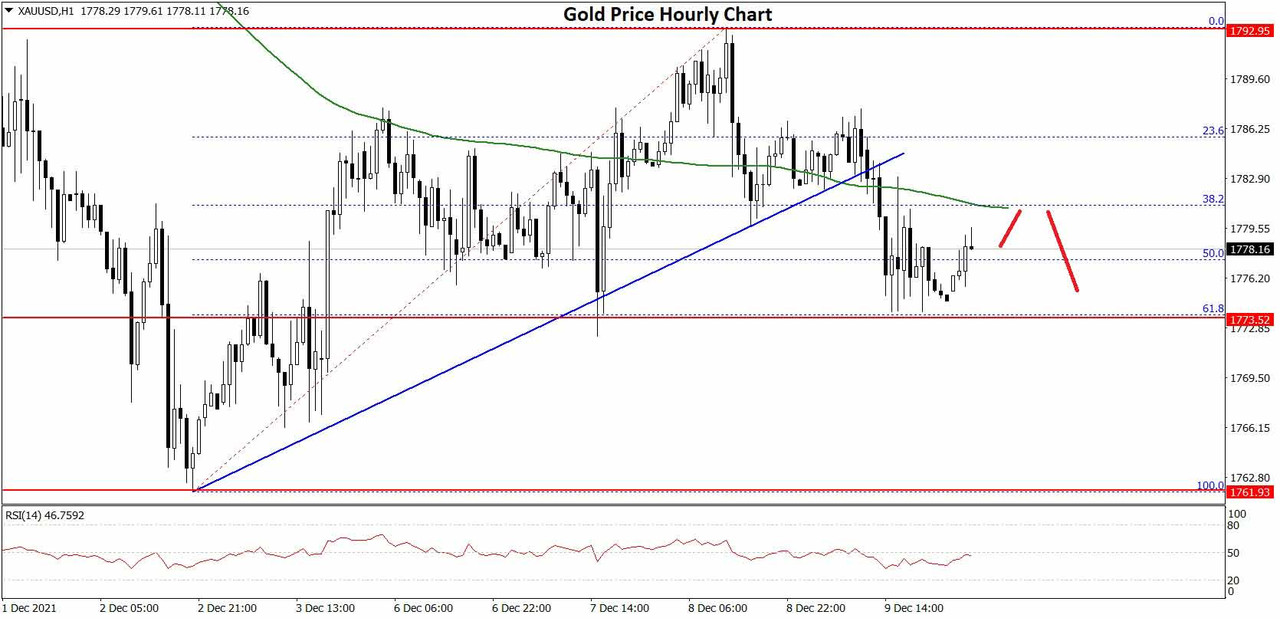
Gold price started a fresh increase above the $1,820 resistance level against the US Dollar. The price gained pace and it was able to settle above the $1,842 resistance zone.
The price even settled above the $1,850 level and the 50 hourly simple moving average. Finally, there was a break above the $1,870 level. A high was formed near $1,877 on FXOpen and the price corrected lower. There was a break below the $1,865 level, but the bulls remained active near $1,850.
A low is formed near $1,850 and the price is now rising. The price is back above the $1,860 level and the 50 hourly simple moving average. It also surpassed the 50% Fib retracement level of the recent decline from the $1,871 swing high to $1,850 low.
An immediate resistance on the upside is near the $1,863 level. It is near the 61.8% Fib retracement level of the recent decline from the $1,871 swing high to $1,850 low. The first major resistance is near the $1,865 level.
There is also a key contracting triangle forming with resistance near $1,865 on the hourly chart of gold. The main resistance is near the $1,870 level. A close above the $1,870 level could open the doors for a steady increase towards $1,885.
The next major resistance sits near the $1,900 level. On the downside, an initial support is near the $1,855 level. The first major support is near the $1,850 level. A downside break below the $1,850 support zone may possibly spark a steady decline. In the stated case, the price could test the $1,820 support.
Read Full on FXOpen Company Blog...
Gold price is trading in a positive zone above the $1,850 support. Crude oil price must clear $80.00 to start a fresh increase in the near term.
Important Takeaways for Gold and Oil
- Gold price started a decent increase above the $1,850 resistance against the US Dollar.
- There is a key contracting triangle forming with resistance near $1,865 on the hourly chart of gold.
- Crude oil price corrected lower below $80.00 and tested the $76.50 zone.
- There was a break above a key bearish trend line with resistance near $78.50 on the hourly chart of XTI/USD.
Gold Price Technical Analysis
Gold price started a fresh increase above the $1,820 resistance level against the US Dollar. The price gained pace and it was able to settle above the $1,842 resistance zone.
The price even settled above the $1,850 level and the 50 hourly simple moving average. Finally, there was a break above the $1,870 level. A high was formed near $1,877 on FXOpen and the price corrected lower. There was a break below the $1,865 level, but the bulls remained active near $1,850.
A low is formed near $1,850 and the price is now rising. The price is back above the $1,860 level and the 50 hourly simple moving average. It also surpassed the 50% Fib retracement level of the recent decline from the $1,871 swing high to $1,850 low.
An immediate resistance on the upside is near the $1,863 level. It is near the 61.8% Fib retracement level of the recent decline from the $1,871 swing high to $1,850 low. The first major resistance is near the $1,865 level.
There is also a key contracting triangle forming with resistance near $1,865 on the hourly chart of gold. The main resistance is near the $1,870 level. A close above the $1,870 level could open the doors for a steady increase towards $1,885.
The next major resistance sits near the $1,900 level. On the downside, an initial support is near the $1,855 level. The first major support is near the $1,850 level. A downside break below the $1,850 support zone may possibly spark a steady decline. In the stated case, the price could test the $1,820 support.
Read Full on FXOpen Company Blog...