Daily Technical Analysis
31st March 2014
EURUSD
Summary
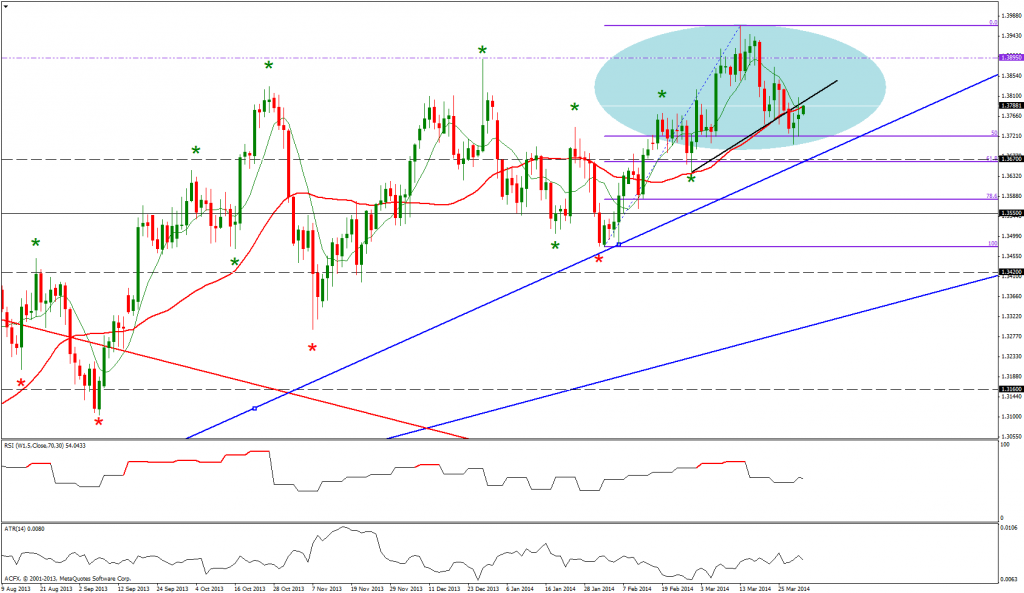
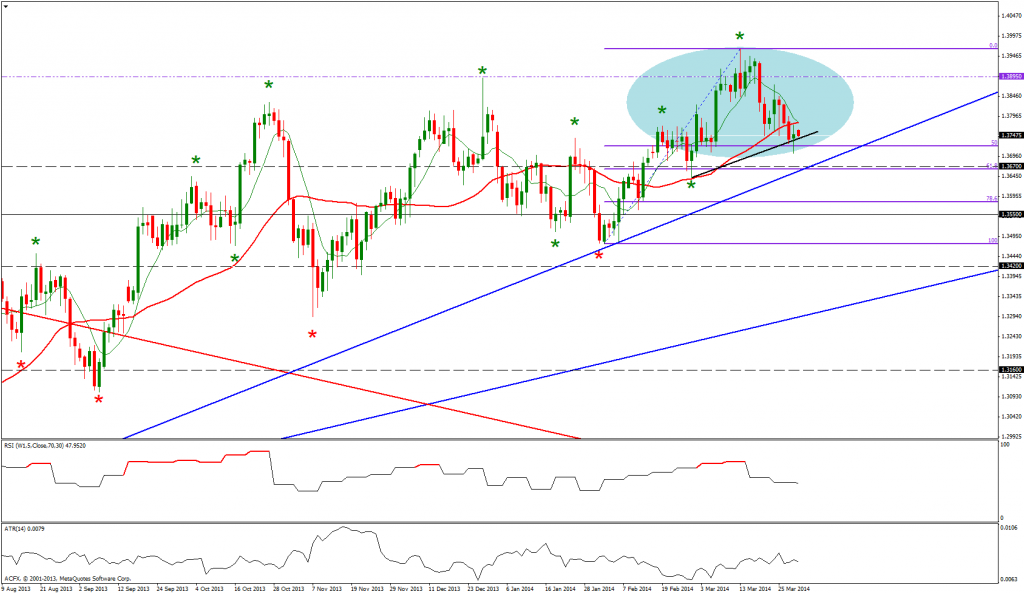
Friday EURUSD attempted to trade into the 50 to 61.8% Fibonacci support only for buying to come into the market. By the end of business EURUSD closed up on the day.
Market overview
EURUSD continues to trade in a daily uptrend following the breach of the 1.3741 level being the 24th January swing. This price action has put the daily time frame in gear with the positive weekly trend. However there has been a recent strong correction which has had the effect of creating a bearish head and shoulders pattern that is marked by the ellipse. A break beneath the right shoulder could see EURUSD trade down to trend line support.
Focus on today
This morning EURUSD has opened quietly as it trades within the previous days range.
I am this morning monitoring the price action for a potential test of the 1.3670 support level.
Alternatively if EURUSD fails to sustain lower prices there is a possibility that this pair trades back to its averages.
GBPUSD
Summary
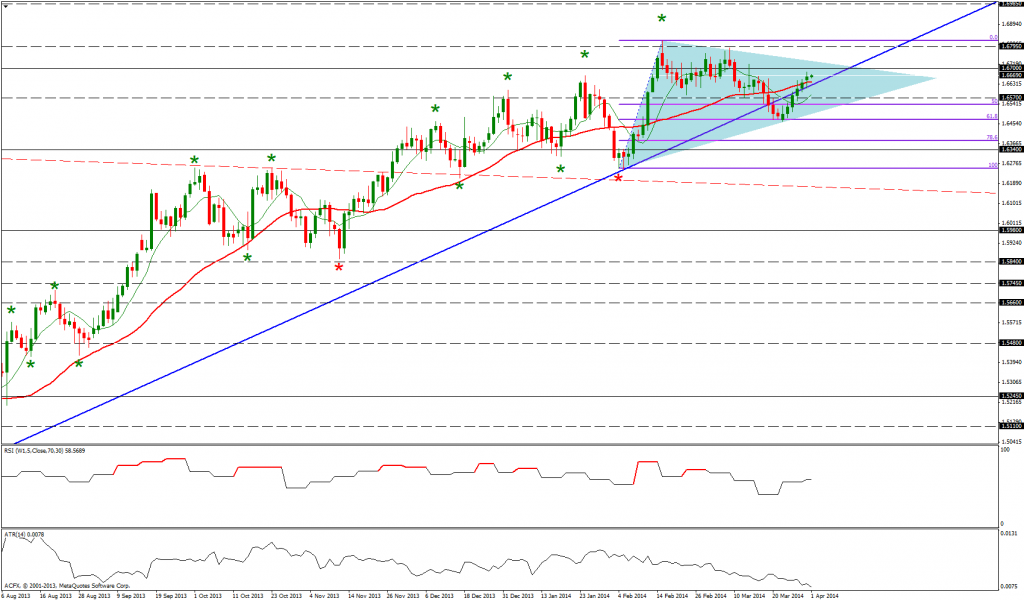
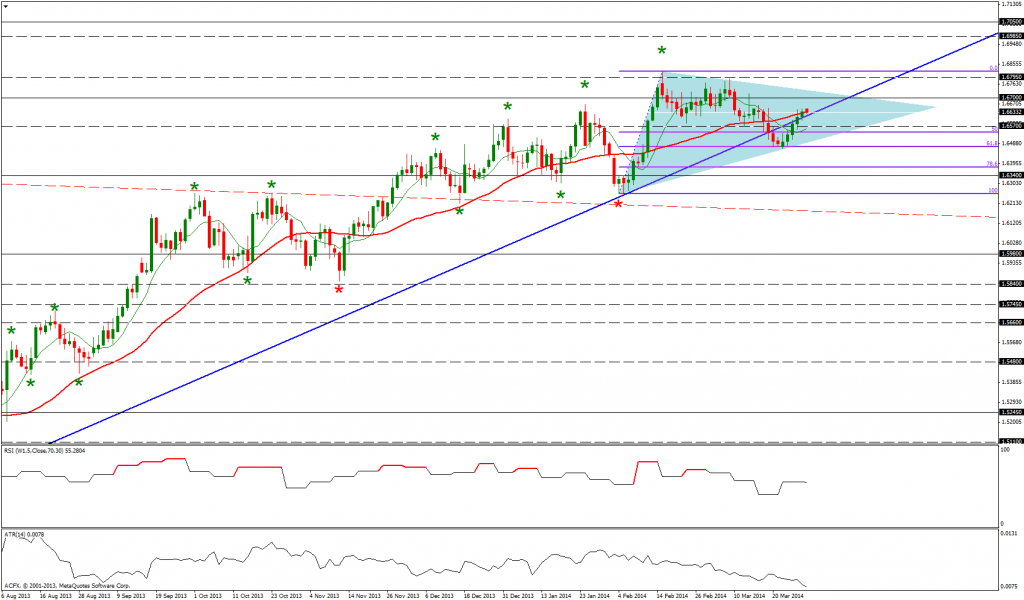
Friday GBPUSD continued to trade above the above the prior broken up trend line.
Market overview
GBPUSD has traded above the 1.6668 being the prior isolated pivot high. This price activity has effectively changed the daily trend to up and puts it in line with the bullish weekly outlook.
More recently GBPUSD has experienced a strong downside correction and this has had the effect of creating a large converging triangle consolidation pattern. As GBPUSD has bow bounced off Fibonacci support and with the weekly trend pointing up I would expect this triangle pattern when it breaks to trade higher.
Focus on today
This morning GBPUSD has opened quietly as the price action trades at the highs of the recent up move.
I am today monitoring the price action for a test of 34 period daily moving averages and move in the direction of the 1.6700 resistance level.
Alternatively if GBPUSD cannot sustain higher prices could see the price action test the 1.6570 support level.
USDJPY
Summary
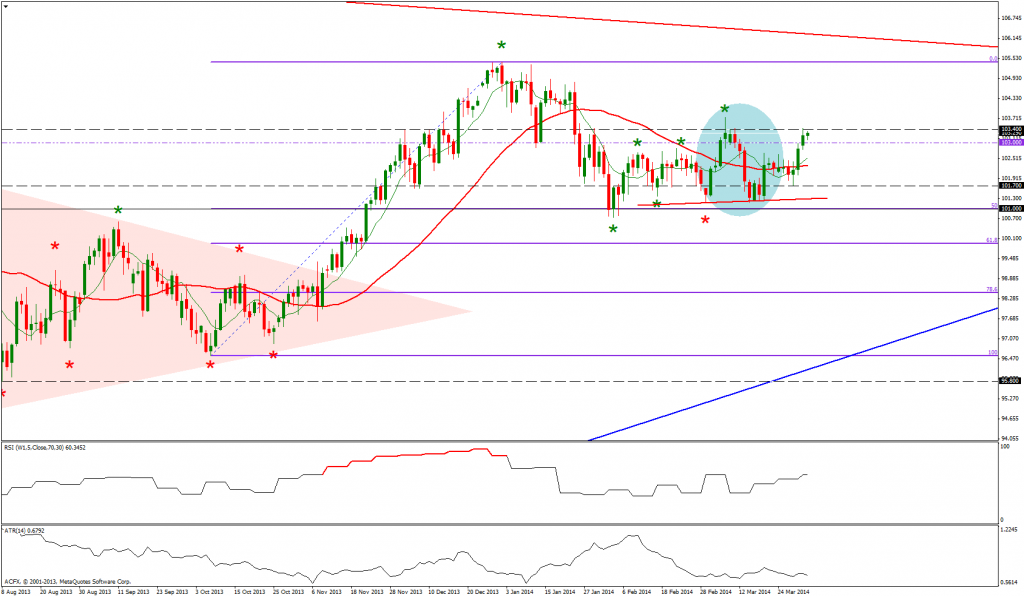
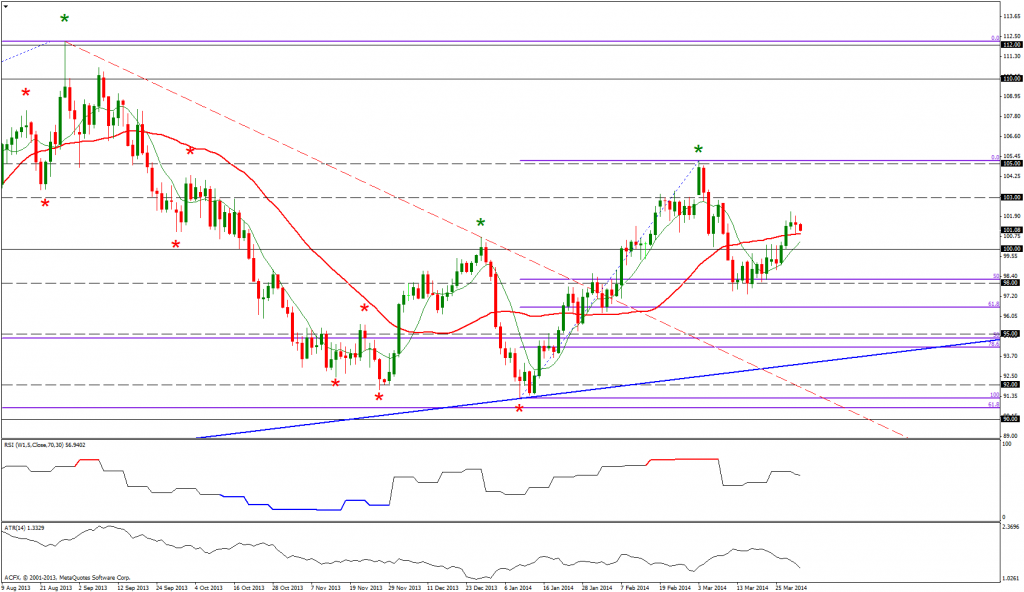
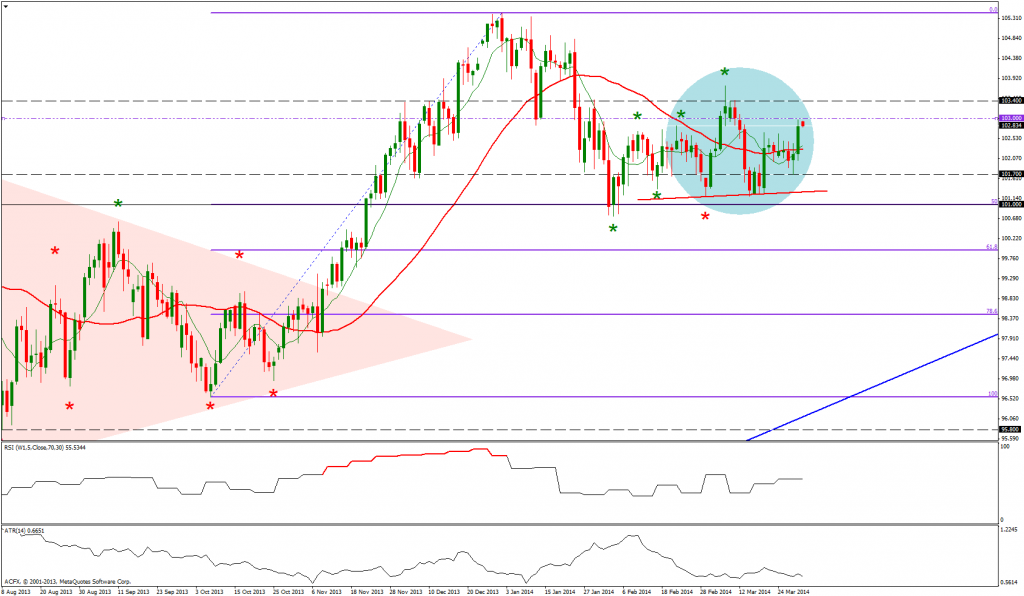
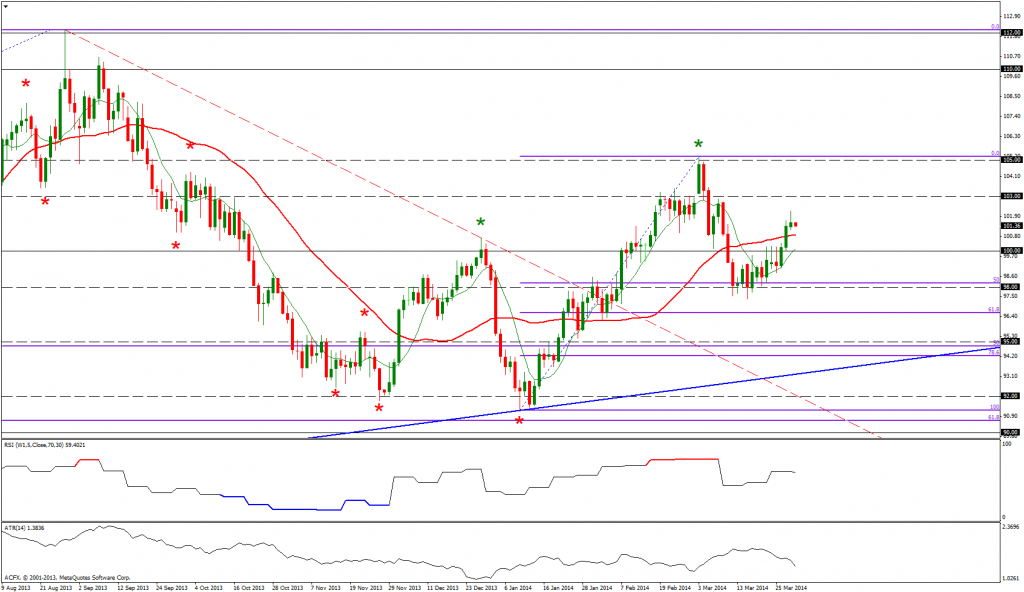
Friday USDJPY broke higher from its recent congrestion area and tested but did not break above the 103.00 resistance level.
Market overview
The breach of the 102.83 level being the swing high of the 21st February has effectively changed the daily trend to up and therefore putting this time frame into gear with the bullish weekly time frame. The recent price action is now indicating that the 101.00 support level is likely to hold. This is being confirmed by failure of the head and shoulders pattern to break lower.
Focus on today
This morning USDJPY has opened quietly as the price action trades at the highs Friday’s range.
Today I am monitoring a potential test of the 103.00 level.
Alternatively a failure to sustain higher prices could see USDJPY trade down to its averages.
USDCHF

Summary
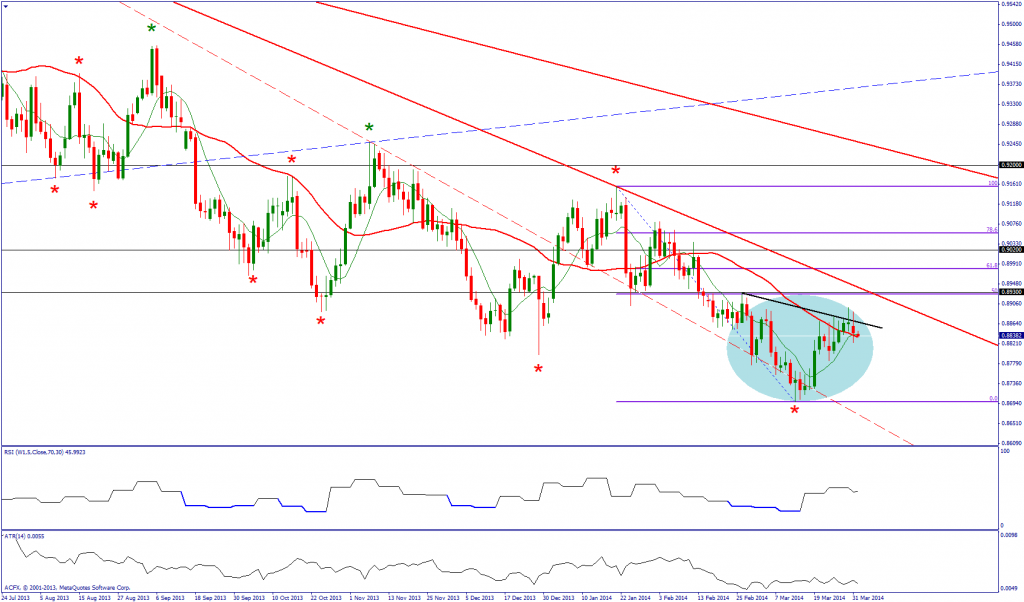
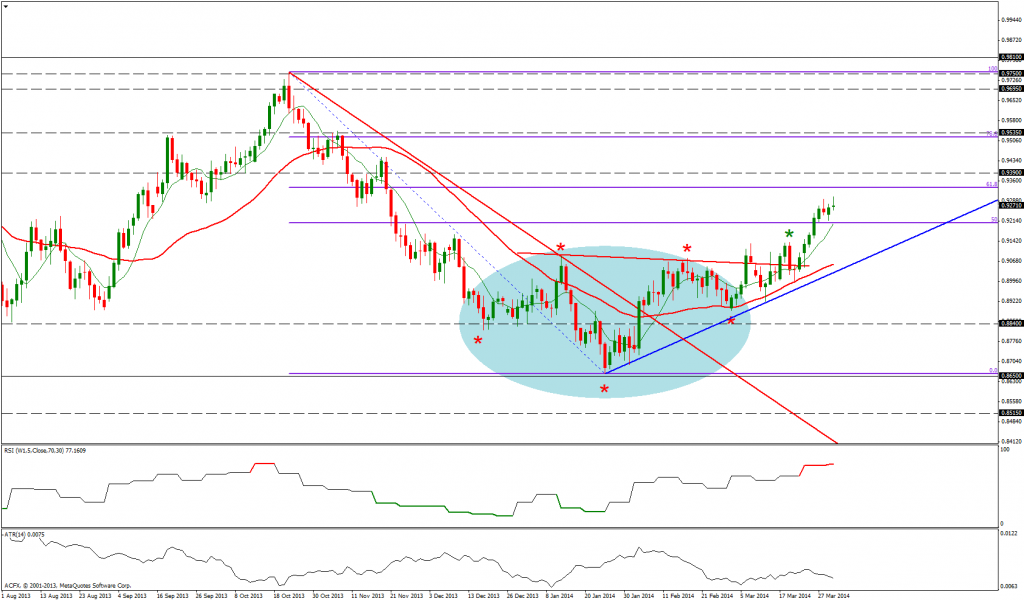
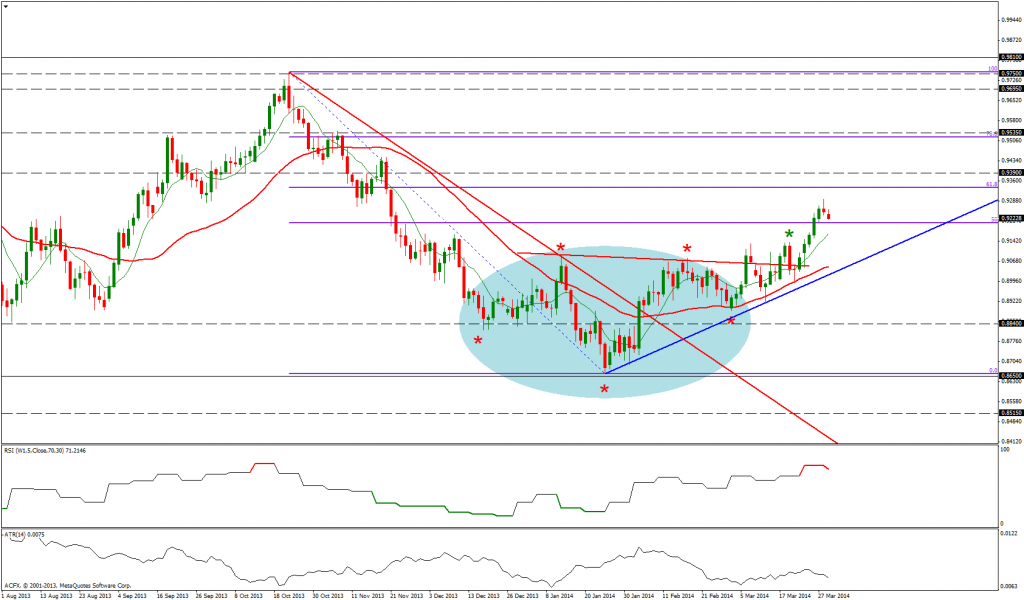
Friday USDCHF attempted to break higher only for sellers to come into the market.
Market overview
USDCHF continues to trade in a negative daily and weekly swing bias but the recent price action is beginning to take on a bullish feel to it. I am therefore monitoring signs for a base to be built that will allow for further upside move and a test of the downward sloping trend line. The bullish inverse head and shoulders pattern that is forming puts the price pattern in line with this hypothesis. However daily and weekly bias does continue to be fixed to the downside therefore shorting rallies is still probably the most logical strategy to adopt.
Focus on today
This morning USDCHF has opened positively as within Friday’s candle range.
Today I am monitoring the price action for a move to Fibonacci resistance.
Alternatively a failure to sustain higher prices could see USDCHF trade back to its averages.
Gold
Summary
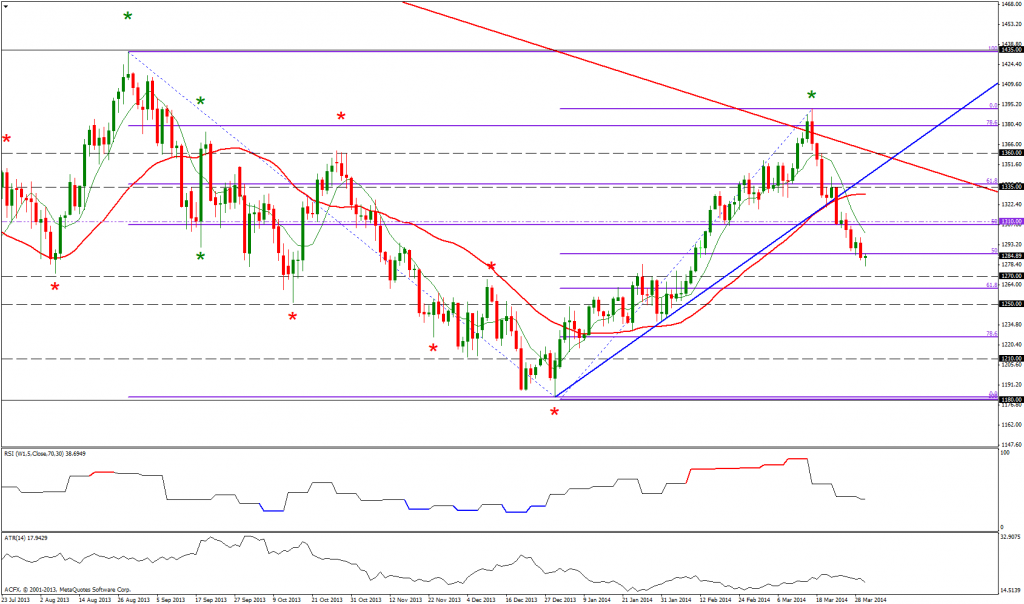
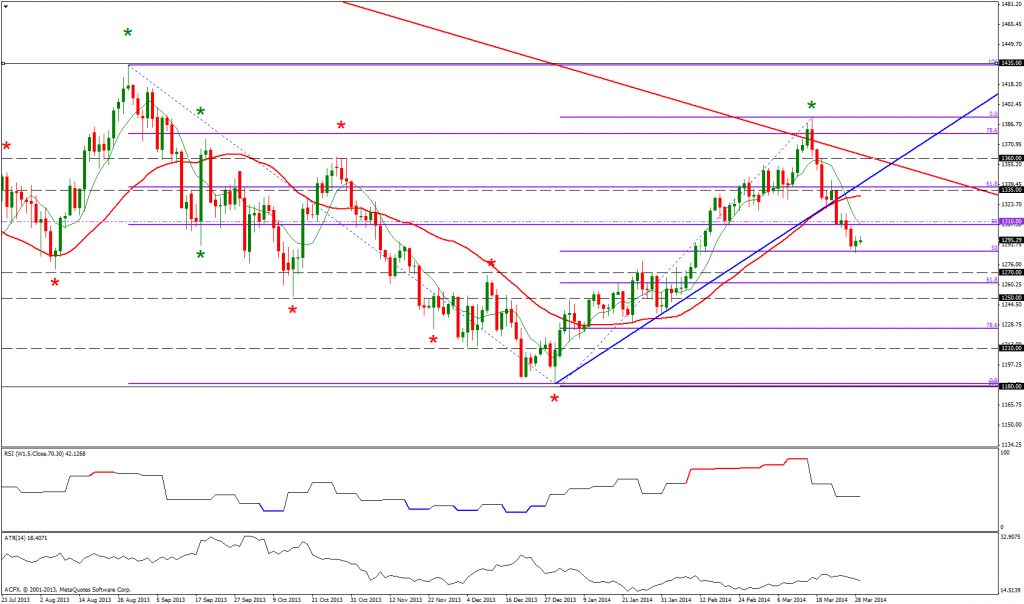
Friday Gold traded lower only for it to bounce off the 50% Fibonacci level and close higher.
Market overview
Gold continues to trade in a daily uptrend following the breach of the 1267.99 level being the swing high of the 10th December. The break above the large downward sloping trend line adds impetus to the current positive swing bias. Furthermore we have witnessed a large multi month double bottom forming which could indicate a large upside trend reversal is a possibility.
However the weekly time frame continues to point down. That the recent rejection of higher prices has come off a bounce from a downward sloping trend line and Fibonacci resistance level could indicate that the recent rally in Gold is part of a bigger cycle correction that ultimately sends Gold lower.
That Gold has experienced a strong daily time frame correction has pushed the price action towards Fibonacci support and the ability or not of Fibonacci support to push Gold higher will give an indication if the bullish daily up trend or the bearish weekly down trend will win this current battle.
Focus on today
This morning Gold has opened quietly as the price within the previous days candle range.
Today I am monitoring the price action for Gold to test the 1310.00 level.
Alternatively a failure to sustain higher prices could see Gold trade down to the 0.618 Fibonacci support area.
Oil
Summary
Friday Oil continued to trade higher following its succesful test the 100 level and close above the 34 period daily moving averages.
Market overview
Oil continues to trade in a daily uptrend following the breach of the 100.72 level being the swing high of the 24th December. The daily and weekly times both have a positive bias. The recent price activity has seen the price action perform a text book move by trading down to Fibonacci support and from there bouncing higher.
Focus on today
This morning Oil has opened quietly with the price action trading within Friday’s candle range.
Today I am monitoring the price action for a test of the 103.00 resistance level.
Alternatively a failure to sustain higher prices could see Oil trade under the 100 level and test the 8 period daily moving averages.
AUDUSD
Summary
Friday AUDUSD experience its first lower daily close which was followed by 5 preceeeding up days. This down day occurred in the 50 to 61.8 Fibonacci resistance area.
Market overview
AUDUSD has been trading in a daily uptrend following the breach of the 0.9080 level being the swing high of the 18th February. However the weekly chart continues to trade in a weekly down trend with the price action now trading into the Fibonacci resistance area. That AUDUSD has formed a large inverse head and shoulders pattern it will be interesting to see if either this pattern trades to its upside target which comes in at the 0.9535 level of if Fibonacci resistance will offer a strong barrier to further upside momentum.
Focus on today
This morning AUDUSD has opened negativley as the price action trades below Friday’s range.
I am this morning monitoring the price action for a potential move back down to the 8 period daily moving averages.
Alternatively if AUDUSD fails to sustain lower prices there is a possibility that AUDUSD tests Friday’s high.
Dow30
Summary
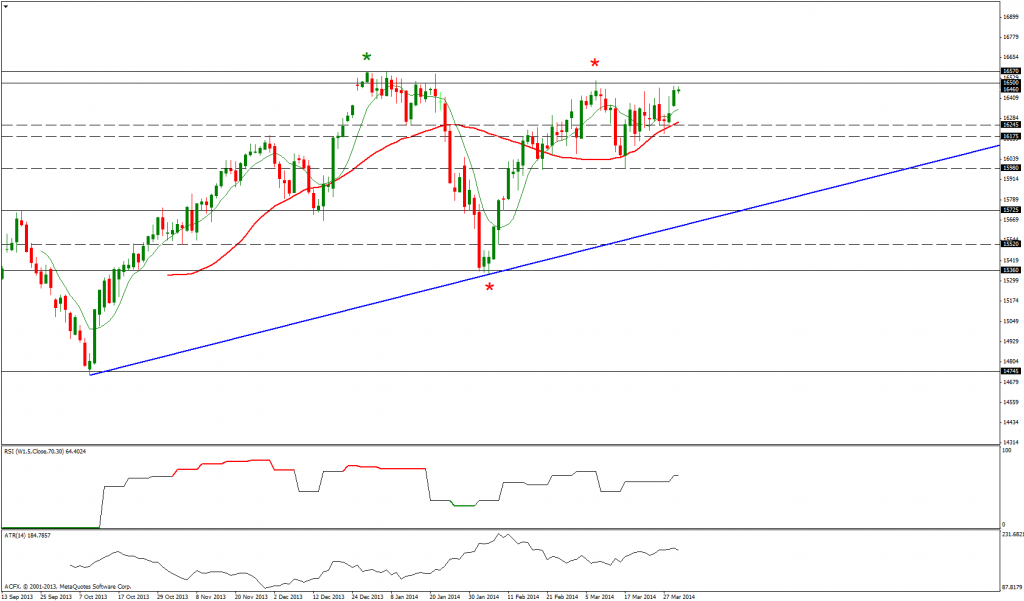
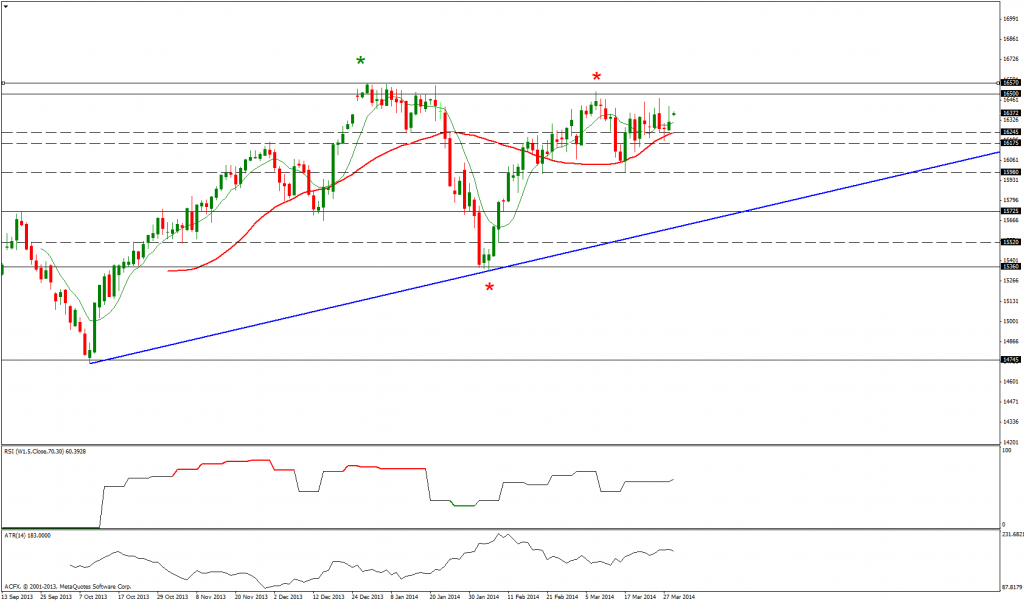
Friday Dow30 continues to trade at the averages.
Market overview
Dow30 has been trading in a daily down trend following the breach of the 15664 level being the swing low pivot of the 26th December. However the weekly chart continues to trade in a weekly up trend.
Focus on today
This morning Dow30 hasopened quietly as the price action trades within the previous 9 days candle range.
I am this morning monitoring the price action for a potential re-test of the 16447 level being last week’s high.
Alternatively if Dow30 fails to sustain higher prices there is a possibility that Dow30 tests the 16175 level.
31st March 2014
EURUSD
Summary
Friday EURUSD attempted to trade into the 50 to 61.8% Fibonacci support only for buying to come into the market. By the end of business EURUSD closed up on the day.
Market overview
EURUSD continues to trade in a daily uptrend following the breach of the 1.3741 level being the 24th January swing. This price action has put the daily time frame in gear with the positive weekly trend. However there has been a recent strong correction which has had the effect of creating a bearish head and shoulders pattern that is marked by the ellipse. A break beneath the right shoulder could see EURUSD trade down to trend line support.
Focus on today
This morning EURUSD has opened quietly as it trades within the previous days range.
I am this morning monitoring the price action for a potential test of the 1.3670 support level.
Alternatively if EURUSD fails to sustain lower prices there is a possibility that this pair trades back to its averages.
GBPUSD
Summary
Friday GBPUSD continued to trade above the above the prior broken up trend line.
Market overview
GBPUSD has traded above the 1.6668 being the prior isolated pivot high. This price activity has effectively changed the daily trend to up and puts it in line with the bullish weekly outlook.
More recently GBPUSD has experienced a strong downside correction and this has had the effect of creating a large converging triangle consolidation pattern. As GBPUSD has bow bounced off Fibonacci support and with the weekly trend pointing up I would expect this triangle pattern when it breaks to trade higher.
Focus on today
This morning GBPUSD has opened quietly as the price action trades at the highs of the recent up move.
I am today monitoring the price action for a test of 34 period daily moving averages and move in the direction of the 1.6700 resistance level.
Alternatively if GBPUSD cannot sustain higher prices could see the price action test the 1.6570 support level.
USDJPY
Summary
Friday USDJPY broke higher from its recent congrestion area and tested but did not break above the 103.00 resistance level.
Market overview
The breach of the 102.83 level being the swing high of the 21st February has effectively changed the daily trend to up and therefore putting this time frame into gear with the bullish weekly time frame. The recent price action is now indicating that the 101.00 support level is likely to hold. This is being confirmed by failure of the head and shoulders pattern to break lower.
Focus on today
This morning USDJPY has opened quietly as the price action trades at the highs Friday’s range.
Today I am monitoring a potential test of the 103.00 level.
Alternatively a failure to sustain higher prices could see USDJPY trade down to its averages.
USDCHF
Summary
Friday USDCHF attempted to break higher only for sellers to come into the market.
Market overview
USDCHF continues to trade in a negative daily and weekly swing bias but the recent price action is beginning to take on a bullish feel to it. I am therefore monitoring signs for a base to be built that will allow for further upside move and a test of the downward sloping trend line. The bullish inverse head and shoulders pattern that is forming puts the price pattern in line with this hypothesis. However daily and weekly bias does continue to be fixed to the downside therefore shorting rallies is still probably the most logical strategy to adopt.
Focus on today
This morning USDCHF has opened positively as within Friday’s candle range.
Today I am monitoring the price action for a move to Fibonacci resistance.
Alternatively a failure to sustain higher prices could see USDCHF trade back to its averages.
Gold
Summary
Friday Gold traded lower only for it to bounce off the 50% Fibonacci level and close higher.
Market overview
Gold continues to trade in a daily uptrend following the breach of the 1267.99 level being the swing high of the 10th December. The break above the large downward sloping trend line adds impetus to the current positive swing bias. Furthermore we have witnessed a large multi month double bottom forming which could indicate a large upside trend reversal is a possibility.
However the weekly time frame continues to point down. That the recent rejection of higher prices has come off a bounce from a downward sloping trend line and Fibonacci resistance level could indicate that the recent rally in Gold is part of a bigger cycle correction that ultimately sends Gold lower.
That Gold has experienced a strong daily time frame correction has pushed the price action towards Fibonacci support and the ability or not of Fibonacci support to push Gold higher will give an indication if the bullish daily up trend or the bearish weekly down trend will win this current battle.
Focus on today
This morning Gold has opened quietly as the price within the previous days candle range.
Today I am monitoring the price action for Gold to test the 1310.00 level.
Alternatively a failure to sustain higher prices could see Gold trade down to the 0.618 Fibonacci support area.
Oil
Summary
Friday Oil continued to trade higher following its succesful test the 100 level and close above the 34 period daily moving averages.
Market overview
Oil continues to trade in a daily uptrend following the breach of the 100.72 level being the swing high of the 24th December. The daily and weekly times both have a positive bias. The recent price activity has seen the price action perform a text book move by trading down to Fibonacci support and from there bouncing higher.
Focus on today
This morning Oil has opened quietly with the price action trading within Friday’s candle range.
Today I am monitoring the price action for a test of the 103.00 resistance level.
Alternatively a failure to sustain higher prices could see Oil trade under the 100 level and test the 8 period daily moving averages.
AUDUSD
Summary
Friday AUDUSD experience its first lower daily close which was followed by 5 preceeeding up days. This down day occurred in the 50 to 61.8 Fibonacci resistance area.
Market overview
AUDUSD has been trading in a daily uptrend following the breach of the 0.9080 level being the swing high of the 18th February. However the weekly chart continues to trade in a weekly down trend with the price action now trading into the Fibonacci resistance area. That AUDUSD has formed a large inverse head and shoulders pattern it will be interesting to see if either this pattern trades to its upside target which comes in at the 0.9535 level of if Fibonacci resistance will offer a strong barrier to further upside momentum.
Focus on today
This morning AUDUSD has opened negativley as the price action trades below Friday’s range.
I am this morning monitoring the price action for a potential move back down to the 8 period daily moving averages.
Alternatively if AUDUSD fails to sustain lower prices there is a possibility that AUDUSD tests Friday’s high.
Dow30
Summary
Friday Dow30 continues to trade at the averages.
Market overview
Dow30 has been trading in a daily down trend following the breach of the 15664 level being the swing low pivot of the 26th December. However the weekly chart continues to trade in a weekly up trend.
Focus on today
This morning Dow30 hasopened quietly as the price action trades within the previous 9 days candle range.
I am this morning monitoring the price action for a potential re-test of the 16447 level being last week’s high.
Alternatively if Dow30 fails to sustain higher prices there is a possibility that Dow30 tests the 16175 level.