• The Forex, Binary Options Forum - welcomes you to our Community!

    DigitalCashPalace Forum is dedicated to discussions about Forex, Binary Options, commodities, stocks related.

    Please take a look around, and feel free to .

jimmy forex analysis

Technical Analysis
AUD/USD Forecast March 7, 2014, Technical Analysis

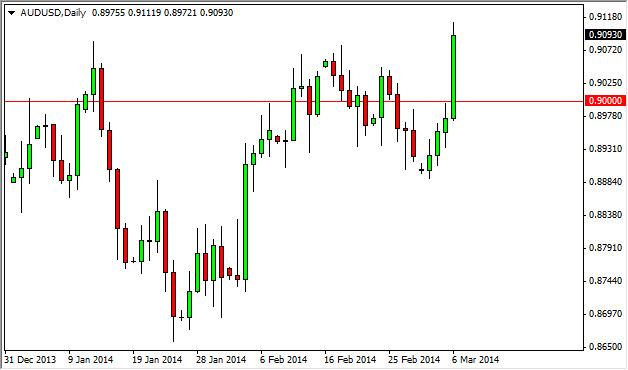
The AUD/USD pair rose during the session on Thursday, smashing through the barriers of resistance that we have seen for some time now. Because of this, the outlook on this market has changed drastically, as a move above the 0.91 level on a daily close would be enough to start buying it. It would essentially form the completion of an inverse head and shoulders, which of course would be a very bullish outlook. We believe that today’s nonfarm payroll report might be the volatility needed to break out. The meantime though, we are on the sidelines

audusd4.jpg


More Info
 
EUR/USD Current price: 1.3873
eurusdh1_20140309225835.png


Week start with a mild risk off sentiment over escalating tensions in Ukraine and bad data coming from China: as over the weekend, the country’s trade balance and inflation readings missed expectations, both signaling slowing growth. But so far, the EUR/USD holds around Friday’s close, with the hourly chart showing indicators already corrected extreme overbought readings and rest flat around their midlines, while price hovers around a slightly bullish 20 SMA. In the 4 hours chart however, the pair maintains a strong upward momentum despite indicator stands in overbought territory. Dollar may catch a breath if risk sentiment takes over markets, albeit buyers will likely surge on dips, keeping price above the 1.3800 figure.

Support levels: 1.3850 1.3820 1.3770

Resistance levels: 1.3920 1.3960 1.4000


More Pair
 
GBP/USD Forecast March 11, 2014, Technical Analysis

The GBP/USD pair fell during the session on Friday, but found enough support near the 1.6650 handle to bounce slightly at the end of the day. With that, we feel that this market continues to grind sideways, ultimately breaking higher though as the bullishness should continue. However, the recent move higher was extraordinarily parabolic, so we feel that this market is simply taking a rest before heading towards the 1.70 level.

gbpusd7.jpg
 
GBP/USD Forecast March 12, 2014, Technical Analysis

The GBP/USD pair did very little during the session on Tuesday, but did print a negative candle. The printed somewhat of a hammer, based upon the 1.664 level. With that being the case, we feel that support continues to enter the market right about here, thereby making a break above the top of this hammer a decent buy signal. We don’t necessarily believe that the market is going to go straight back up, but recognize that we are in a decent range trading environment. With that, we are buyers but only for the short-term.

gbpusd8.jpg
 
EUR/USD Forecast March 14, 2014, Technical Analysis

The EUR/USD pair broke higher during the session initially on Thursday, but found so much resistance above the trend line on the monthly chart that the market turned back around and formed a massive shooting star. This could be the beginning of the selloff that keeps us in the downtrend on the monthly chart, or a could signify that we are going to try and go higher and break above the top of the shooting star. Below the 1.38 level, we would be interested in selling, just as a break above the top of the shooting star would have us interested in buying for longer term.

Sell - S3: 1.3849 | S2: 1.3853 |S1: 1.3856 |PP: 1.3860 |R1: 1.3862 |R2: 1.3866 |R3: 1.3869

http://www.jimmyforextrader.com/analysis-daily/
 
The EUR/USD pair tried to fall apart during the session on Tuesday, but as you can see the 1.3750 level offered enough support to push the market higher, and move it back enough to form a hammer. This hammer suggests that the market is in fact going to go higher, and perhaps try to break above the 1.40 level again. While that is a bullish sign, we recognize that the area above should be resistive, and as a result it’s going to be difficult to break out to the upside from here. With that, we believe that staying flat in this market is probably the best route right now.

No Clear Signal S3: 1.3806 | S2: 1.3808 | S1: 1.3811 | PP: 1.3813 | R1: 1.3815 | R2: 1.3817 | R3: 1.3820

http://www.jimmyforextrader.com/analysis-daily/
 
EUR/USD Forecast March 27, 2014, Technical Analysis

The EUR/USD pair fell during the session on Wednesday, but remains within the consolidation area that we had been in previously. With this, we really don’t see much in this chart to get excited about, and therefore are on the sidelines. We also believe that the market will ultimately bounce around between the 1.37 level on the bottom, and the 1.3975 level on the top over the next several weeks. If we can break above the 1.40 level, we believe that is an extraordinarily bullish sign, and would be a longer-term buy-and-hold signal. On the other hand, if we managed to break down below the 1.37 level, we think at that point time the market could fall apart.

No Clear Signal - S3: 1.3780 |S2: 1.3781 |S1: 1.3782 |PP: 1.3783 |R1: 1.3785 |R2: 1.3786 |R3: 1.3787

http://www.jimmyforextrader.com/analysis-daily/
 
EUR/USD Forecast March 28, 2014, Technical Analysis

The 1.37 level continues to offer a little bit of a barrier in the EUR/USD pair, as was seen on Thursday. However, it appears that it’s only a matter of time before this market breaks down, but until we get that move, we are on the sidelines. We certainly don’t see any reason to start buying in this region, especially without the proper supportive candle. With that, we have a negative bias, but recognize that the market needs to make a move before we risk any of our trading capital on what has been an extraordinarily choppy market.

Buy - S3: 1.3745 |S2: 1.3747 |S1: 1.3748 |PP: 1.3749 |R1: 1.3750 |R2: 1.3752 |R3: 1.3753

http://www.jimmyforextrader.com/analysis-daily/
 
Top