• The Forex, Binary Options Forum - welcomes you to our Community!

    DigitalCashPalace Forum is dedicated to discussions about Forex, Binary Options, commodities, stocks related.

    Please take a look around, and feel free to .

Forex Technical Analysis & Forecast by RoboForex

Murrey Math Lines 09.04.2024 (AUDUSD, NZDUSD)

AUDUSD, "Australian Dollar vs US Dollar"

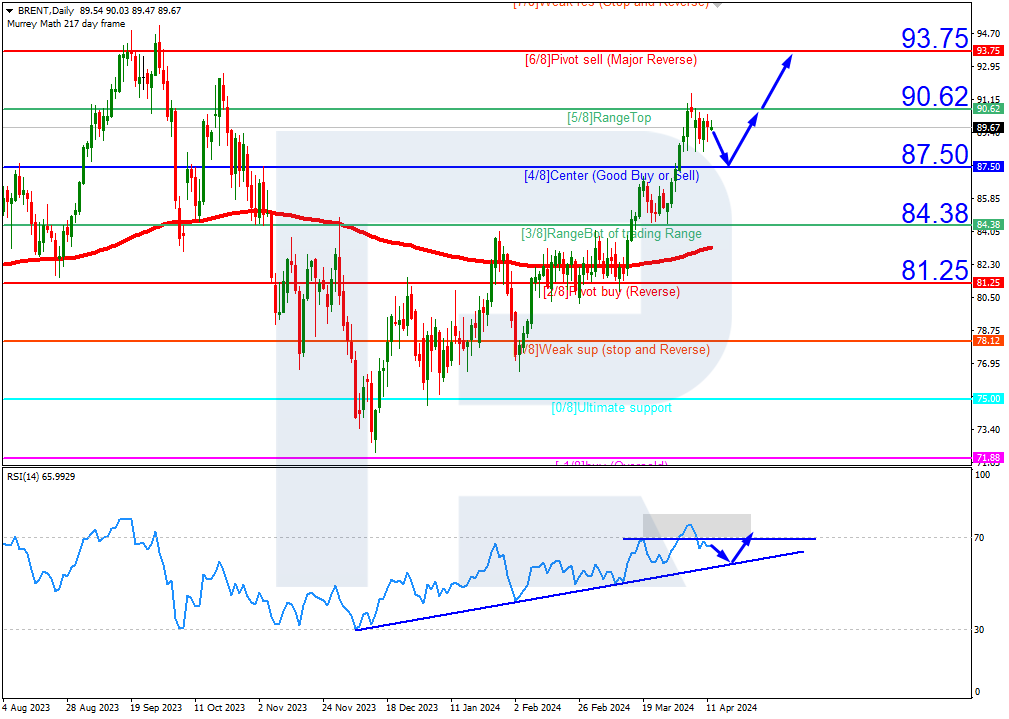
AUDUSD quotes have broken the 200-day Moving Average on D1 and rest above it, revealing the probability of an uptrend development. The RSI has broken the resistance line. In this situation, the quotes are expected to breach the 5/8 (0.6652) level and rise to the resistance at 6/8 (0.6713). The scenario could be cancelled by a breakout of 4/8 (0.6591). In this case, the price might drop to the support at 3/8 (0.6530).

1.png


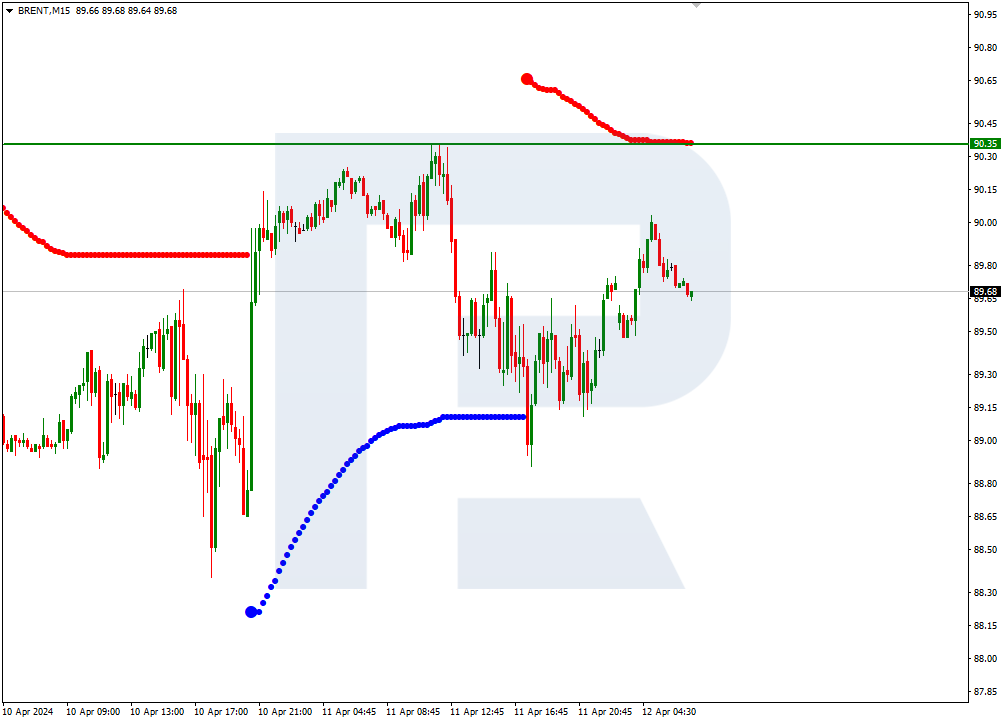
On M15, the upper boundary of the VoltyChannel is broken, increasing the probability of further price growth.

2.png


NZDUSD, "New Zealand Dollar vs US Dollar"
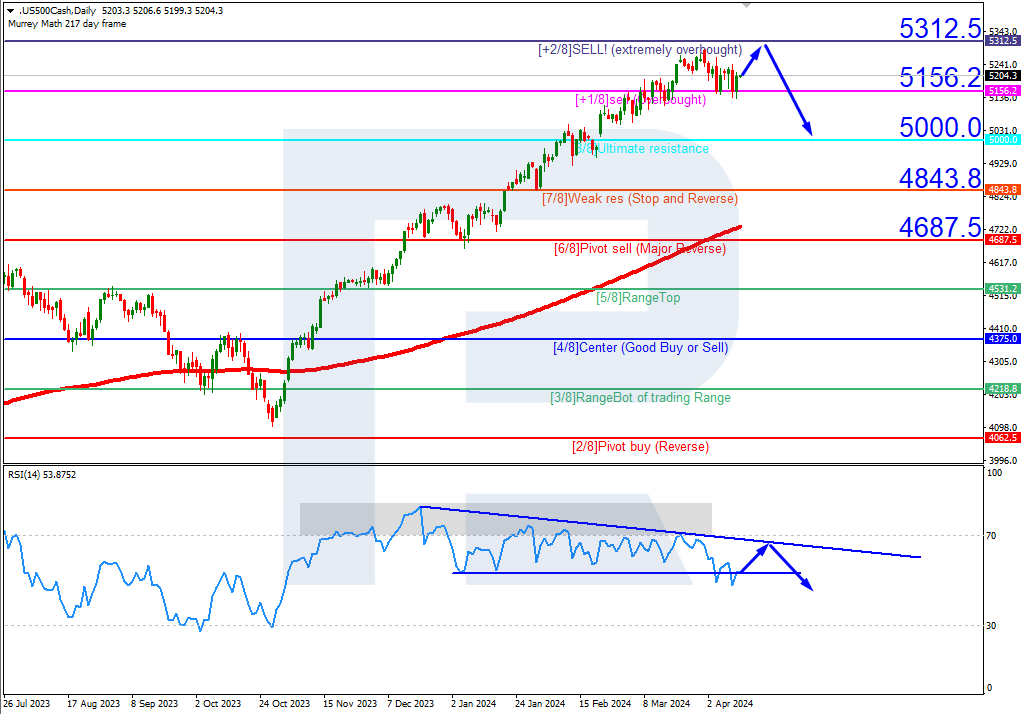
NZDUSD quotes are below the 200-day Moving Average on D1, which indicates the prevalence of a downtrend. The RSI is testing the resistance line. In these circumstances, a rebound from the 3/8 (0.6042) level is expected, followed by a decline to the support at 1/8 (0.5920). The scenario could be cancelled by rising above 3/8 (0.6042), in which case, the pair might rise to the resistance at 4/8 (0.6103).

3.png


Read more - Murrey Math Lines (AUDUSD, NZDUSD)

Attention!
Forecasts presented in this section only reflect the author’s private opinion and should not be considered as guidance for trading. RoboForex bears no responsibility for trading results based on trading recommendations described in these analytical reviews.

Sincerely,
The RoboForex Team
 
Ichimoku Cloud Analysis 10.04.2024 (EURUSD, XAUUSD, AUDUSD)

EURUSD, “Euro vs US Dollar”

EURUSD is rebounding from the signal lines of the indicator. The pair is going above the Ichimoku Cloud, which suggests an uptrend. A test of the Kijun-Sen line at 1.0835 is expected, followed by a rise to 1.0980. An additional signal confirming the rise will be a rebound from the lower boundary of the bullish channel. The scenario can be cancelled by a breakout of the lower boundary of the Cloud, with the price securing below 1.0745, indicating a further decline to 1.0655. Meanwhile, the rise could be confirmed by a breakout of the upper boundary of the bearish channel, with the price gaining a foothold above 1.0895.

1.png


XAUUSD, "Gold vs US Dollar"
Gold has established itself above the signal lines of the indicator. The instrument is going above the Ichimoku Cloud, which suggests an uptrend. A test of the upper boundary of the Cloud at 2340 is expected, followed by a rise to 2405. An additional signal confirming the rise will be a rebound from the lower boundary of the bullish channel. The scenario can be cancelled by a breakout of the lower boundary of the Cloud, with the price securing below 2305, which will signal a further decline to 2265.

2.png


AUDUSD, "Australian Dollar vs US Dollar"
AUDUSD is correcting following a rebound from the resistance level. The pair is going above the Ichimoku Cloud, which suggests an uptrend. A test of the Kijun-Sen line at 0.6605 is expected, followed by a rise to 0.6715. An additional signal confirming the rise will be a rebound from the lower boundary of the bullish channel. The scenario can be cancelled by a breakout of the lower boundary of the Cloud, with the price securing below 0.6495, which will indicate a further decline to 0.6405.

3.png


Read more - Ichimoku Cloud Analysis (EURUSD, XAUUSD, AUDUSD)

Attention!
Forecasts presented in this section only reflect the author’s private opinion and should not be considered as guidance for trading. RoboForex bears no responsibility for trading results based on trading recommendations described in these analytical reviews.

Sincerely,
The RoboForex Team
 
Ichimoku Cloud Analysis 11.04.2024 (GBPUSD, USDCAD, USDJPY)

GBPUSD, “Great Britain Pound vs US Dollar”

GBPUSD is rebounding from the support level. The instrument is going below the Ichimoku Cloud, which suggests a bearish trend. A test of the lower boundary of the Cloud at 1.2585 is expected, followed by a decline to 1.2395. An additional signal confirming the decline will be a rebound from the lower boundary of the bullish channel. The scenario can be cancelled by a breakout of the upper boundary of the Cloud with the price securing above 1.2675, which will mean further growth to 1.2765.

1.png


USDCAD, “US Dollar vs Canadian Dollar”
USDCAD has secured above the upper boundary of the bullish channel. The instrument is going above the Ichimoku Cloud, which suggests an uptrend. A test of the Tenkan-Sen line at 1.3635 is expected, followed by a rise to 1.3775. An additional signal confirming the rise will be a rebound from the lower boundary of the bullish channel. The scenario can be cancelled by a breakout of the lower boundary of the Cloud with the price securing under 1.3510, which will mean a further decline to 1.3415.

2.png


USDJPY, “US Dollar vs Japanese Yen”
USDJPY is testing the signal lines of the indicator. The instrument is going above the Ichimoku Cloud, which suggests an uptrend. A test of the Kijun-Sen line at 152.65 is expected, followed by a rise to 153.85. An additional signal confirming the rise will be a rebound from the lower boundary of the bullish channel. The scenario can be cancelled by a breakout of the lower boundary of the Cloud with the price securing under 151.25, which will mean a further decline to 150.35.

3.png


Read more - Ichimoku Cloud Analysis (GBPUSD, USDCAD, USDJPY)

Attention!
Forecasts presented in this section only reflect the author’s private opinion and should not be considered as guidance for trading. RoboForex bears no responsibility for trading results based on trading recommendations described in these analytical reviews.

Sincerely,
The RoboForex Team
 
Murrey Math Lines 12.04.2024 (Brent, S&P 500)

Brent

Brent quotes are above the 200-day Moving Average on D1, indicating a prevailing uptrend. The RSI has broken the support line, exiting the overbought area. As a result, in this situation, the price is expected to test the 4/8 (87.50) level, rebound from it, and rise to the resistance at 6/8 (93.75). The scenario could be cancelled by breaking below the 4/8 (87.50) level. In this case, Brent quotes could decline to the support at 3/8 (84.38).

1.png


On M15, following a rebound from the 4/8 (87.50) level on D1, the price rise could be additionally confirmed by a breakout of the upper line of the VoltyChannel.

2.png


S&P 500
S&P 500 quotes remain in the overbought area on D1. The RSI is testing the support line. In this situation, the price is expected to test the +2/8 (5312.5) level, rebound from it, and fall to the support at 8/8 (5000.00). The scenario could be cancelled by rising above +2/8 (5312.5), which might reshuffle the Murrey indication, setting new price movement targets.

3.png


Read more - Murrey Math Lines (Brent, S&P 500)

Attention!
Forecasts presented in this section only reflect the author’s private opinion and should not be considered as guidance for trading. RoboForex bears no responsibility for trading results based on trading recommendations described in these analytical reviews.

Sincerely,
The RoboForex Team
 
Murrey Math Lines 15.04.2024 (EURUSD, GBPUSD)

EURUSD, “Euro vs US Dollar”

EURUSD quotes are below the 200-day Moving Average on D1, revealing the prevalence of a downtrend. However, the RSI has reached the oversold area. In this situation, a rebound from the 3/8 (1.0620) level is expected, followed by a rise to the resistance at 4/8 (1.0772). This move is interpreted as a correction of the downtrend. The scenario could be cancelled by a breakout of the 3/8 (1.0620) level, in which case the pair might drop to the support at 2/8 (1.0498).

1.png


On M15, the price rise might be supported by a breakout of the upper boundary of the VoltyChannel.

2.png


GBPUSD, “Great Britain Pound vs US Dollar”
The GBPUSD pair stands below the 200-day Moving Average on D1, revealing the prevalence of a downtrend. The RSI has broken the support line. In this situation, a further decline to the nearest support at 1/8 (1.2329) might follow. The scenario could be cancelled by rising above 2/8 (1.2451), in which case the quotes might correct to the resistance at 3/8 (1.2573).

3.png


Read more - Murrey Math Lines (EURUSD, GBPUSD)

Attention!
Forecasts presented in this section only reflect the author’s private opinion and should not be considered as guidance for trading. RoboForex bears no responsibility for trading results based on trading recommendations described in these analytical reviews.

Sincerely,
The RoboForex Team
 
Murrey Math Lines 16.04.2024 (AUDUSD, NZDUSD)

AUDUSD, "Australian Dollar vs US Dollar"

AUDUSD quotes are below the 200-day Moving Average on D1, revealing the prevalence of a downtrend. The RSI has broken the support line. In this situation, a breakout of the 1/8 (0.6408) level is expected, followed by a price decline to the support at 0/8 (0.6437). The scenario might be cancelled by rising above 2/8 (0.6469), in which case the quotes could correct to the resistance at 3/8 (0.6530).

1.png


On M15, the lower boundary of the VoltyChannel is breached, which increases the probability of a further price decline.

2.png


NZDUSD, "New Zealand Dollar vs US Dollar"
NZDUSD quotes and the RSI are approaching their oversold areas on D1. In this situation, a test of 0/8 (0.5859) is expected, followed by a rebound from this level and a rise to the resistance at 2/8 (0.5981). In this case, the quotes might drop to the support at -1/8 (0.5798).

3.png


Read more - Murrey Math Lines (AUDUSD, NZDUSD)

Attention!
Forecasts presented in this section only reflect the author’s private opinion and should not be considered as guidance for trading. RoboForex bears no responsibility for trading results based on trading recommendations described in these analytical reviews.

Sincerely,
The RoboForex Team
 
Japanese Candlesticks Analysis 17.04.2024 (USDCAD, AUDUSD, USDCHF)

USDCAD, “US Dollar vs Canadian Dollar”

USDCAD has formed a Shooting Star reversal pattern on H4. Currently, the instrument might go by the reversal signal in a correction wave. The pullback target could be 1.3795. Next, the price might rebound from the support and continue its upward momentum. However, the quotes could rise to 1.3875 without testing the support level.

1.png


AUDUSD, “Australian Dollar vs US Dollar”
AUDUSD has formed a Hammer reversal pattern on H4. Currently, the instrument could go by the reversal signal in an ascending wave. The correction target might be 0.6440. After testing the resistance level, the quotes could rebound from it and maintain their downward trajectory. However, the price might fall to 0.6375 without a pullback.

2.png


USDCHF, “US Dollar vs Swiss Franc”
USDCHF has formed a Doji reversal pattern on H4. Currently, the instrument is going by the reversal signal in an ascending wave. The growth target could still be 0.9185. Upon testing the resistance level, the price might break above it and continue developing the uptrend. However, the quotes could pull back to 0.9075 before rising.

3.png


Read more - Japanese Candlesticks Analysis (USDCAD, AUDUSD, USDCHF)

Attention!
Forecasts presented in this section only reflect the author’s private opinion and should not be considered as guidance for trading. RoboForex bears no responsibility for trading results based on trading recommendations described in these analytical reviews.

Sincerely,
The RoboForex Team
 
Murrey Math Lines 18.04.2024 (USDCHF, XAUUSD)

USDCHF, “US Dollar vs Swiss Franc”

USDCHF quotes are above the 200-day Moving Average on D1, indicating the prevalence of an uptrend. However, a divergence has formed on the RSI. As a result, in this situation, a test of the 6/8 (0.9033) level is expected, followed by a breakout and a price decline to the support at 5/8 (0.8911). This decline could be interpreted as a correction of an uptrend. The scenario might be cancelled by a breakout of the resistance at 7/8 (0.9155). In this case, the pair could rise to the 8/8 (0.9277) level.

1.png


On M15, the lower boundary of the VoltyChannel is broken, which increases the probability of a further price decline.

2.png


XAUUSD, “Gold vs US Dollar”
Gold quotes are above the 200-day Moving Average on D1, indicating the prevalence of an uptrend. However, the RSI is in the overbought area. In this situation, a rebound from 3/8 (2375.00) is expected, followed by a price decline to the support at 2/8 (2250.00). This movement could be interpreted as a correction of an uptrend. The scenario might be cancelled by rising above 3/8 (2375.00), in which case, the quotes could grow to the resistance at 4/8 (2500.00).

3.png


Read more - Murrey Math Lines (USDCHF, XAUUSD)

Attention!
Forecasts presented in this section only reflect the author’s private opinion and should not be considered as guidance for trading. RoboForex bears no responsibility for trading results based on trading recommendations described in these analytical reviews.

Sincerely,
The RoboForex Team
 
Murrey Math Lines 19.04.2024 (Brent, S&P 500)

Brent

Brent quotes are above the 200-day Moving Average on D1, indicating the prevalence of an uptrend. The RSI has rebounded from the support line. As a result, in this situation, a test of 5/8 (90.62) is expected, followed by a breakout of this level and a price rise to the resistance at 6/8 (93.75). The scenario could be cancelled by a breakout of the 4/8 (87.50) level. In this case, the quotes could drop to the support at 3/8 (84.38).

1.png


On M15, the upper boundary of the VoltyChannel is broken, which increases the probability of a further price rise.

2.png


S&P 500
S&P 500 quotes are above the 200-day Moving Average on D1, indicating the prevalence of an uptrend. The RSI has reached the oversold area. In this situation, the quotes are expected to rise above 0/8 (5000.0), rising to the resistance level of +1/8 (5156.2) afterwards. The scenario could be cancelled by breaking the 7/8 (4843.8) level, in which case the price might continue declining and reach the support at 6/8 (4687.5).

3.png


Read more - Murrey Math Lines (Brent, S&P 500)

Attention!
Forecasts presented in this section only reflect the author’s private opinion and should not be considered as guidance for trading. RoboForex bears no responsibility for trading results based on trading recommendations described in these analytical reviews.

Sincerely,
The RoboForex Team
 
Murrey Math Lines 22.04.2024 (EURUSD, GBPUSD)

EURUSD, “Euro vs US Dollar”

EURUSD quotes are below the 200-day Moving Average on D1, indicating a prevailing downtrend. The RSI is approaching the resistance line. In this situation, the price is expected to test the 4/8 (1.0772) level, rebound from it, and decline to the support at 2/8 (1.0498). The scenario might be cancelled by a breakout of the 3/8 (1.0620) level. In this case, the pair could maintain its downward trajectory without corrective growth, falling to the support at 2/8 (1.0498).

1.png


On M15, following a rebound from the 4/8 (1.0772) level, the price decline could be additionally supported by a breakout of the lower line of the VoltyChannel.

2.png


GBPUSD, “Great Britain Pound vs US Dollar”
GBPUSD quotes are below the 200-day Moving Average on D1, which indicates a prevailing downtrend. However, the RSI has reached the oversold area. In this situation, the price is expected to surpass the 2/8 (1.2451) level and rise to the resistance at 3/8 (1.2573). The scenario could be cancelled by a breakout of the 1/8 (1.2329) level. In this case, the pair might decline to the support at 0/8 (1.2207).

3.png


Read more - Murrey Math Lines (EURUSD, GBPUSD)

Attention!
Forecasts presented in this section only reflect the author’s private opinion and should not be considered as guidance for trading. RoboForex bears no responsibility for trading results based on trading recommendations described in these analytical reviews.

Sincerely,
The RoboForex Team
 
Murrey Math Lines 23.04.2024 (AUDUSD, NZDUSD)

AUDUSD, "Australian Dollar vs US Dollar"

AUDUSD quotes are below the 200-day Moving Average on D1, indicating the prevalence of a downtrend. However, a convergence has formed on the RSI. As a result, in this situation, the quotes are expected to rise above 2/8 (0.6469), later reaching the resistance at 4/8 (0.6591). The scenario could be cancelled by a breakout of the 1/8 (0.6408) level. In this case, the price might return to the support at 0/8 (0.6347).

1.png


On M15, the upper boundary of the VoltyChannel is breached, which increases the probability of a further price rise.

2.png


NZDUSD, "New Zealand Dollar vs US Dollar"
NZDUSD quotes are below the 200-day Moving Average on D1, revealing the prevalence of a downtrend, while a convergence has formed on the RSI. In this situation, the quotes are expected to breach 1/8 (0.5920), subsequently rising towards the resistance at 4/8 (0.6103). The scenario could be cancelled by a breakout of the 0/8 (0.5859) level, in which case the quotes could drop to the support at -1/8 (0.5798).

3.png


Read more - Murrey Math Lines (AUDUSD, NZDUSD)

Attention!
Forecasts presented in this section only reflect the author’s private opinion and should not be considered as guidance for trading. RoboForex bears no responsibility for trading results based on trading recommendations described in these analytical reviews.

Sincerely,
The RoboForex Team
 
Murrey Math Lines 24.04.2024 (USDJPY, USDCAD)

USDJPY, “US Dollar vs Japanese Yen”

USDJPY quotes and the RSI remain in the overbought areas on D1. In this situation, the price is expected to test the +2/8 (156.25) level, rebound from it, and decline to the support at 0/8 (150.00). The scenario could be cancelled by surpassing the +2/8 (156.25) level, which might reshuffle the Murrey indication, setting new price movement targets.

1.png


On M15, following a rebound from the +2/8 (156.25) level on D1, the price decline could be additionally confirmed by a breakout of the lower line of the VoltyChannel.

2.png


USDCAD, “US Dollar vs Canadian Dollar”
USDCAD quotes have breached the 8/8 (1.3671) level and exited the overbought area on D1. The RSI has broken below the support line. In this situation, the price is expected to maintain its downward trajectory towards 6/8 (1.3427). The scenario could be cancelled by rising above the 8/8 (1.3671) level. In this case, the pair might resume growth, with the quotes returning to the +1/8 (1.3793) resistance level.

3.png


Read more - Murrey Math Lines (USDJPY, USDCAD)

Attention!
Forecasts presented in this section only reflect the author’s private opinion and should not be considered as guidance for trading. RoboForex bears no responsibility for trading results based on trading recommendations described in these analytical reviews.

Sincerely,
The RoboForex Team
 
Japanese Candlesticks Analysis 25.04.2024 (USDCAD, AUDUSD, USDCHF)

USDCAD, “US Dollar vs Canadian Dollar”

USDCAD has formed a Hammer reversal pattern on H4. Currently, the instrument is going by the reversal signal in an ascending wave. The growth target might be 1.3770. Next, the price could break the level and continue developing the uptrend. However, the quotes might correct towards 1.3660 before rising.

1.png


AUDUSD, “Australian Dollar vs US Dollar”
AUDUSD has formed a Harami reversal pattern on H4. Currently, the instrument is going by the reversal signal in a descending wave. The decline target might be 0.6475. Upon testing the support, the quotes could break the level and continue developing the downtrend. However, the quotes might rise to the 0.6560 level before the decline.

2.png


USDCHF, “US Dollar vs Swiss Franc”
USDCHF has formed a Harami reversal pattern on H4. Currently, the instrument might go by the reversal signal in a descending wave. The correction target might be 0.9100. After testing the support, the price could rebound from this level and continue developing the uptrend. However, the quotes might rise towards 0.9190 without correcting to the support.

3.png


Read more - Japanese Candlesticks Analysis (USDCAD, AUDUSD, USDCHF)

Attention!
Forecasts presented in this section only reflect the author’s private opinion and should not be considered as guidance for trading. RoboForex bears no responsibility for trading results based on trading recommendations described in these analytical reviews.

Sincerely,
The RoboForex Team
 
Murrey Math Lines 26.04.2024 (Brent, S&P 500)

Brent

Brent quotes are above the 200-day Moving Average on D1, which indicates the prevalence of an uptrend. The RSI has rebounded from the support line. In this situation, the quotes are expected to rise above 5/8 (90.62), after which they might reach the resistance at 6/8 (93.75). The scenario could be cancelled by breaching the 4/8 (87.50) level. In this case, Brent quotes could drop to the support at 3/8 (84.38).

1.png


On M15, the upper boundary of the VoltyChannel is broken, which increases the probability of a further price rise.

2.png


S&P 500
The S&P 500 quotes are in the overbought area, while the RSI is approaching the resistance line. In this situation, a test of +1/8 (5156.2) is expected, after which the quotes could rebound from this level and drop to the support at 7/8 (4843.8). The scenario might be cancelled by a breakout of the +1/8 (5156.2) level, in which case the S&P 500 quotes could rise to the resistance at +2/8 (5312.5).

3.png


Read more - Murrey Math Lines (Brent, S&P 500)

Attention!
Forecasts presented in this section only reflect the author’s private opinion and should not be considered as guidance for trading. RoboForex bears no responsibility for trading results based on trading recommendations described in these analytical reviews.

Sincerely,
The RoboForex Team
 
Top