FxGrow Fundamental Analysis – 14th March, 2017
By FxGrow Investment Research Desk
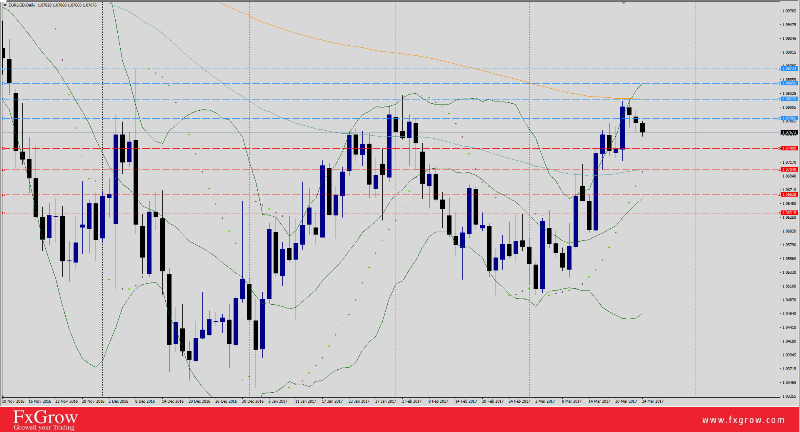
Sterling Diggs lower and US Dollar Inches Higher, Eyes on BOE Rates Decision
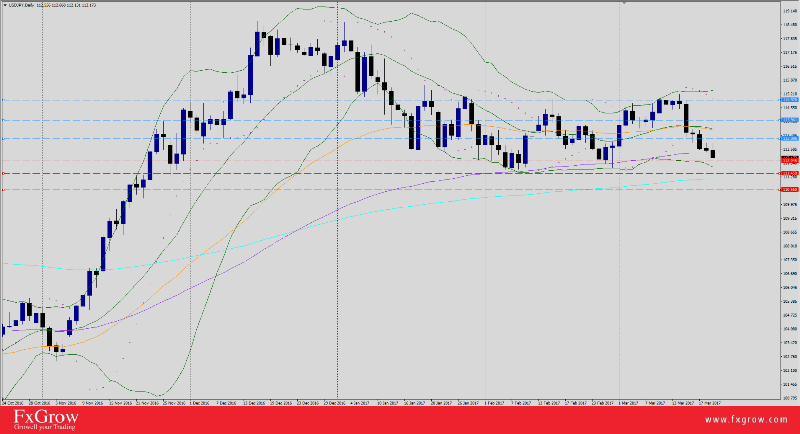
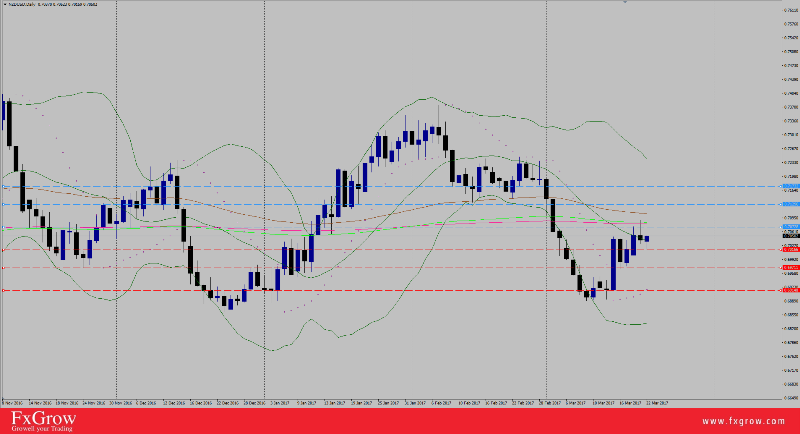
GBP/USD has extended the bearish momentum today for the 13 consecutive session and currently digging for a deeper hole other than today's 1.2109 low. Although a clear sky is waving ahead of Sterling given a green light by UK Parliament to PM May to release article 50 not longer than 31 March, another player ( US Dollar ) continues to pressure British Pound today with a 101.52 high and US Index is currently clawing for additional gains. on the other hand, other news is that PM May will reject the Scottish First Minister Sturgeon's demand for a second referendum in the next two years. This was coming from unidentified government sources and reported by The Times.
The main Focus for GBP now is what is coming, between US Fed and BOE interest rate decisions. Forecasts are highly that US Fed are moving along with additional 0.25% hike to current 0.57%, and Bank of England to lo leave interests at current 0.25% which will boost US Dollar, leaving Sterling vulnerable for strong US Index levels and GFP/USD will suffocate with additional declines.
Fundamentals :
1- GBP Average Earnings Index 3m/y tomorrow at 9:30 AM GMT.
2- GBP Unemployment Change tomorrow at 9:30 AM GMT.
3- BOE Interest Rates Decision on Thursday at 12:00 PM GMT.
4- US Fed Rate decision tomorrow at 6:00 PM GMT.
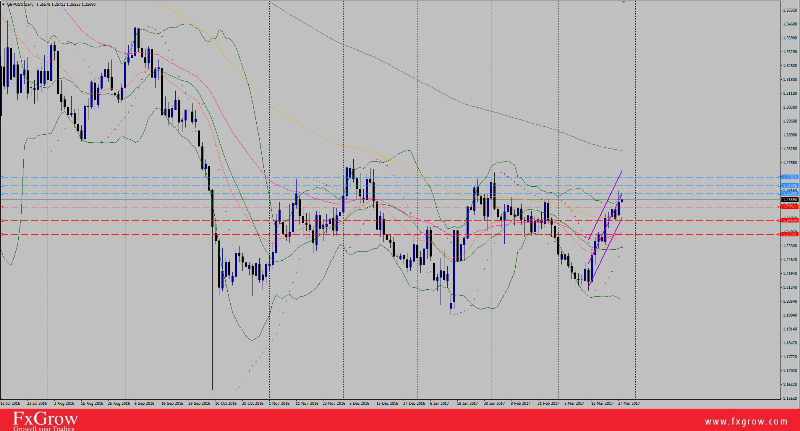
Technical:
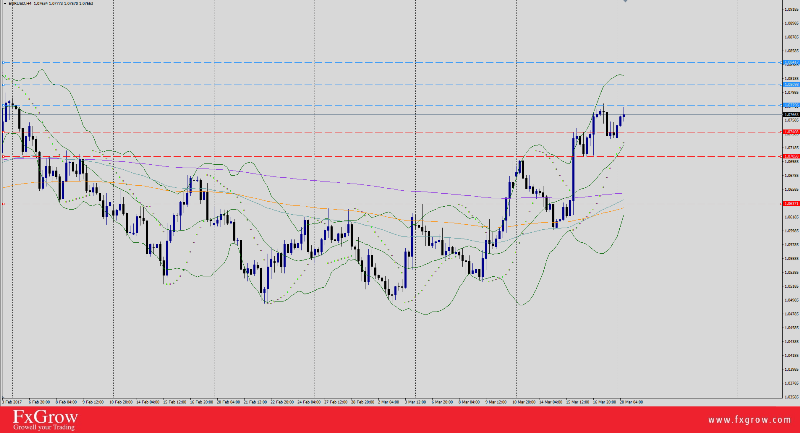
Trend : Bearish Sideways
Resistance levels : R1 1.2198, R2 1.2287, R3 1.2355 , R4 1.2436
Support levels : S1 1.2119 , S2 1.2052, S3 1.1984, S4 1.1906
Remark : Economic Calendar is colorful this week with UK and US Data, but the main focus is on BOE & US Fed Rate decisions. Keep an eye on US Index levels as its the main player in the market. A break below S2 level will increase further selloffs and wash towards S3&S4 levels. Closing above R2 level projects additional bullish waves and spark R3 level and closing above R4, the cable will shift to bullish trend.
For more in depth Research & Analysis please visit FxGrow.http://fxgrow.com/analysis-educatio...alysis-fxgrow-free-forex-analysis-tools#close
Note: This analysis is intended to provide general information and does not constitute the provision of INVESTMENT ADVICE. Investors should, before acting on this information, consider the appropriateness of this information having regard to their personal objectives, financial situation or needs. We recommend investors obtain investment advice specific to their situation before making any financial investment decision.
By FxGrow Investment Research Desk
Sterling Diggs lower and US Dollar Inches Higher, Eyes on BOE Rates Decision
GBP/USD has extended the bearish momentum today for the 13 consecutive session and currently digging for a deeper hole other than today's 1.2109 low. Although a clear sky is waving ahead of Sterling given a green light by UK Parliament to PM May to release article 50 not longer than 31 March, another player ( US Dollar ) continues to pressure British Pound today with a 101.52 high and US Index is currently clawing for additional gains. on the other hand, other news is that PM May will reject the Scottish First Minister Sturgeon's demand for a second referendum in the next two years. This was coming from unidentified government sources and reported by The Times.
The main Focus for GBP now is what is coming, between US Fed and BOE interest rate decisions. Forecasts are highly that US Fed are moving along with additional 0.25% hike to current 0.57%, and Bank of England to lo leave interests at current 0.25% which will boost US Dollar, leaving Sterling vulnerable for strong US Index levels and GFP/USD will suffocate with additional declines.
Fundamentals :
1- GBP Average Earnings Index 3m/y tomorrow at 9:30 AM GMT.
2- GBP Unemployment Change tomorrow at 9:30 AM GMT.
3- BOE Interest Rates Decision on Thursday at 12:00 PM GMT.
4- US Fed Rate decision tomorrow at 6:00 PM GMT.
Technical:
Trend : Bearish Sideways
Resistance levels : R1 1.2198, R2 1.2287, R3 1.2355 , R4 1.2436
Support levels : S1 1.2119 , S2 1.2052, S3 1.1984, S4 1.1906
Remark : Economic Calendar is colorful this week with UK and US Data, but the main focus is on BOE & US Fed Rate decisions. Keep an eye on US Index levels as its the main player in the market. A break below S2 level will increase further selloffs and wash towards S3&S4 levels. Closing above R2 level projects additional bullish waves and spark R3 level and closing above R4, the cable will shift to bullish trend.
For more in depth Research & Analysis please visit FxGrow.http://fxgrow.com/analysis-educatio...alysis-fxgrow-free-forex-analysis-tools#close
Note: This analysis is intended to provide general information and does not constitute the provision of INVESTMENT ADVICE. Investors should, before acting on this information, consider the appropriateness of this information having regard to their personal objectives, financial situation or needs. We recommend investors obtain investment advice specific to their situation before making any financial investment decision.