EUR/USD: short-term downward correction is likely
18/05/2017
Current dynamics
Aggravated in the US political uncertainty caused sales in global stock markets, especially American ones. Investors once again fear that the Trump administration will face difficulties in carrying out tax reform and budget incentives.
The dollar fell sharply in the foreign exchange market. The ICE dollar index, estimating its rate to the basket of six major currencies, fell by 0.4% to 97,685, being near the minimum mark since November 4. Yesterday was also associated with an increase in demand for asylum assets, such as the yen, gold, US government bonds. So, the yield of 10-year US Treasury bonds, according to Tradeweb, fell yesterday to 2.247% from 2.329%.
We are waiting for the data from the USA today. At 12:30 (GMT), the US Department of Labor will publish a weekly report on the number of new applications for unemployment benefits. The forecast: 240 000 (against 236 000 the previous week), which should negatively affect the dollar.
Also at the same time published an index of business activity in the manufacturing sector from the Federal Reserve Bank of Philadelphia in May. The result is higher than expected (19.5 against 22.0 in April) will strengthen the US dollar.
Support and resistance levels
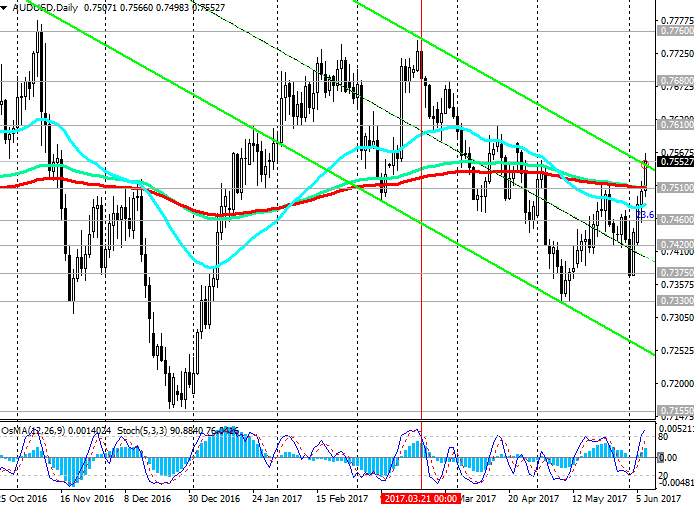
Despite today's decline, the positive dynamics of the pair EUR / USD persists. On a strong positive momentum, the EUR / USD pair broke the upper border of the rising channel on the daily chart near 1.1100. In case of resumption of growth and renewal of the local and annual maximum near the 1.1170 level, the targets will be levels 1.1280 (Fibonacci level 23.8% corrective growth from the minimums reached in February 2015 in the last wave of global decline of the pair from the level of 1.3900), 1.1340 (EMA144 on a weekly basis Chart).
In case the EUR / USD pair returns to the zone below the support level 1.1100 (the upper line of the rising channel on the daily chart), the fall in the EUR / USD pair may accelerate into the channel. Strong levels of support are also levels 1.1035, 1.1000, 1.0950. Breakdown of support levels 1.0820 (EMA200), 1.0780 (EMA144 on the daily chart) will cancel the uptrend.
Support levels: 1.1100, 1.1080, 1.1035, 1.1000, 1.0950, 1.0900, 1.0875, 1.0820, 1.0800, 1.0780
Resistance levels: 1.1156, 1.1170, 1.1200, 1.1280, 1.1340
Trading Scenarios
Sell Stop 1.1115. Stop-Loss 1.1175. Objectives 1.1100, 1.1080, 1.1035, 1.1000, 1.0950, 1.0900, 1.0875, 1.0820, 1.0800, 1.0780
Buy Stop 1.1175. Stop-Loss 1.1115. Objectives 1.1200, 1.1280. 1.1340

*) Actual and detailed analytics can be found on the Tifia website at tifia.com/analytics
18/05/2017
Current dynamics
Aggravated in the US political uncertainty caused sales in global stock markets, especially American ones. Investors once again fear that the Trump administration will face difficulties in carrying out tax reform and budget incentives.
The dollar fell sharply in the foreign exchange market. The ICE dollar index, estimating its rate to the basket of six major currencies, fell by 0.4% to 97,685, being near the minimum mark since November 4. Yesterday was also associated with an increase in demand for asylum assets, such as the yen, gold, US government bonds. So, the yield of 10-year US Treasury bonds, according to Tradeweb, fell yesterday to 2.247% from 2.329%.
We are waiting for the data from the USA today. At 12:30 (GMT), the US Department of Labor will publish a weekly report on the number of new applications for unemployment benefits. The forecast: 240 000 (against 236 000 the previous week), which should negatively affect the dollar.
Also at the same time published an index of business activity in the manufacturing sector from the Federal Reserve Bank of Philadelphia in May. The result is higher than expected (19.5 against 22.0 in April) will strengthen the US dollar.
Support and resistance levels
Despite today's decline, the positive dynamics of the pair EUR / USD persists. On a strong positive momentum, the EUR / USD pair broke the upper border of the rising channel on the daily chart near 1.1100. In case of resumption of growth and renewal of the local and annual maximum near the 1.1170 level, the targets will be levels 1.1280 (Fibonacci level 23.8% corrective growth from the minimums reached in February 2015 in the last wave of global decline of the pair from the level of 1.3900), 1.1340 (EMA144 on a weekly basis Chart).
In case the EUR / USD pair returns to the zone below the support level 1.1100 (the upper line of the rising channel on the daily chart), the fall in the EUR / USD pair may accelerate into the channel. Strong levels of support are also levels 1.1035, 1.1000, 1.0950. Breakdown of support levels 1.0820 (EMA200), 1.0780 (EMA144 on the daily chart) will cancel the uptrend.
Support levels: 1.1100, 1.1080, 1.1035, 1.1000, 1.0950, 1.0900, 1.0875, 1.0820, 1.0800, 1.0780
Resistance levels: 1.1156, 1.1170, 1.1200, 1.1280, 1.1340
Trading Scenarios
Sell Stop 1.1115. Stop-Loss 1.1175. Objectives 1.1100, 1.1080, 1.1035, 1.1000, 1.0950, 1.0900, 1.0875, 1.0820, 1.0800, 1.0780
Buy Stop 1.1175. Stop-Loss 1.1115. Objectives 1.1200, 1.1280. 1.1340
*) Actual and detailed analytics can be found on the Tifia website at tifia.com/analytics