• The Forex, Binary Options Forum - welcomes you to our Community!

    DigitalCashPalace Forum is dedicated to discussions about Forex, Binary Options, commodities, stocks related.

    Please take a look around, and feel free to .

XAU/USD: Current dynamics and recommendations

07/25/2019


In anticipation of easing monetary policy by the world's largest central banks, global stock indices are rising. Gold quotes are also rising. In addition to expectations of easing monetary policy, primarily from the Fed, the rise in gold prices is stimulated by the preservation of geopolitical tensions and the risks of a slowdown in the global economy against the backdrop of international trade conflicts.

Today, the ECB meeting is in the center of attention of traders. The ECB rate decision will be published at 11:45 (GMT), and the ECB press conference will begin at 12:30. It is widely expected that the ECB will keep its monetary policy unchanged today. More interest to traders will be the press conference. It is highly likely that the head of the bank, Mario Draghi, announces a reduction in the ECB interest rate in September and, possibly, in November, as well as a restart of the quantitative easing program in the amount of 2.6 trillion euros in December.

During this period of time (11:45 - 12:30 GMT) a sharp increase in volatility is expected in the entire financial market, including in gold quotes.

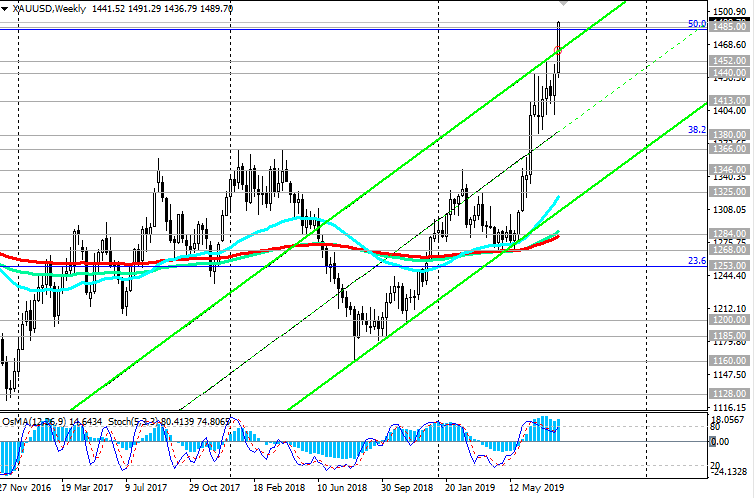
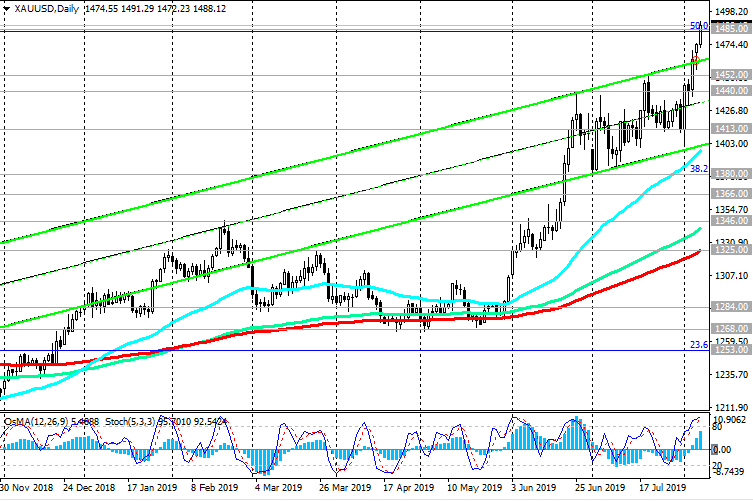
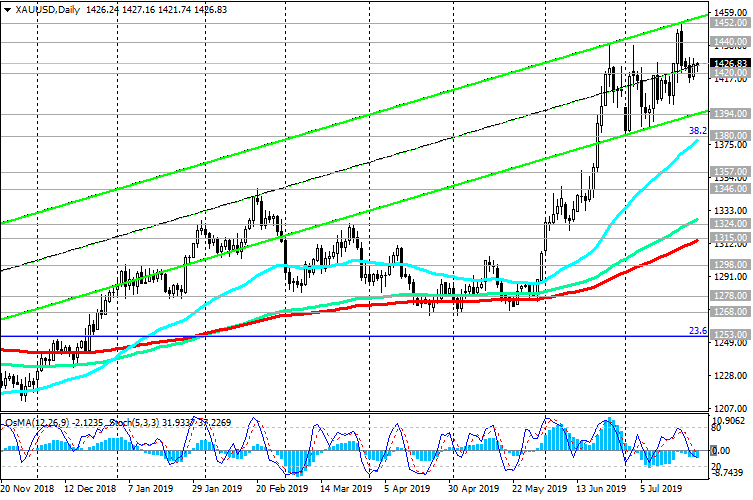
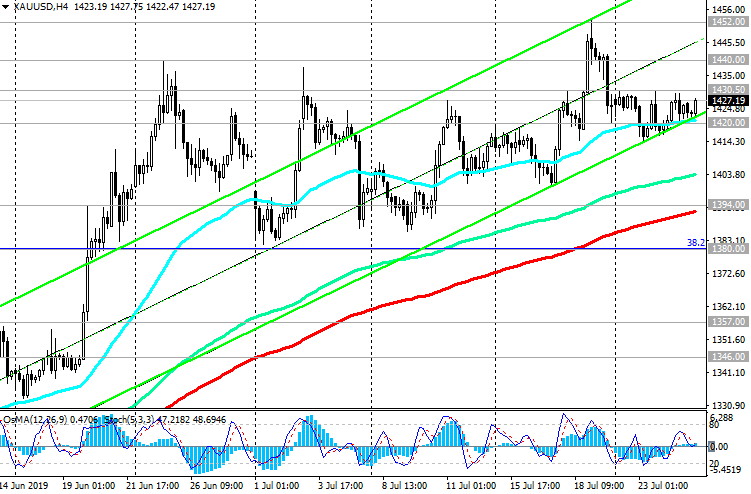
Last week, the XAU / USD pair reached a new 6-year high near the mark of 1452.00.

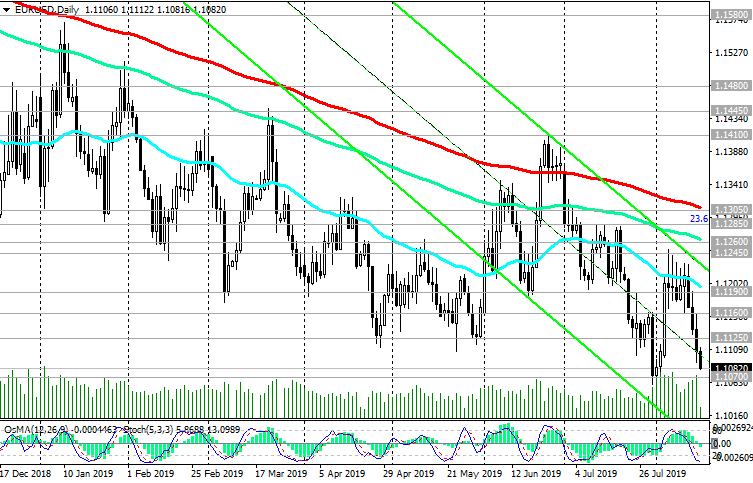
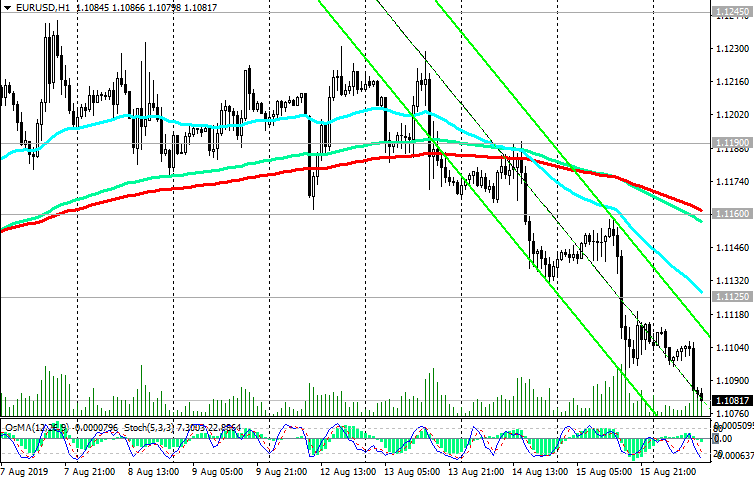
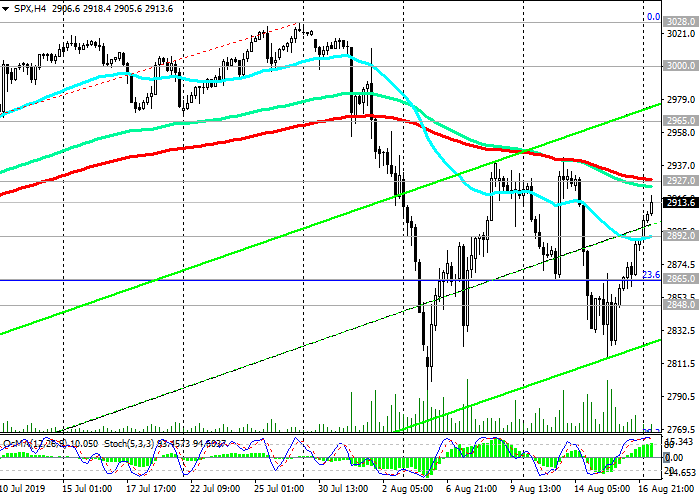
The signal for short-term sales will be the breakdown of the support level of 1420.00 (EMA200 on the 1-hour chart) with the target at the support levels of 1394.00 (EMA200 on the 4-hour chart), 1380.00 (Fibonacci level 38.2%). Despite a slight decrease in quotations (to the current mark of 1426.00), the bullish trend of gold remains.

Above support levels 1394.00, 1380.00 long positions are preferable. A signal for purchases will be the breakdown of local resistance levels of 1440.00, 1452.00. The breakdown of the resistance level of 1485.00 (Fibonacci 50% of the correction to the wave of decline since September 2011 and the mark of 1920.00) will confirm the completion of the corrective decline and the resumption of price growth.

Support Levels: 1420.00, 1394.00, 1380.00, 1357.00, 1346.00, 1324.00, 1315.00, 1298.00, 1278.00, 1268.00, 1253.00

Resistance Levels: 1440.00, 1452.00, 1485.00


Trading recommendations


Sell Stop 1413.00. Stop-Loss 1431.00. Take-Profit 1394.00, 1380.00

Buy Stop 1431.00. Stop Loss 1413.00. Take-Profit 1440.00, 1452.00, 1485.00

250719-XU-D.png


250719-XU-H4.png


*) For up-to-date and detailed analytics and news on the forex market visit Tifia Forex Broker website tifia.com
 
EUR/USD: US GDP exceeded forecast

07/26/2019

Current Dynamics


GDP growth is "not bad, considering" the Fed's interest rate policy. That is how American President Donald Trump reacted to the publication on Friday of data on US GDP for the 2nd quarter, which exceeded market expectations.

The Commerce Department reported on Friday (12:30 GMT) a 2.1% increase in gross domestic product in the 2nd quarter. Economists had expected GDP growth of 1.8%.

Trump again lashed out at the Fed after the publication of GDP data, calling the US central bank "a burden hanging on our neck".

Increased consumer spending leveled the fall in investment by American companies. Consumer spending, which accounts for more than two-thirds of the US economy, in the 2nd quarter, adjusted for inflation, rose by 4.3% per annum, which is a maximum since the end of 2017, after rising by 1.1% per annum in the previous quarter.

Government spending also spurred GDP growth, adding 5.0% per annum.

The general inflation indicator also rose. The price index for personal consumption expenditure (PCE) in the 2nd quarter rose 2.3% after rising 0.4% in the 1st quarter. The base PCE index, which does not take into account the prices of food and energy, rose by 1.8%.

Thus, the ten-year period of economic growth in the United States continued, despite foreign trade tensions and a slowdown in the global economy.

The Commerce Department’s report released Friday showed little impact on expectations that the Federal Reserve would lower its key interest rate by 0.25% at a meeting July 30 - 31.

However, the dollar rose strongly on Friday. His positive dynamics were also spurred by statements by Lawrence Kudlow, director of the White House National Economic Council, who said that the United States would not intervene in the markets in order to lower the rate of its currency.

At the same time, the euro continued to decline against the dollar after the European Central Bank on Thursday signaled its willingness to lower short-term interest rates and restart its large-scale bond purchase program. The current interest rate of the ECB from 2016 is at the level of 0%, and the deposit rate at the level of -0.4%. In a related statement, the ECB expressed concern about the weakening European economy and global negative factors, such as international trade conflicts and Brexit.

The next meeting of the ECB is scheduled for September 12, and it is likely that a whole package of measures will be adopted at this meeting, including a reduction in the interest rate of 0.25% and a restart of the quantitative easing program in the amount of 2.6 trillion euros.


At the time of this writing, the EUR / USD pair was trading near the 1.1120 mark, 25 points lower than the opening price of the trading day on Friday. The negative dynamics of EUR / USD persists after the pair reached a new annual minimum on Thursday near the 1.1100 mark.

In the current situation, short positions look relevant and safer.

Below resistance levels of 1.1335 (EMA200 on the daily chart), 1.1290 (EMA144 on the daily chart), 1.1285 (Fibonacci 23.6% of the correction to the fall from the level of 1.3900, which began in May 2014), long-term negative dynamics remain.

An upward correction is also possible, but so far no higher than the short-term resistance level of 1.1233 (EMA200 on the 4-hour chart). There are no prerequisites for more confident growth of EUR / USD.

Support Levels: 1.1100, 1.1030

Resistance Levels: 1.1187, 1.1233, 1.1285, 1.1290, 1.1335, 1.1410, 1.1445


Trading Recommendations


Sell in the market. Stop Loss 1.1160. Take-Profit 1.1100, 1.1030

Buy Stop 1.1160. Stop Loss 1.1100. Take-Profit 1.1187, 1.1233, 1.1285, 1.1290, 1.1335

260719-EU-D.png


260719-EU-H4.png


*) For up-to-date and detailed analytics and news on the forex market visit Tifia Forex Broker website tifia.com
 
S&P500: Current dynamics before the Fed meeting

07/29/2019


Expectations of easing of the monetary policy of the Fed and positive macro statistics coming from the United States are pushing major US stock indexes to new heights.

Last week, the S&P500 index updated its record high near the 3028.0 mark after the US Department of Commerce released a report, according to which GDP grew in the 2nd by +2.1% (annualized) after +3.1% in the 1st quarter, with a forecast of +2.0%. At the same time, consumer spending, which accounts for more than two-thirds of the US economy, in the 2nd quarter grew at the highest rate since the end of 2017, reaching +4.3%.

Trump again lashed out at the Fed after the publication of GDP data, calling the US central bank "a burden hanging on our neck", although GDP growth, in his opinion, was "not bad, given" the Fed's policy.

At the same time, the GDP report did not affect expectations that the Federal Reserve will lower its key interest rate by 0.25 percentage points at the meeting July 30 - 31, given the continuing risks of a downturn in the global economy and the need to achieve the target inflation rate.

Interest for investors will be the accompanying statements by the Fed leadership and a press conference following a meeting of the central bank. If Jerome Powell signals a propensity to lower the rate in September or before the end of the year, in this case, US stock indexes will accelerate their growth.

Since the opening of today's trading day, the S&P500 is trading in a narrow range near the 3020.0 mark.

Above support levels 2840.0 (EMA200 on the daily chart), 2865.0 (Fibonacci level 23.6% of the correction to the growth since December 2018 and 2335.0 mark), the bullish trend of the S&P500 remains.

The signal for sales and the start of a downward correction will be the breakdown of the short-term support level of 3004.0 (EMA200 on the 1-hour chart) with targets at the support levels of 2965.0 (EMA200 on the 4-hour chart and highs of May), 2937.0 (2018 highs).

So far, long positions are preferred. However, it is also likely that the S&P500 will remain in the current range until the end of the Wednesday when the Fed’s decision and plans are known.

Support Levels: 3004.0, 2965.0, 2937.0, 2865.0, 2840.0, 2765.0

Resistance Levels: 3028.0


Trading Recommendations


Sell Stop 2990.0. Stop-Loss 3030.0. Targets 2965.0, 2937.0

Buy Stop 3030.0. Stop Loss 2990.0. Targets 3050.0, 3100.0, 3200.0

290719-S500-D.png


290719-S500-H1.png


*) For up-to-date and detailed analytics and news on the forex market visit Tifia Forex Broker website tifia.com
 
GBP/USD: the fall of the pound has intensified

30/07/2019


The pair GBP / USD resumed falling amid risks for the British economy due to the increased likelihood of a “tough” Brexit.

Boris Johnson, who succeeded Theresa May as prime minister, said earlier that he was ready for a tough Brexit. On October 31, the UK should finally withdraw from the EU, even if no agreement is reached between the parties.

"The exit agreement is dead and should be canceled, but there is a possibility of a new deal", Johnson said on Monday during his visit to Scotland. His press secretary announced the Prime Minister’s decision to refuse to meet with EU leaders, unless they change their position. "The UK will withdraw from the EU on October 31, anyway", she said.

The pound fell 1.3% against the US dollar on Monday and also traded at the lowest level against the euro since September 2017. On Tuesday, the decline in the pound continues.

In the current situation, only short positions should be considered for the GBP / USD pair. Mostly long-term negative dynamics. The immediate goal of the decline is the support level of 1.2000 (2017 lows and the Fibonacci 0% level of the correction to the decline of the GBP / USD pair in the wave that started in July 2014 near the level of 1.7200).

Consideration of long positions can only be returned after the pair grows to a zone above resistance levels of 1.2480 (November 2018 lows), 1.2530 (EMA200 on 4-hour chart) with targets at resistance levels of 1.2775, 1.2840 (upper line of the ascending channel and EMA200 on the daily chart). However, this is an unlikely scenario.

On Thursday at 11:00 (GMT) the decision of the Bank of England on the rate will be published, and at 11:30 the speech of the head of the Bank of England Mark Carney will begin. The risks of a “tough” Brexit and the likelihood of a deteriorating economic situation in the country have a negative impact on the Bank of England, which is aimed at easing policies. Although, most likely, the bank will refrain so far from any changes.

Support Levels: 1.2110, 1.2000

Resistance Levels: 1.2400, 1.2480, 1.2530, 1.2670, 1.2700, 1.2775, 1.2840


Trading Recommendations


Sell in the market. Stop Loss 1.2230. Take-Profit 1.2110, 1.2000

Buy Stop 1.2230. Stop Loss 1.2150. Take-Profit 1.2400, 1.2480, 1.2530, 1.2670, 1.2700

300719-GU-D.png


300719-GU-H4.png


*) For up-to-date and detailed analytics and news on the forex market visit Tifia Forex Broker website tifia.com
 
NZD/USD: the dynamics of the pair depends mainly on the Fed and the US dollar

07/31/2019


In mid-July, the NZD / USD pair broke through the key resistance level of 0.6710 (EMA200 on the daily chart) and continued to rise against the background of the weakening US dollar. Growth stopped at 0.6790, almost a 4-month high.

The upper line of the ascending channel on the daily chart also passes through this mark. There was a rebound from it into the channel and to its lower boundary, passing near the level of 0.6610, where NZD / USD is now trading.

Investors are waiting for the outcome of the two-day Fed meeting, which will end on Wednesday with the publication (at 18:00 GMT) of an interest rate decision. Probably, the Fed will reduce the interest rate by 25 basis points (to 2.25%). However, the markets have already taken into account in the quotations the reduction of the rate by 0.25%, and if the Fed does not give a strong signal about the further easing of its monetary policy, the dollar decline may have a short-term character.

Steadily weak inflation is the main and, perhaps, so far the only negative domestic economic factor that can affect the Fed’s decision to lower the rate more strongly. Among other negative factors are the uncertainty in US trade relations with China and the risks of a slowdown in the global economy.

At 18:30 (GMT), a press conference on the results of the Fed meeting will begin. Signals from Fed Chairman Jerome Powell, aimed at the likelihood of further easing of monetary policy, will cause the dollar to fall. Otherwise, after a short-term decline, the dollar is likely to resume growth, and the NZD / USD pair will decline.

In this case, the decline in NZD / USD is likely to resume after a small short-term correction.

After the breakdown of the local support level of 0.6585, NZD / USD will head towards the annual minimum near the 0.6490 mark. More distant targets of decline are located at support levels of 0.6430 (2018 lows), 0.6260 (Fibonacci 0% level and minima of the global decline pair from 0.8820).

The signal for the resumption of long positions will be the breakdown of the short-term resistance level of 0.6659 (EMA200 on the 1-hour and 4-hour charts) with targets at the resistance levels of 0.6680 (EMA144), 0.6710 (EMA200 and the middle of the rising channel on the daily chart). Further growth of NZD / USD is unlikely, and short positions are preferred below the local support level of 0.6610.

Support Levels: 0.6610, 0.6585, 0.6560, 0.6490, 0.6430, 0.6400, 0.6300, 0.6260

Resistance Levels: 0.6659, 0.6680, 0.6710, 0.6790, 0.6865, 0.6910


Trading Recommendations


Sell Stop 0.6580. Stop Loss 0.6635. Take-Profit 0.6560, 0.6490, 0.6430, 0.6400, 0.6300, 0.6260

Buy Stop 0.6635. Stop Loss 0.6580. Take-Profit 0.6659, 0.6680, 0.6710

310719-NU-D.png


310719-NU-H4.png


*) For up-to-date and detailed analytics and news on the forex market visit Tifia Forex Broker website tifia.com
 
EUR/USD: Eurodollar is likely to continue to decline

08/01/2019


The dollar rose sharply, and the Eurodollar fell last Wednesday after the Fed’s decision regarding monetary policy became known. Fed cuts interest rate by 25 bp up to 2.25%. In general, such a decision was expected by market participants, although some of them counted on a 50 bp cut in interest rates.

The Fed decided to lower the rate by 0.25% to protect the economy from the effects of the global slowdown and the escalation of trade tension. According to the Fed, "uncertainty about the prospects remains". At the same time, there was no clear signal from the Fed about a further rate cut, which caused disappointment among dollar sellers. At a subsequent press conference, Fed Chairman Jerome Powell also refrained from statements aimed at further easing the Fed's policies.

According to the CME Group and according to the quotes of futures on Fed rates, market participants on Tuesday estimated at 87% the probability of another rate cut at the end of 2019, but now they believe that the probability of such a development is only 60%. As for the cycle of lowering rates, "at present we do not expect this", Powell said.

The dollar went on the offensive, and the EUR / USD pair continued to decline during the Asian session on Thursday. At the beginning of the European session, the EUR / USD pair reached a new annual low near 1.1030 (the lower line of the downward channel on the weekly chart) amid expectations of further easing of the ECB's monetary policy.

In the current situation, short positions in EUR / USD are preferable. Below the key resistance levels 1.1320 (EMA200 on the daily chart), 1.1285 (EMA144 on the daily chart and the Fibonacci level 23.6% of the correction to the fall from the level of 1.3900, which began in May 2014), long-term negative dynamics prevail.

You can return to purchases only after the breakdown of the short-term resistance level of 1.1145 (EMA200 on the 1-hour chart), which will mean the beginning of an upward correction with a target near the resistance level 1.1210 (EMA50 on the daily chart and EMA200 on the 4-hour chart).

There are no prerequisites for a more confident growth of EUR / USD. At the same time, long-term reduction targets are located near 2015 and 2017 lows and marks 1.0600, 1.0500. After the breakdown of the support level of 1.1030, the immediate goal will be the support level of 1.0900.

Support Levels: 1.1030, 1.1000, 1.0900, 1.0500

Resistance Levels: 1.1145, 1.1180, 1.1210, 1.1285, 1.1320


Trading Recommendations


Sell in the market. Stop-Loss 1.1080. Take-Profit 1.1000, 1.0900

Buy Stop 1.1080. Stop-Loss 1.1020. Take-Profit 1.1145, 1.1180, 1.1210

010819-EU-H4.png


010819-EU-W.png


010819-EU-D.png


*) For up-to-date and detailed analytics and news on the forex market visit Tifia Forex Broker website tifia.com
 
WTI: new Trump statements brought the oil market down

08/02/2019


On Thursday afternoon, global stock indices and oil prices collapsed after Trump announced on Twitter that he would introduce new duties on Chinese imports from next month. The unexpected and sharp aggravation of foreign trade tension was a shock for investors.

The yield on 10-year US government bonds fell to 1.894%, the lowest level since November 8, 2016.

After Trump's announcement of the introduction of new duties on Chinese goods, the DXY dollar index collapsed, and traders again raised rates on further easing the Fed's policies.

The DXY Dollar Index Futures is trading Friday at the start of the European session near 98.00, 36 pips below its opening price on Thursday.

Amid the aggravated trade conflict between the United States and China, the price of oil fell sharply (about 8%). This was the most significant fall since February 2015. Aggravation of the trade conflict increases uncertainty, which contributes to the fall of risky assets and commodity prices.

On Friday, investors will focus on the July report on US employment, which will be published at 12:30 (GMT).

The US labor market remains a strong fundamental factor supporting a positive assessment of the state of the US economy. Economists predict that the report will show an increase in the number of new jobs outside the US agriculture by 165,000 with an unemployment rate of 3.6% - 3.7%.

This report is very important because (along with data on GDP and inflation indicators) it directly affects the Fed's decisions regarding interest rates.

If the Fed in making decisions in the future will rely not only on the situation in the global financial market and on the aggravating world trade relations, but also on the incoming economic data, then with the deterioration of macroeconomic indicators, further mitigation of its monetary policy cannot be avoided.

And this is a negative factor for the dollar, and a positive one - for commodity prices, including oil.

Also, on Friday, oil market participants will follow the publication (at 17:00 GMT) of the weekly report of the American oilfield services company Baker Hughes on the number of active drilling rigs in the United States. Previous reports showed a decrease in the number of active oil platforms in the United States, to 776 units at the moment, from 784 units 2 weeks ago. If the report again indicates a decrease in the number of such installations, then this may give a short-term positive impetus to prices.

However, at the moment, the oil market is subject to pressure from the intensification of international trade conflicts, primarily between the United States and China.

Any strong news on this subject may again cause a surge in volatility in oil quotes.

From a technical point of view, below the levels of 56.80 (EMA200 on the weekly chart), 58.50 (EMA200 on the daily chart) dollars per barrel of WTI crude oil, short positions are preferred.

Support Levels: 54.10, 53.25, 50.30, 49.00, 42.15

Resistance Levels: 55.40, 56.80, 58.00, 58.50, 59.50, 60.90, 63.50, 64.40, 66.50


Trading Recommendations


Sell Stop 53.90. Stop-Loss 55.60. Take-Profit 53.25, 50.30, 49.00, 42.15

Buy Stop 55.60. Stop-Loss 53.90. Take-Profit 56.80, 58.00, 58.50, 59.50, 60.90, 63.50, 64.40, 66.50

020819-WTI-D.png


020819-WTI-W.png


*) For up-to-date and detailed analytics and news on the forex market visit Tifia Forex Broker website tifia.com
 
DJIA: Current Dynamics

08/05/2019


Against the background of expectations of easing the Fed's monetary policy, the US stock index DJIA updated last month the absolute and annual maximum near the level of 27400.0.

Last week, the Fed lowered the rate by 0.25%. Many investors expected a rate cut by 0.50%, so the market reaction was restrained to this news.

Although the indices have maintained their positive dynamics.

However, stock indices, including the DJIA, crashed late last week after Trump tweeted that the United States introduced a new 10% duty on Chinese goods from September 1.

Last week was the worst for US stock markets in a few months.

S&P 500 on Friday fell by 0.7% to 2932.05 points. Dow Jones Industrial Average lost 0.4%, falling to 26485.01 points. Over the entire week, the S&P 500 fell 3.1% - this is its worst weekly dynamics since December. DJIA for the whole week fell by 2.6% and recorded the strongest weekly decline since May. The Nasdaq Composite fell 1.3% on Friday to 8004.07 points, and lost 3.9% over the entire week.

On Monday, the fall of world and US stock indices continues.

Hong Kong's Hang Seng index fell 2.9% to 26151.32 points on Monday in Japan, while the Japanese Nikkei Stock Average fell 1.7% to 20720.29 points on the back of the yen rising to a 7-month high.

Futures on the S&P500 index are trading at the beginning of the European session on Monday near 2888.0, 40 pips (or 1.3%) below the opening price of today's trading day.

Futures on the DJIA index are trading at the beginning of the European session near the mark of 26100.0, 370 points (or 1.4%) below the opening price of today's trading day, near the support level of 26100.0 (EMA144 on the daily chart).

In case of breakdown of the support level 25900.0 (EMA200 on the daily chart), the following objectives will be the support level 25300.0 (the bottom line of the ascending channel on the daily and weekly charts) and the important support level 24630.0 (Fibonacci level 23.6% of the correction to the DJIA growth wave that began in February 2016 from the mark of 15500.0).

Nevertheless, despite the current decline, there is the long-term positive dynamics of the American stock indices and the DJIA index, including.

A return to the zone above the resistance levels of 26700.0 (EMA50 on the daily chart and maximums of April 2019), 26830.0 (EMA200 on the 4-hour chart) will indicate a restoration of the bull trend and the resumption of purchases.

In the meantime, you should refrain from shopping.

Support Levels: 26100.0, 25900.0, 25300.0, 24630.0

Resistance Levels: 26700.0, 26830.0, 27000.0, 27400.0


Trading Scenarios


Buy Stop 26850.0. Stop-Loss 25980.0. Take-Profit 27000.0, 27400.0, 27500.0

Sell Stop 25980.0. Stop-Loss 26850.0. Take-Profit 25900.0, 25300.0, 24630.0

050819-DJIA-W.png


050819-DJIA-D.png


050819-DJIA-H4.png


*) For up-to-date and detailed analytics and news on the forex market visit Tifia Forex Broker website tifia.com
 
NZD/USD: amid escalation of international trade conflicts

08/06/2019


On Wednesday, the next meeting of the RBNZ will be held, devoted to issues of monetary policy. The publication of the decision on rates is scheduled for 02:00, and the press conference of the RBNZ following the meeting will begin at 03:00 (GMT). The RBNZ recently revised economic forecasts downward, and probably the bank will signal a further easing of monetary policy.

Many economists are inclined to believe that the RBNZ can lower the interest rate at least twice before the end of the year.

The slowdown in the global economy and the increase in import duties negatively impact the export-oriented New Zealand commodity economy.

Last Thursday, US President Donald Trump announced his readiness to introduce an additional 10% duty on Chinese goods from September 1. Shortly afterwards, when the yuan / US dollar broke through level 7, the People’s Bank of China said its currency weakened under the influence of "protectionist measures and the expectation of the introduction of additional duties against China" from the United States.

The erupting trade conflict between New Zealand's two largest trading partners - China and the United States, as well as the risks of a slowdown in the global economy puts pressure on the RB of New Zealand to further mitigate monetary policy.

And this is a strong negative factor for NZD.

Currently, NZD / USD is trading near 0.6545, having slightly adjusted against the backdrop of positive news from the New Zealand labor market, published at the beginning of the Asian session on Tuesday.

The tendency of the RBNZ to further lower the rate will cause a further weakening of the NZD and a drop in the pair of NZD / USD.

In this case, a breakdown of the local support level of 0.6490 (lows in May, June, August) will provoke a further decrease in NZD / USD with targets at support levels of 0.6430 (lows of 2018), 0.6260 (Fibonacci level of 0% and lows of the global pair decline wave from 0.8820) .

Short positions are preferred so far.

An alternative scenario assumes a breakdown of the local resistance level of 0.6588 with targets at resistance levels of 0.6670 (EMA144 and the middle of the rising channel on the daily chart), 0.6700 (EMA200 on the daily chart).

Further growth of NZD / USD is unlikely, unless, of course, the Fed also begins to aggressively reduce interest rates amid ongoing events in the financial markets.

From the news for today, we are waiting for the publication (in the period after 13:45 GMT) of data with the results of a milk auction organized by the New Zealand company Fonterra (a specialized trading platform GlobalDairyTrade - GDT). If the data indicate a fall in world prices for dairy products (forecast: -1.1%), primarily for milk powder, then the New Zealand dollar will decline.

Support Levels: 0.6510, 0.6490, 0.6430, 0.6400, 0.6300, 0.6260

Resistance Levels: 0.6588, 0.6635, 0.6670, 0.6700, 0.6790, 0.6865, 0.6940


Trading Recommendations


Sell by market. Stop-Loss 0.6590. Take-Profit 0.6510, 0.6490, 0.6430, 0.6400, 0.6300, 0.6260

Buy Stop 0.6590. Stop-Loss 0.6540. Take-Profit 0.6635, 0.6670, 0.6700

060819-NU-D.png


060819-NU-H4.png


*) For up-to-date and detailed analytics and news on the forex market visit Tifia Forex Broker website tifia.com
 
XAU/USD: the threat of recession is growing

08/07/2019


The sharp aggravation of the trade conflict between the United States and China led to increased fears of a recession in the United States and an even greater slowdown in global economic growth. This causes an increase in demand for defensive assets such as yen, government bonds, gold.

The yield on government bonds continues to decline, indicating an increasingly pessimistic mood of investors regarding the prospects for the economy. Yields on 10-year US Treasury bonds fell on Wednesday to 1.660% from 1.864% on Friday, to the lowest level since October 2016.

Gold quotes broke through the level of 1485.00 on Wednesday, reaching $ 1491.00 per troy ounce at the beginning of the European session. This is consistent with new highs since May 2013.

Shortly after the threat from the United States to impose new duties, the Chinese leadership banned state-owned companies from purchasing agricultural products, including soybeans, from the United States, which is a serious blow to American farmers. New duties will also increase the price of all goods in the United States.

If U.S. stock indices begin to decline again and close this week near the levels reached on Tuesday, then this will be the strongest weekly decline since December 2018.

White House economic adviser Lawrence Kudlow told CNBC on Tuesday that the US still wants to strike a deal with China despite being recognized it as currency manipulator, and continues to prepare for the Chinese trade delegation to arrive in the US in September.

However, many observers do not expect the United States or China to make any concessions. The trade conflict between the countries becomes unpredictable, which even more worries investors and increases the likelihood of a recession in the US and in the world.

Many economists estimate the likelihood of a recession in the United States next year at 50%.

In this situation, the demand from investors for protective assets and gold, including, is likely to continue in the near future.

And as soon as the Fed announces further easing of monetary policy, the price of gold will go in the direction of multi-year and absolute highs near the mark of 1920.00 dollars per ounce.

On Wednesday, XAU / USD hit a new 6-year high near 1491.00. The pair tested an important resistance level of 1485.00 (Fibonacci level 50% of the correction to the wave of decline since September 2011 and the mark of 1920.00). Fixation in the zone above this resistance level will indicate the completion of the correction and the full restoration of the global bullish gold trend.

In case of further growth of the XAU / USD pair, the intermediate target is at the resistance level of 1585.00 (Fibonacci level of 61.8%).

A strong positive momentum prevails. Above the local support levels of 1452.00 (July highs), 1440.00 (June highs), long positions are preferred.

An alternative scenario involves the breakdown of these support levels and a decrease to support levels of 1380.00 (Fibonacci 38.2% and highs of 2016), 1366.00 (highs of 2018), 1346.00 (bottom line of the ascending channel on the weekly chart).

But it’s too early to think about sales.

Support Levels: 1452.00, 1440.00, 1413.00, 1380.00, 1366.00, 1346.00, 1325.00, 1315.00, 1284.00, 1268.00, 1253.00

Resistance Levels: 1485.00, 1500.00, 1585.00


Trading Recommendations


Sell Stop 1470.00. Stop-Loss 1493.00. Take-Profit 1452.00, 1440.00, 1413.00

Buy Stop 1493.00. Stop-Loss 1470.00. Take-Profit 1500.00, 1585.00

070819-10-Y.png


070819-XU-W.png


070819-XU-D.png


*) For up-to-date and detailed analytics and news on the forex market visit Tifia Forex Broker website tifia.com
 
AUD/USD: downward dynamics prevails

08/08/2019

Current Dynamics


The escalation of the trade war between the United States and China has strengthened expectations of a worsening situation in world international trade and the economy. The growth of fears about this caused a collapse of stock quotes and indices on world stock markets. Demand for safe haven assets, such as government bonds, yen, gold, has risen sharply. On Wednesday, gold prices exceeded $ 1,500 an ounce for the first time in six years. Since the beginning of the month, prices have increased by 6.9%, and from the end of May - by 15%. Yields on 10-year US Treasury bonds fell on Wednesday to 1.595% from 1.864% on Friday, to the lowest level since October 2016.

Last Wednesday, interest rates fell immediately by three central banks (India, New Zealand and Thailand). On Wednesday, the RBNZ lowered its official interest rate by 0.50% to 1.00%, which was the second rate cut this year.

As follows from the text of the RBNZ statement, "global economic activity continues to weaken ... increased uncertainty and reduced international trade contribute to lower economic growth in the trading partner countries ... and central banks relax monetary policy to support their economies".

The RBA last Tuesday left the key interest rate at a record low of 1%, but gave a pessimistic forecast for the economy. "It is reasonable to expect that a long period of low interest rates will be required to progress towards lowering unemployment and achieve steady progress towards the target inflation rate", Philip Lowe said on Tuesday.

At 23:30 (GMT) on Thursday, Lowe will begin speaking with members of the parliamentary committee on economics. If he points out that the key rate needs to be lowered again, then the Australian dollar will again be under pressure. In this case, the pair AUD / USD will again go “south” as part of a global downtrend.

At the beginning of the European session, the pair AUD / USD is trading near the level of 0.6787, correcting after falling on Wednesday.

Nevertheless, negative dynamics prevail, despite the correction. It is likely that the current position of AUD / USD and growth to the levels of 0.6800, 0.6816, 0.6830 will be a good opportunity to resume sales of this currency pair.

We can return to the consideration of long positions only after the growth of AUD / USD to the zone above the resistance level of 0.6910 (EMA200 on the 4-hour chart) with targets not higher than the key resistance level of 0.7065 (EMA200 on the daily chart).

In case of resumption of decline, the targets will be the support levels 0.6680, 0.6600. The distant target is located at support levels of 0.6260, 0.6000 (lows of 2008-2009).

Support Levels: 0.6745, 0.6700, 0.6680, 0.6600, 0.6300

Resistance Levels: 0.6816, 0.6830, 0.6865, 0.6910, 0.7000, 0.7065


Trading Recommendations


Sell by market. Sell-Limit 0.6800, 0.6816, 0.6830. Stop-Loss 0.6870. Take-Profit 0.6745, 0.6700, 0.6680, 0.6600, 0.6300

Buy Stop 0.6870. Stop-Loss 0.6810. Take-Profit 0.6910, 0.7000, 0.7065

080819-10-Y.png


080819-AU-D.png


080819-AU-H1.png


*) For up-to-date and detailed analytics and news on the forex market visit Tifia Forex Broker website tifia.com
 
WTI: negative momentum prevails

08/09/2019


Global financial markets remain under pressure from intensified international trade conflicts, primarily between the United States and China. The oil market does not stand aside. Oil prices are actively declining, having lost about 25% over the past 12 months.

Last Thursday, the price reached a new 7-month low near $ 50.47 per barrel of WTI crude oil after Donald Trump announced the introduction of new duties on the import of Chinese goods into the United States.

The trade conflict between the United States and China reached a new level when Chinese authorities announced retaliation. In particular, Beijing banned Chinese state-owned companies from buying soybeans in the United States, and the People's Bank of China lowered the RMB to dollar exchange rate below 7.0000.

The oil market received an additional negative impetus after last Wednesday the US Department of Energy’s Energy Information Administration reported an increase in oil reserves in the country last week (+2.385 million barrels, while oil reserves were expected to fall by 2.845 million barrels).

The fall in oil prices indicates an increase in investor anxiety about the state of the global economy, which continues to negatively affect financial markets.

The breakdown of the support level of 50.30 (Fibonacci level 23.6% of the upward correction to the fall from the highs of the last few years near the level of 76.80 to the level of support near the mark of 42.15) and a further decrease will mean the return of WTI oil prices to the global bearish trend.

In this case, the preliminary reduction targets will be located at the support level of 42.15 (Fibonacci level of 0% and December 2018 lows).

In an alternative scenario, the signal to resume purchases will be a breakdown of the short-term resistance level 54.40 (EMA200 on the 1-hour chart) and growth into the zone above the resistance level 55.40 (Fibonacci 38.2%) with targets at the resistance level 58.80 (EMA200 on the daily chart). Fixing the price in the zone above the resistance level of 59.50 (Fibonacci level of 50%) will speak about the resumption of the bull trend.

On Friday, oil market participants will follow the publication (at 17:00 GMT) of the weekly report of the American oilfield services company Baker Hughes on the number of active drilling rigs in the United States. Previous reports indicated a decrease in the number of active oil platforms in the United States, to 770 units at the moment. If the report again indicates a decrease in the number of such installations, then this may give a short-term positive impetus to prices.

However, a strong negative momentum prevails. Short positions are preferred.

Support Levels: 50.30, 49.00, 42.15

Resistance Levels: 54.40, 55.40, 56.80, 58.00, 59.50, 60.90, 63.50, 64.40, 66.50


Trading Scenarios


Sell Stop 51.85. Stop-Loss 53.75. Take-Profit 50.30, 49.00

Buy Stop 53.75. Stop-Loss 51.85. Take-Profit 54.40, 55.40, 56.80, 58.00

090819-WTI-D.png


090819-WTI-H1.png


*) For up-to-date and detailed analytics and news on the forex market visit Tifia Forex Broker website tifia.com
 
S&P500: Current Dynamics and Recommendations

08/12/2019


In July, the S&P500 rose to record highs near 3028.0, which is about 22% higher than the opening price at the beginning of the year.

The growth of US stock indexes was contributed by the expectations of lower interest rates by the Fed and the positive macro statistics coming from the USA. However,

investors' concerns about the slowdown in global economic growth and the aggravation of trade confrontation between the US and China caused a sharp increase in volatility in world stock markets and a drop in indices. After sharp fluctuations, all three leading US indices finished the week with a decline of about 1%.

S&P500 completed last week at around 2918.0.

"We are not ready to conclude an agreement, but we'll see how everything goes", Trump told reporters on Friday. "We'll see if China meets with us in September".

During today's Asian session, the S&P500 and other major US stock indexes rose, but fell again at the beginning of the European session. Thus, S&P500 futures are trading at the beginning of the European session on Monday near the level of 2907.0, 14 points below the opening price today.

The S&P500 futures are trading below resistance levels at 2944.0 (EMA200 on the 4-hour chart), 2934.0, 2920.0 (EMA200 on the 1-hour chart).

Below the short-term resistance level of 2920.0, short positions with targets located near the support levels of 2845.0 (EMA200 on the daily chart), 2865.0 (Fibonacci level 23.6% of the correction to growth since December 2018 and mark 2335.0) are preferable. Above these support levels, the S&P500 bullish trend remains.

The breakdown of support levels 2845.0, 2865.0 can trigger a deeper decline to support levels 2765.0 (Fibonacci 38.2%), 2680.0 (Fibonacci 50%).

You can return to shopping after fixing the S&P500 in the zone above the resistance level of 2944.0.

Support levels: 2900.0, 2865.0, 2845.0, 2765.0, 2730. 2680.0

Resistance Levels: 2920.0, 2934.0, 2944.0, 2965.0, 3000.0, 3028.0


Trading recommendations


Sell by market. Stop-Loss 2945.0. Goals 2900.0, 2865.0, 2845.0, 2800.0

Buy Stop 2945.0. Stop-Loss 2910.0. Goals 2965.0, 3000.0, 3028.0, 3100.0, 3200.0

120819-10-Y.png


120819-S500-D.png


120819-S500-H1.png


*) For up-to-date and detailed analytics and news on the forex market visit Tifia Forex Broker website tifia.com
 
EUR/USD: what awaits Eurodollar

08/13/2019


After the ECB signaled in July that it was ready to soften its monetary policy, EUR / USD hit a new annual low near 1.1100, but then adjusted to current levels.

Since the opening of today's trading day, the Eurodollar has moderately decreased, while continuing to trade in the range near the short-term support level of 1.1185 (EMA200 on the 1-hour chart) and short-term resistance level of 1.1200 (EMA200 on the 4-hour chart).

Expectations of further easing of the monetary policy of the ECB put pressure on the euro and the pair EUR / USD. It is likely that at the ECB meeting on September 12 a whole package of measures will be taken, including a 0.25% reduction in the interest rate and a restart of the quantitative easing program worth 2.6 trillion euros.

At the same time, despite Trump's criticism of the Fed and its monetary policy, and the expectation of a Fed rate cut, the dollar continues to be in demand among investors.

Underestimated risks that the UK will leave the European Union on October 31 without any agreement on Brexit, political and economic differences within Eurozone, as well as the accelerating devaluation of national currencies in a number of countries (at the beginning of the month there are three central banks at once - India, Thailand, New Zealand - reduced interest rates), only add the negative in relation to the mood of the business.

Investors are concerned about the escalation of the trade conflict between the US and China (from September 1, the US is expected to introduce new 10% import duties on Chinese goods). On the other hand, the American economy looks more stable in comparison with other major world economies and continues to grow, which causes an influx of investment in American assets and the dollar.

Below the resistance levels 1.1315 (EMA200 on the daily chart), 1.1285 (Fibonacci level 23.6% of the correction to the fall from the level of 1.3900, which began in May 2014), long-term negative dynamics persist.

An upward correction is also possible, but so far no higher than the resistance levels of 1.1245 (the upper line of the descending channel on the daily chart and the highs of August), 1.1270 (EMA144 on the daily chart).

Support Levels: 1.1185, 1.1125, 1.1070, 1.1000

Resistance Levels: 1.1200, 1.1245, 1.1270, 1.1285, 1.1315


Trading Scenarios


Sell by market. Stop-Loss 1.1250. Take-Profit 1.1125, 1.1070, 1.1000

Buy Stop 1.1250. Stop-Loss 1.1190. Take-Profit 1.1270, 1.1285, 1.1315

130819-DXY.png


130819-EU-D.png


130819-EU-H1.png


*) For up-to-date and detailed analytics and news on the forex market visit Tifia Forex Broker website tifia.com
 
AUD/USD: Current dynamics and recommendations

08/14/2019


As reported by the Australian Bureau of Statistics on Wednesday, the wage index in the 2nd quarter grew by 0.6% and by 2.3% in annual terms. The forecast was + 0.5% and + 2.2%, respectively.

The data were better than expected. However, this is not enough to accelerate inflation. RBA Governor Philip Lowe called slower wage growth and productivity a major economic challenge.

Earlier this month, RB of Australia left the key interest rate at a record low of 1%, but gave a pessimistic forecast for the economy. RBA managing director Philip Lowe lowered the forecast for Australia's GDP growth in 2019 to 2.5% from 2.75% and added that unemployment is expected to drop to about 5% in the next two years. According to the RBA management, for the growth of salaries and acceleration of inflation to the target range, an unemployment rate of 4.5% or lower is required. Now unemployment is at the level of 5.2% and is gradually growing, but not decreasing, and the return of inflation to the middle of the target range of 2% -3% is not visible even on a distant horizon.

"It is reasonable to expect that a long period of low interest rates will be required to progress towards lowering unemployment and achieve steady progress towards the target inflation rate", Lowe said after an RBA meeting in August.

On Thursday (01:30 GMT) data from the Australian labor market will be published. Most likely, in July unemployment remained unchanged at 5.2%.

The expectation of further easing of the monetary policy of the RBA puts pressure on the AUD in the direction of its further weakening.

Meanwhile, the US dollar strengthened on Tuesday after the publication of data on consumer inflation in the United States, which turned out to be better than forecast, and after the White House announced that it would postpone the introduction of new tariffs on imports of some Chinese goods until December 15.

At the beginning of the European session on Wednesday, the pair AUD / USD is trading near the level of 0.6760. Negative dynamics prevails.

Entry into short positions is allowed "by the market". A possible correctional increase to the resistance levels of 0.6795 (EMA200 on the 1-hour chart), 0.6830, 0.6865 (May lows), 0.6885 (EMA200 on the 4-hour chart) will be an additional opportunity to resume sales of this currency pair.

We can return to the consideration of long positions only after the growth of AUD / USD to the zone above the resistance level of 0.6885 with targets located no higher than the key resistance level of 0.7050 (EMA200 on the daily chart).

In case of resumption of decline, the targets will be the support levels 0.6680, 0.6600. The distant target is located at support levels of 0.6260, 0.6000 (lows of 2008 - 2009).

Support Levels: 0.6745, 0.6700, 0.6680, 0.6600, 0.6300

Resistance Levels: 0.6795, 0.6830, 0.6865, 0.6885, 0.7000, 0.7050


Trading Recommendations


Sell by market. Sell-Limit 0.6795, 0.6825. Stop-Loss 0.6840. Take-Profit 0.6700, 0.6680, 0.6600, 0.6300

Buy Stop 0.6840. Stop-Loss 0.6790. Take-Profit .6865, 0.6885, 0.7000, 0.7050

140819-AU-D.png


140819-AU-H4.png


*) For up-to-date and detailed analytics and news on the forex market visit Tifia Forex Broker website tifia.com
 
NZD/USD: dynamics and recommendations

08/15/2019


Since the opening of today's trading day, the American dollar has been declining. At the beginning of today's European session, DXY dollar index futures are trading near 97.70, 12 pips below the opening price of today's trading day. Meanwhile, commodity currencies, including the New Zealand dollar, also remain under pressure amid a worsening trade war between the US and China.

New Zealand's export-oriented economy is extremely vulnerable amid escalating trade war between the US and China.

Last week, the RBNZ cut the rate by 50 bp to 1.00%, explaining this decision by the worsening trade war between the US and China and the loss of momentum in the New Zealand economy.

RBNZ leaders believe that wage growth remains weak. At the same time, inflationary expectations are falling, and low levels of business confidence indicate a slowdown in hiring and wage growth.

There is growing concern among participants in international financial markets that the slowdown in economic growth and the threat of recession will spread to the whole world, including China, the United States, and their trade and economic partners. It can be assumed that the global cycle of rate cuts will gain momentum in the next few months.

In the current situation, further easing of the monetary policy of the RB of New Zealand should be expected, which is a strong negative factor for NZD.

Currently, NZD / USD is trading near the level and the local support level of 0.6430 (October 2018 lows).

A breakdown of this level will provoke a further decrease in NZD / USD with targets at support levels of 0.6400, 0.6300, 0.6260 (Fibonacci level of 0% and minimums of the global wave of pair decline from the level of 0.8820).

Short positions are preferable, unless, of course, the Fed also begins to aggressively lower the interest rate amid ongoing events in the financial markets.

Below the resistance level of 0.6680 (ЕМА200 on the daily chart), the bearish trend NZD / USD prevails.

Support Levels: 0.6430, 0.6400, 0.6300, 0.6260

Resistance Levels: 0.6480, 0.6570, 0.6635, 0.6680, 0.6700, 0.6790


Trading Scenarios


Sell by market. Stop-Loss 0.6490. Take-Profit 0.6400, 0.6300, 0.6260

Buy Stop 0.6510. Stop-Loss 0.6460. Take-Profit 0.6570, 0.6600, 0.6680

150819-DXY.png


150819-NU-D.png


150819-NU-H4.png


*) For up-to-date and detailed analytics and news on the forex market visit Tifia Forex Broker website tifia.com
 
EUR/USD: Current dynamics and recommendations

08/16/2019


With the opening of today's trading day, Eurodollar is again declining. Market participants are preparing for the next ECB meeting in September and new stimulus measures by the European Central Bank.

According to Olli Rehn, member of the ECB Governing Council, the European Central Bank at its meeting in September will announce a substantial stimulus package that will exceed investor expectations.

The ECB is likely to announce a 0.1% reduction in the key interest rate, which is now -0.4%, as well as an allocation of about 50 billion euros per month for additional bond purchases under the quantitative easing program.

Published disappointing economic data from China and Germany this week, as well as positive macro data from the United States, made market participants even more doubt the prospects for global economic growth, and also again updated the attractiveness of American assets and a more stable state of the US economy.

According to official data released on Thursday, US retail sales in July rose 0.7% (forecast was + 0.3%).

Retail sales data are encouraging regarding the US economy, that remains demand for US assets and the dollar.

Today (at 14:00 GMT) the University of Michigan consumer confidence index (preliminary release for August) will be published, which reflects the confidence of American consumers in the country's economic development. It is expected that this indicator will come out in August with a value of 97.7 (against 98.4 in July), which could negatively affect the dollar (in the short term) due to a relative decrease in the indicator. Data better than expected will certainly support the dollar, and will put additional pressure on EUR / USD.

Below the resistance levels of 1.1305 (EMA200 on the daily chart), 1.1285 (Fibonacci level 23.6% of the correction to the fall from the level of 1.3900, which began in May 2014), long-term negative dynamics persist. In the current situation, short positions look relevant and safer, and the reduction targets are located at support levels 1.1000, 1.0000.

You can return to purchases as part of the corrective growth of EUR / USD only after fixing the price in the zone above the short-term resistance level of 1.1160 (EMA200 on the 1-hour chart).

Support Levels: 1.1070, 1.1000, 1.0000

Resistance Levels: 1.1125, 1.1160, 1.1190, 1.1245, 1.1260, 1.1285, 1.1305


Trading Recommendations


Sell by market. Stop-Loss 1.1130. Take-Profit 1.1070, 1.1000, 1.0000

Buy Stop 1.1130. Stop-Loss 1.1060. Take-Profit 1.1160, 1.1190, 1.1245, 1.1260, 1.1285

160819-DXY.png


160819-EU-D.png


160819-EU-H1.png


*) For up-to-date and detailed analytics and news on the forex market visit Tifia Forex Broker website tifia.com
 
S&P500: Current Dynamics and Recommendations

Expectations of a softening of the monetary policy of the Fed and positive macro statistics coming from the United States, contributed to the growth of major US stock indexes last month to new heights.

The S&P500 index updated a record high near 3028.0, however, subsequently collapsed amid Trump's threats to introduce new duties on Chinese goods from September 1.

S&P500 last week again tested the key support level of 2848.0 (EMA200 on the daily chart), dropping to around 2815.0.

Nevertheless, investors are gradually becoming more active after recent events related to the aggravation of the trade conflict between the USA and China.

At the beginning of the new week, gold quotes and yield on US government bonds are declining.

Investors are encouraged by the prospect of new incentive measures by the Central Banks in several countries with the largest economies.

Last week, the White House administration decided to postpone plans to introduce a new 10% duty on some Chinese goods worth $ 156 billion, which was due to take effect on September 1. In addition, the White House said that they are preparing the next round of negotiations.

Since the opening of today's trading day, the S&P500 has been growing, and for the third day in a row.

Above the support levels of 2848.0 (ЕМА200 on the daily chart), 2865.0 (Fibonacci level 23.6% of the correction to the growth since December 2018 and the level of 2335.0), the S&P500 long-term bullish trend remains.

After the breakdown of the resistance level of 2927.0 (EMA50 on the daily chart and EMA200 on the 4-hour chart), the S&P500 will continue to move towards recent highs near 3028.0.

Support Levels: 2900.0, 2892.0, 2865.0, 2848.0, 2765.0, 2730. 2680.0

Resistance Levels: 2927.0, 2965.0, 3000.0, 3028.0


Trading Recommendations


Sell Stop 2888.0. Stop-Loss 2929.0. Goals 2865.0, 2848.0

Buy Stop 2929.0. Stop-Loss 2888.0. Goals 2965.0, 3000.0, 3028.0, 3100.0, 3200.0

190819-s500-D.png


190819-s500-H4.png


190819-s500-H1.png


*) For up-to-date and detailed analytics and news on the forex market visit Tifia Forex Broker website tifia.com
 
GBP/USD: downward trend prevails

08/20/2019


Amid the risks to the British economy, the GBP / USD resumed falling due to the increased likelihood of a “hard” Brexit. Economists and government officials warn that a tough Brexit will negatively impact the economy.

Boris Johnson, who succeeded Theresa May as a prime minister, said he was ready for a "hard" Brexit. On October 31, Great Britain must finally withdraw from the EU, even if no agreement is reached between the parties. In his view, "the exit agreement is dead and should be canceled, but there is the possibility of a new deal".

Boris Johnson is scheduled to meet with EU leaders this week. Probably, following the results of these meetings, new negative news for the pound will appear. The UK government reiterates its intention to withdraw the country from the bloc by October 31, and the EU does not intend to revise the earlier exit agreement.

Labor leader Jeremy Corbin has called on various parties to vote no confidence in Prime Minister Boris Johnson in order to remove him from his post and make Brexit possible to a later date.

Nevertheless, the efforts of Jeremy Corbin to prevent a hard Brexit so far have little effect on the dynamics of the pound. Investors are preparing for the worst scenario.

Long-term negative dynamics prevail. The immediate goal of the decline is the support level of 1.2000 (2017 lows and the Fibonacci level 0% of a correction to the GBP / USD decline in a wave that began in July 2014 near the level of 1.7200).

We can return to the consideration of long positions only after the pair will grow into the zone above the resistance level of 1.2280 (ЕМА200 on the 4-hour chart and the upper line of the downward channel on the daily chart).

However, growth above the local resistance levels of 1.2480, 1.2530 is unlikely. In the current situation, so far only short positions on the GBP / USD should be considered.

Support Levels: 1.2000

Resistance Levels: 1.2120, 1.2210, 1.2280, 1.2480, 1.2530, 1.2740


Trading Scenarios


Sell by market. Stop-Loss 1.2180. Take-Profit 1.2000, 1.1900

Buy Stop 1.2180. Stop-Loss 1.2080. Take-Profit 1.2210, 1.2280, 1.2480, 1.2530

200819-GU-D.png


200819-GU-H4.png


200819-GU-H1.png


*) For up-to-date and detailed analytics and news on the forex market visit Tifia Forex Broker website tifia.com
 
USD/CAD: positive dynamics continues

08/21/2019

Current Dynamics


On Wednesday (at 18:00 GMT) the minutes of the July meeting of the Fed will be published, which may indicate a further path for the development of monetary policy in the United States. Investors expect from the Fed additional signals regarding the prospects of monetary policy. Many economists and market participants expect that Fed rates by the end of the year will be below the current level of 2.25%. Today it is the highest rate among the 8 largest world central banks.

Second on this list is the Bank of Canada. In July, the Bank of Canada left the target value of the one-day interest rate unchanged at 1.75%.

The next meeting of the Bank of Canada on monetary policy is scheduled for September 4. Market participants will pay attention to the publication, on Wednesday at 12:30 (GMT), of the inflationary consumer price indices in Canada, which reflect the dynamics of retail prices in the corresponding basket of goods and services. The target inflation rate for the Bank of Canada is in the range of 1% -3%. The increase in CPI is a harbinger of a rate increase and a positive factor for CAD. If the data for July is worse than the previous values, then this will negatively affect CAD. Data is better than expected and above the previous values will strengthen the Canadian dollar. In this case, USD / CAD will decline.


At the beginning of the European session on Wednesday, the USD / CAD pair is trading at 1.3300,

near the short-term support level of 1.3284 (EMA200 on the 1-hour chart).

A breakdown of this level will provoke a further decrease in the framework of the downward correction with targets at support levels 1.3245, 1.3230 (EMA200 on the 4-hour chart).

The breakdown of these levels will trigger a further decline in the medium-term bearish trend with targets at support levels 1.3020, 1.2880 (EMA200 on the weekly chart).

Above the key support level of 1.3245 (EMA200 on the daily chart), the long-term positive dynamics of USD / CAD prevails. Long positions with targets at resistance levels 1.3435, 1.3452 (Fibonacci level 23.6% of the downward correction to the pair's growth in the global uptrend since September 2012 and the level of 0.9700), 1.3465, 1.3520, 1.3560 (maximums of the year) are preferable.

Support Levels: 1.3284, 1.3245, 1.3230, 1.3185, 1.3020, 1.2975, 1.2880

Resistance Levels: 1.3345, 1.3435, 1.3452, 1.3465, 1.3520, 1.3560, 1.3600, 1.3660


Trading Scenarios


Sell Stop 1.3275. Stop-Loss 1.3350. Take-Profit 1.3245, 1.3230

Buy Stop 1.3350. Stop-Loss 1.3275. Take-Profit 1.3400, 1.3435, 1.3452, 1.3465, 1.3520, 1.3560, 1.3600, 1.3660

210819-UC-D.png


210819-UC-H1.png


*) For up-to-date and detailed analytics and news on the forex market visit Tifia Forex Broker website tifia.com
 
Top