• The Forex, Binary Options Forum - welcomes you to our Community!

    DigitalCashPalace Forum is dedicated to discussions about Forex, Binary Options, commodities, stocks related.

    Please take a look around, and feel free to .

AUD/USD: Corrective Decline

24/07/2018


Support and resistance levels


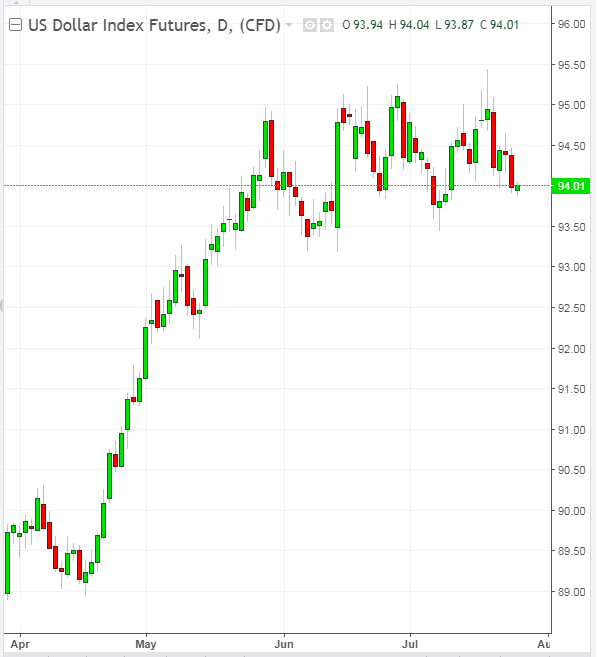
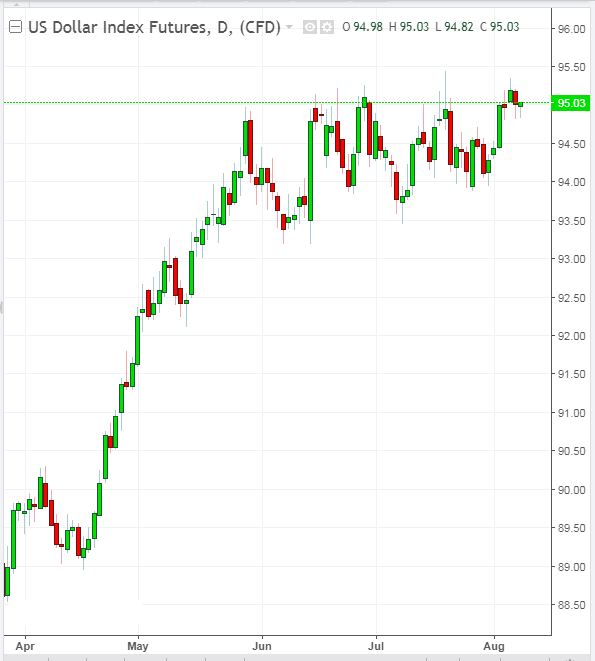
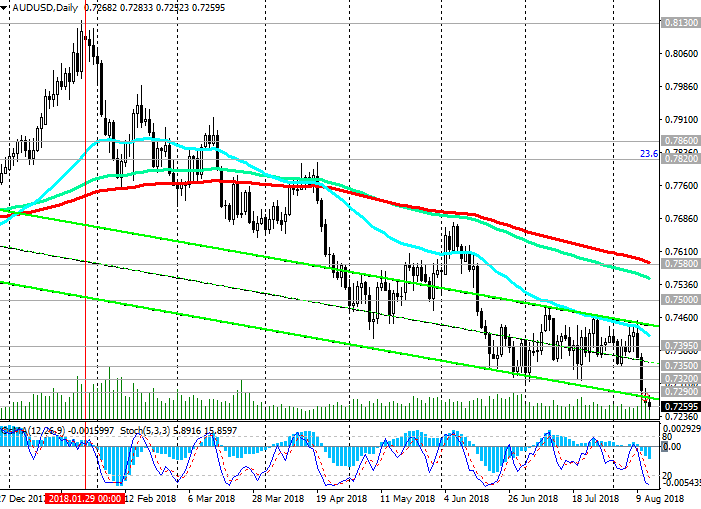
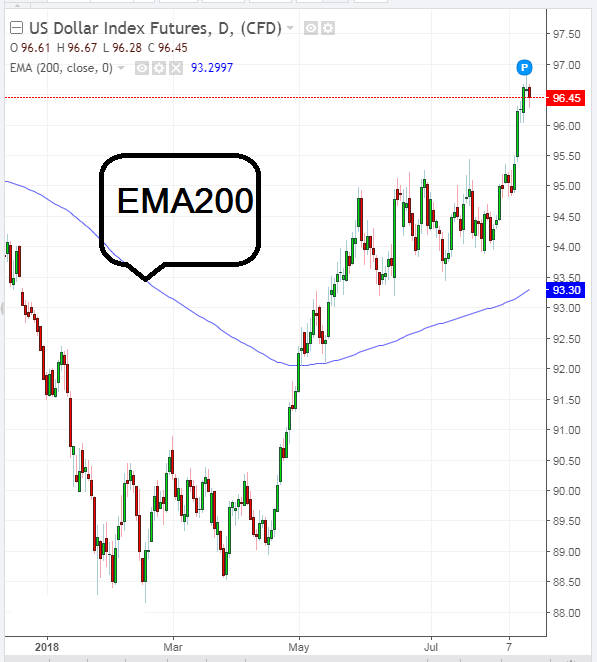
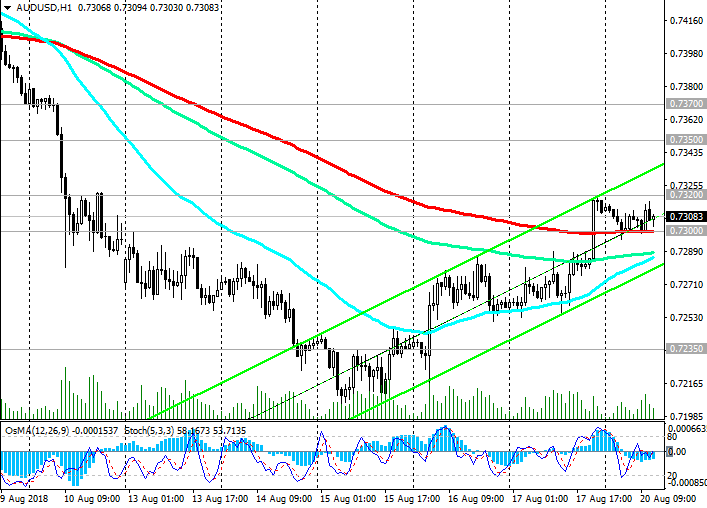
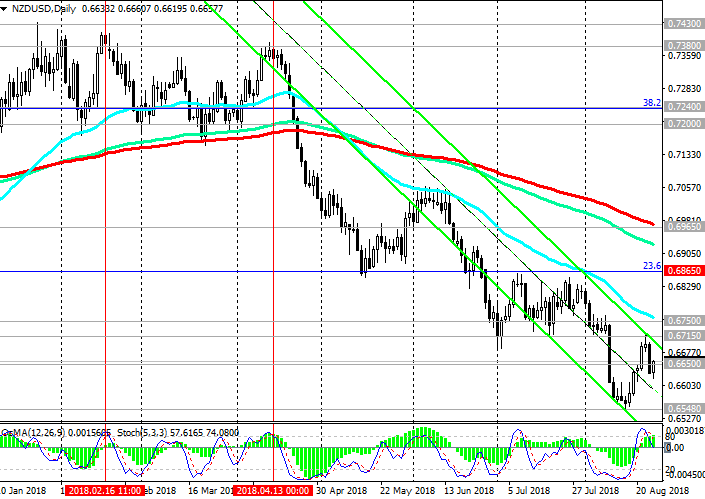
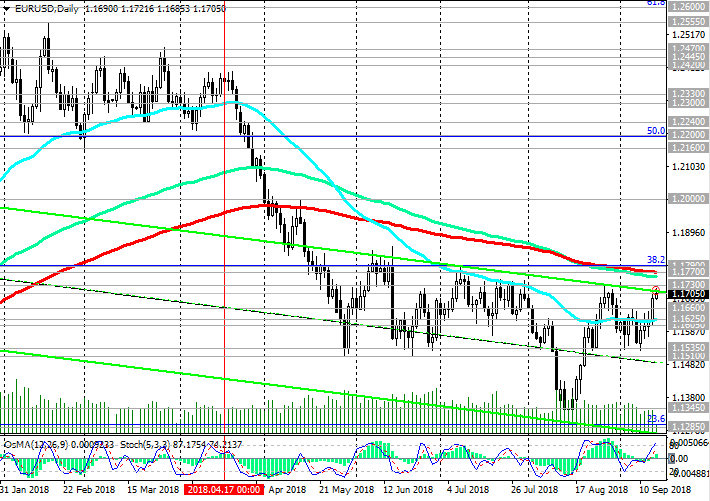
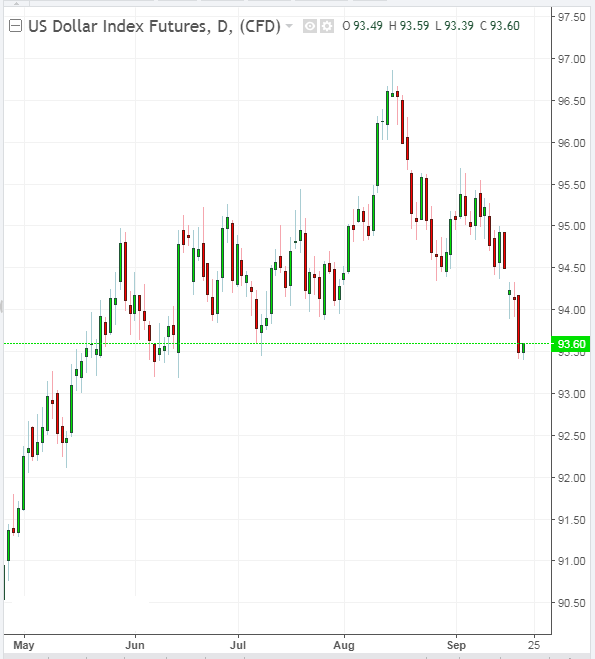
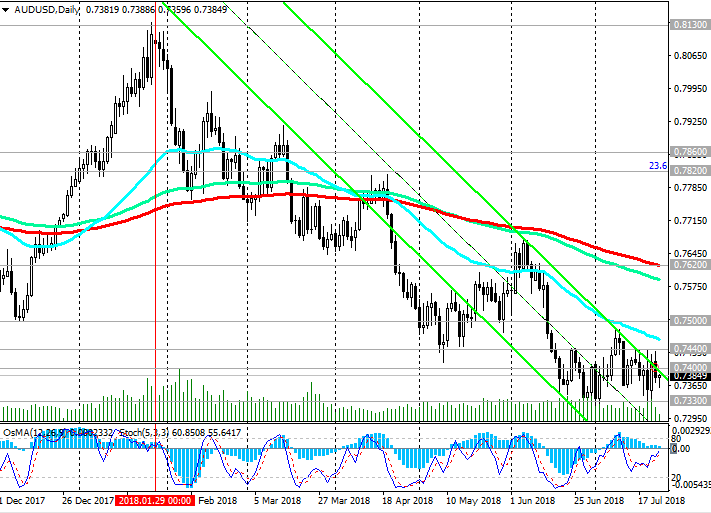
The US dollar is declining on Tuesday. Nevertheless, so far this reduction should be regarded as correctional. The different focus of monetary policy of central banks in the US and Australia will be the main most important long-term factor in favor of weakening the AUD / USD pair. The negative dynamics is prevailing. Short positions are preferred. The immediate goal of the decline is the support level of 0.7330 (lows of the year).

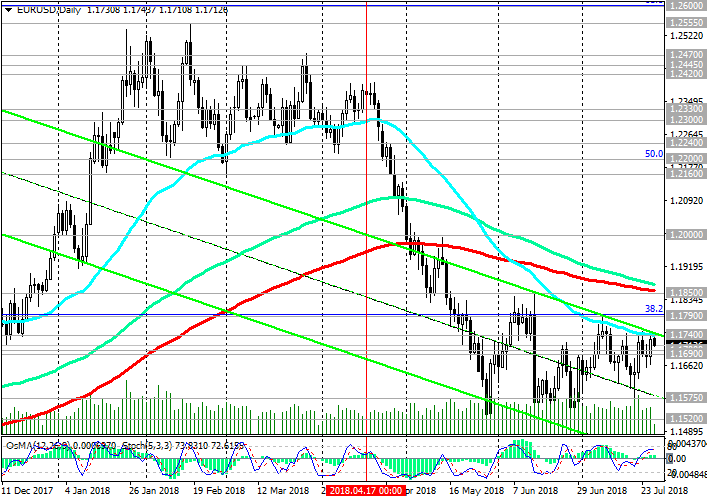
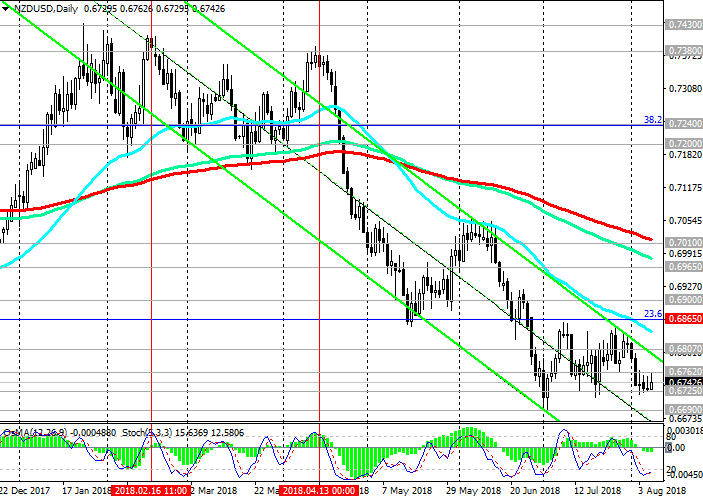
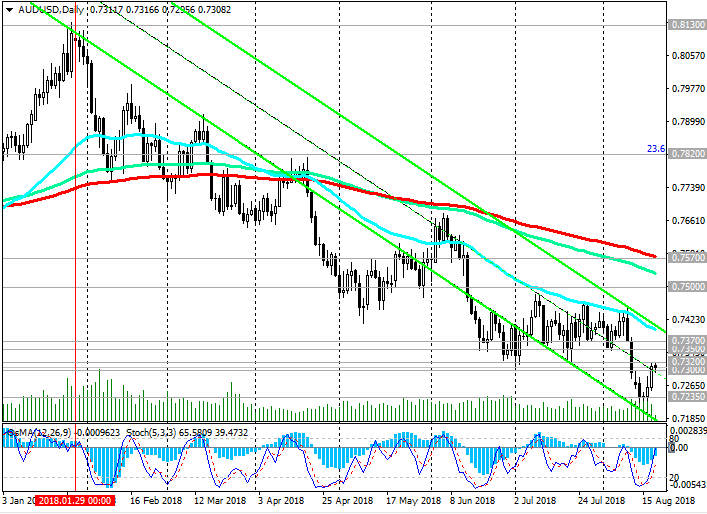
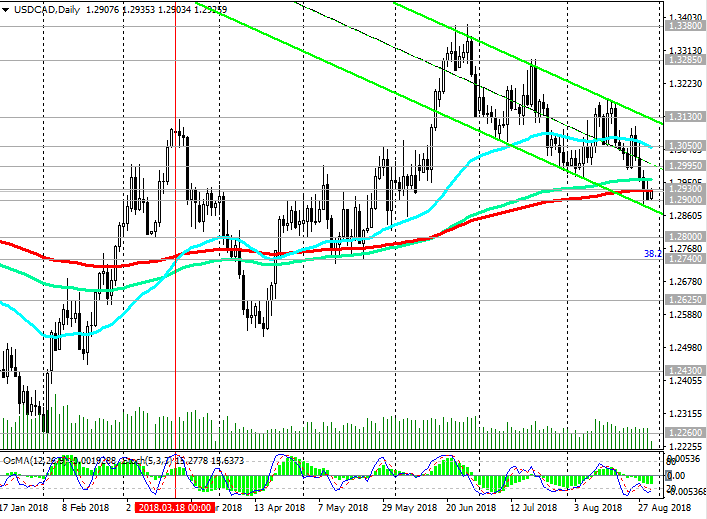
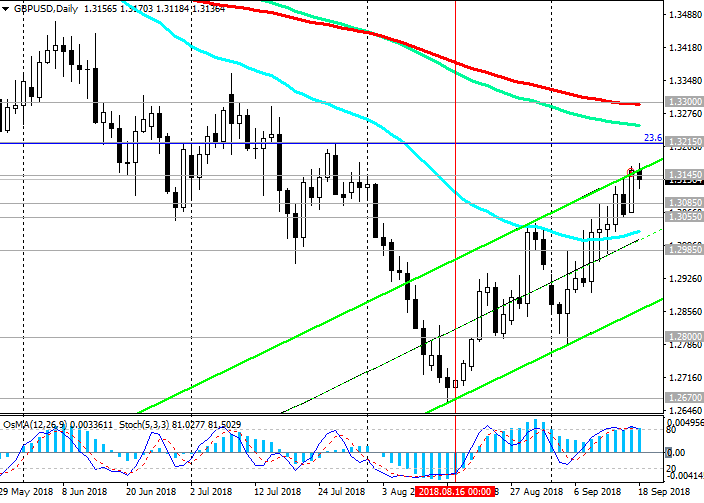
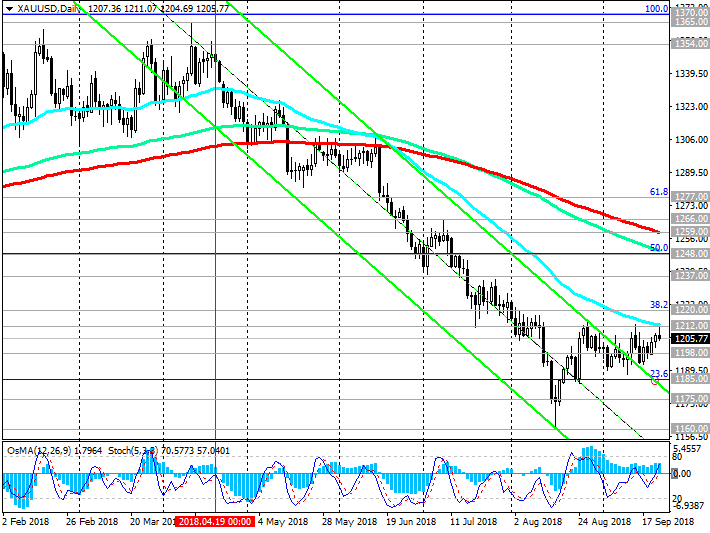
In the event of a breakdown of the support level of 0.7330, the targets will be the support levels of 0.7200, 0.7150 (the bottom line of the descending channel on the daily chart).

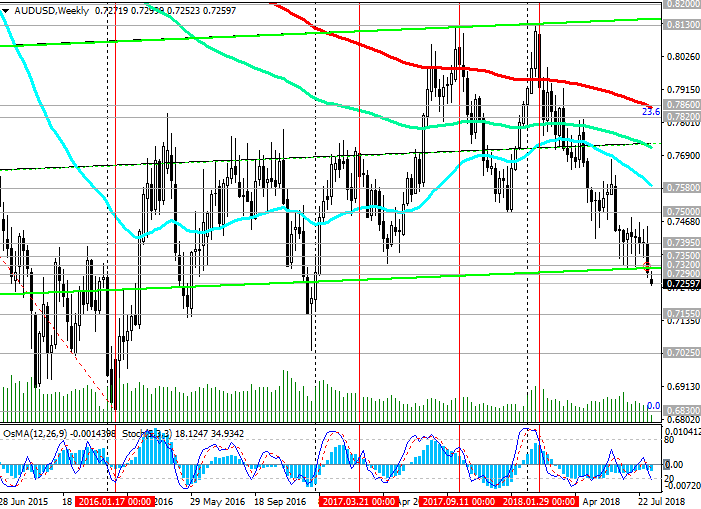
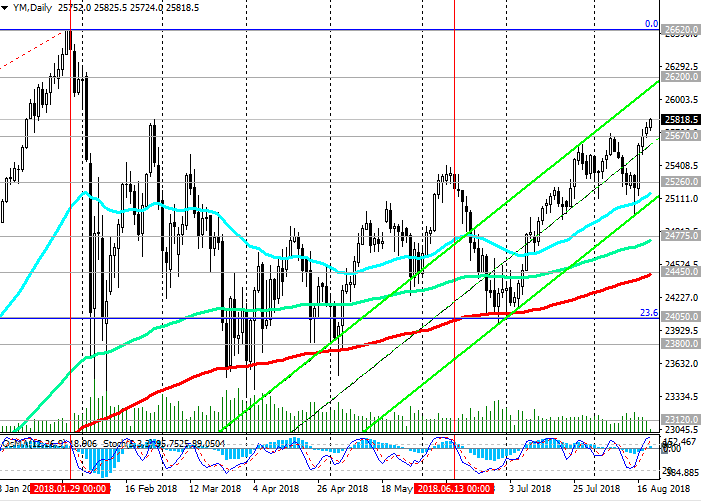
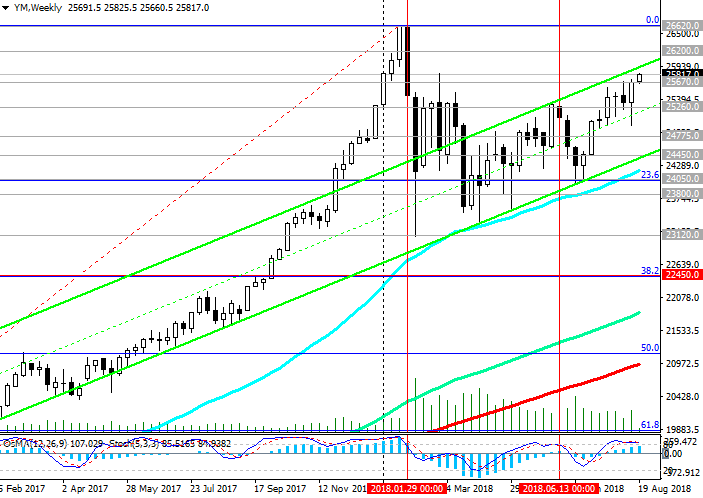
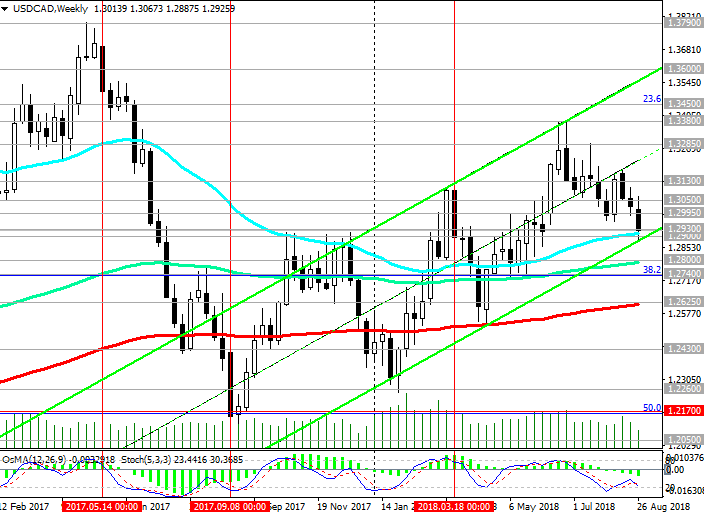
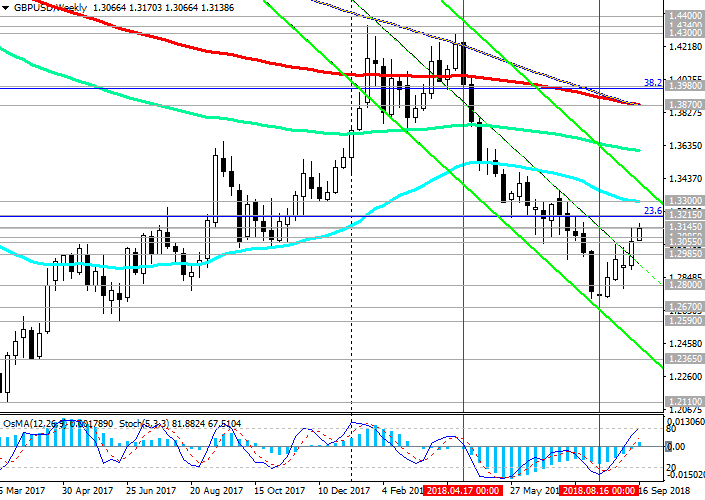
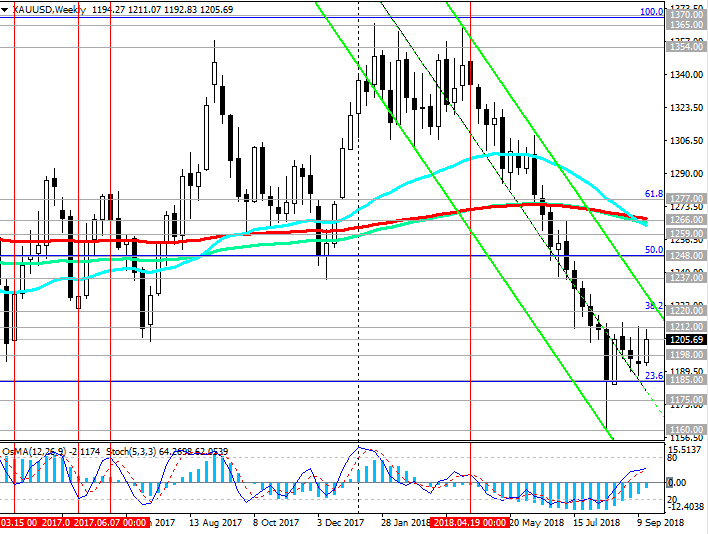
Only if the AUD / USD returns above the key resistance level of 0.7620 (EMA200 on the daily chart) can long-term long positions be considered with targets at the resistance level of 0.7820 (Fibonacci level 23.6% of the correction to the fall wave of the pair since August 2011 and the level of 1.1030 The minimum of this wave is near the level of 0.6830), 0.7860 (EMA200 on the weekly chart).

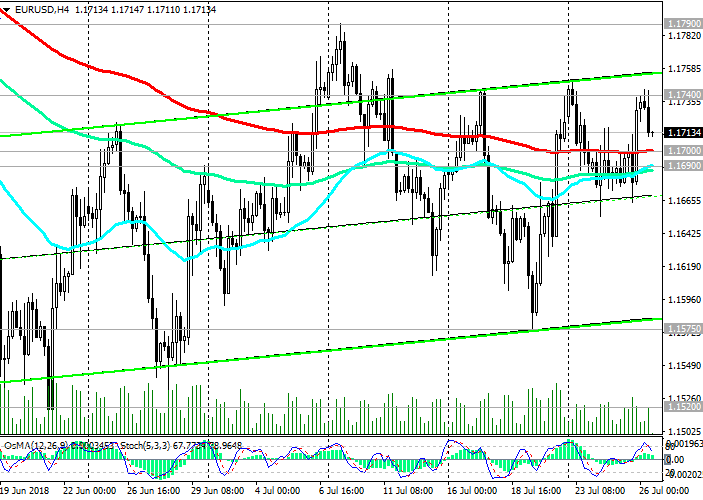
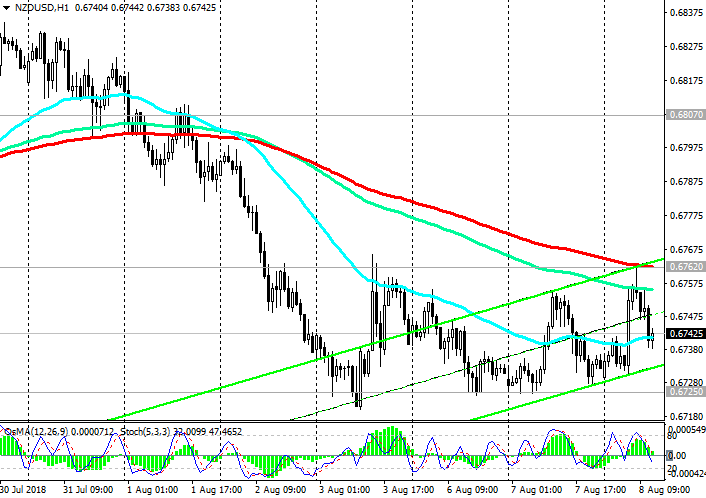
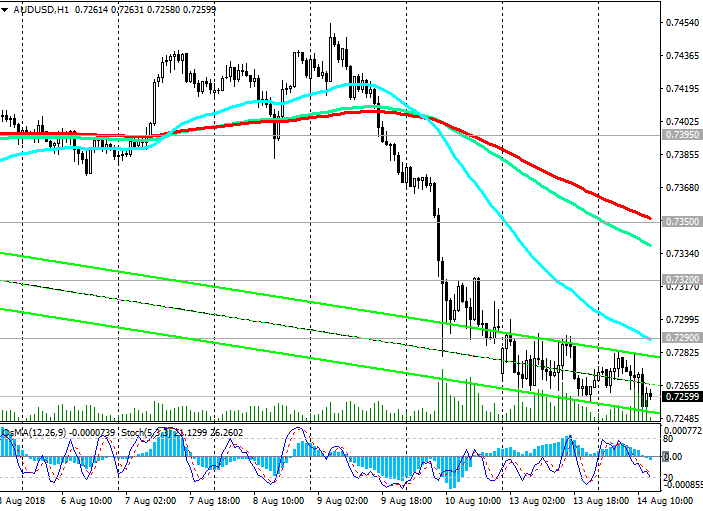
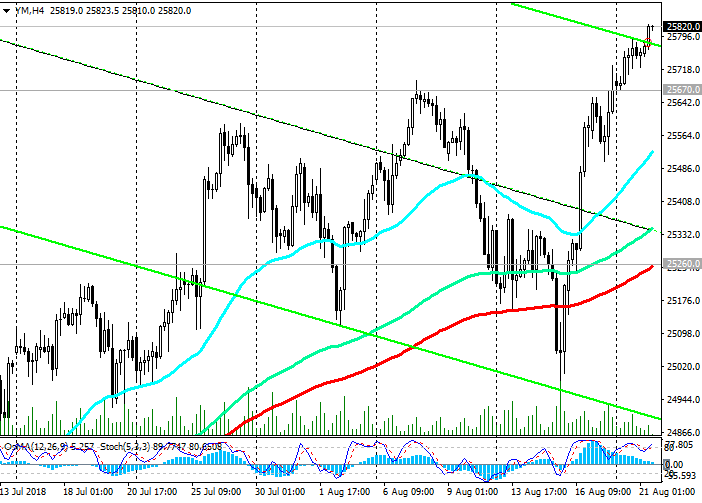
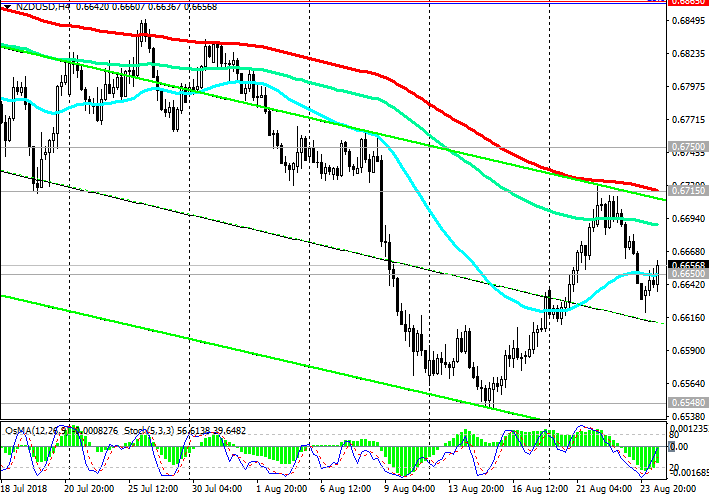
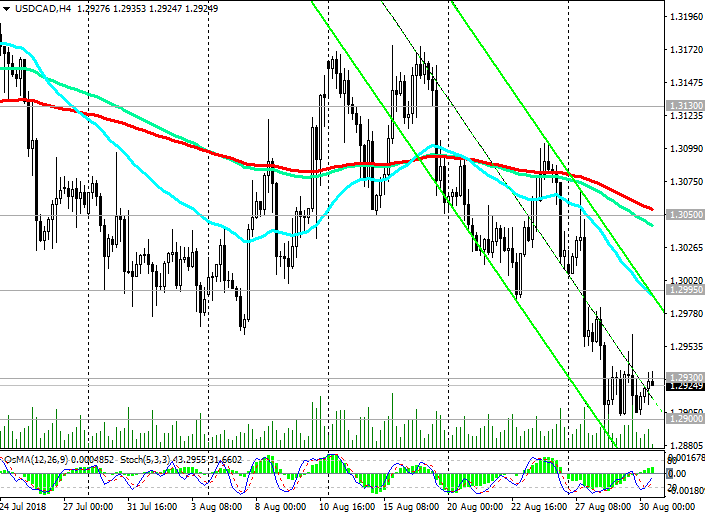
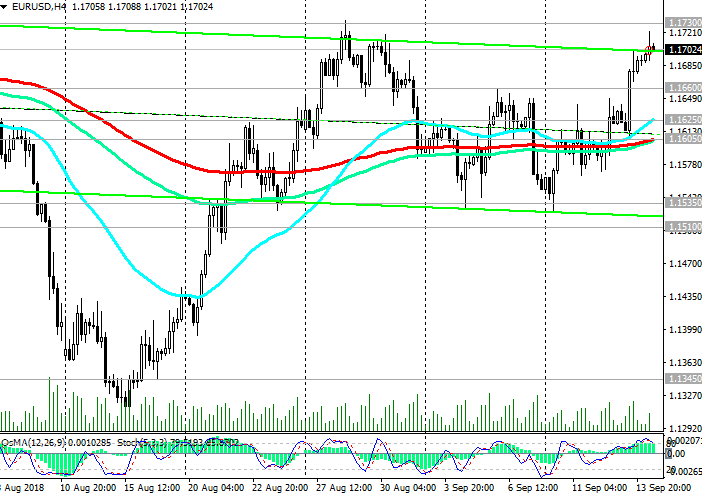
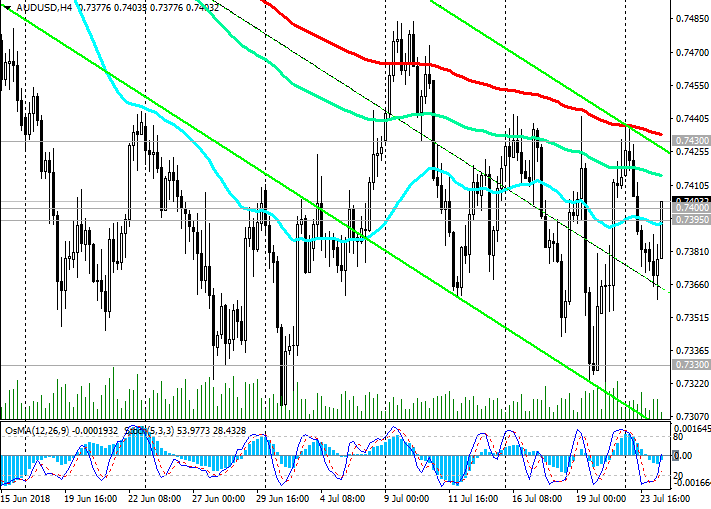
The signal for purchases may be a breakdown of the short-term resistance level 0.7430 (EMA200 on the 4-hour chart).

*)An advanced fundamental analysis is available on the Tifia Forex Broker website at tifia.com/analytics


Support levels: 0.7395, 0.7330, 0.7270, 0.7155, 0.7025

Resistance levels: 0.7430, 0.7500, 0.7620, 0.7700, 0.7820, 0.7860


Trading Scenarios


Sell in the market. Stop-Loss 0.7440. Take-Profit 0.7330, 0.7300, 0.7270, 0.7155, 0.7025

Buy Stop 0.7440. Stop-Loss 0.7385. Take-Profit 0.7500, 0.7620


240718-_AU-_D.png


240718-_AU-_H4.png


*) For up-to-date and detailed analytics and news on the forex market visit Tifia Forex Broker website tifia.com
 
EUR/USD: Trading Scenarios

26/07/2018


Since mid-April, EUR / USD has been trading in a downward channel on the weekly chart, the lower limit of which is near the support level 1.1285 (Fibonacci level 23.6% of the correction to the fall from 1.3900, which began in May 2014).

The signal for the resumption of short positions will be the break of the short-term support level 1.1690 (EMA200 on the 1-hour chart). The target of the decline is the level of support 1.1520 (lows of the year). In case of breakdown of the support level 1.1520, the target of further decline will be the level of support 1.1285. The prevailing negative dynamics.

An alternative scenario will be connected with the breakdown of the resistance level 1.1750 (EMA200 on the weekly chart) and the rise to the resistance level 1.1850 (EMA200 on the daily chart).

Nevertheless, the different orientation of the monetary policies of the Fed and the ECB is the main negative driver for EUR / USD. Short positions are preferred.

Today, all the attention of market participants will be focused on the ECB meeting. The decision on the rates will be published at 11:45 (GMT) of the decision on rates. At 12:30 a press conference will begin. ECB President Mario Draghi will give an assessment of the prospects for the European economy and monetary policy of the ECB and explain the decision of the ECB on rates.

Any hints of Mario Draghi on the approach of the start of the curtailment of the QE program in the Eurozone will cause the growth of the euro and the EUR / USD.

*)An advanced fundamental analysis is available on the Tifia Forex Broker website at tifia.com/analytics


Support levels: 1.1700, 1.1690, 1.1600, 1.1575, 1.1520, 1.1400, 1.1285

Resistance levels: 1.1740, 1.1750, 1.1790, 1.1850


Trading Scenarios


Sell Stop 1.1680. Stop-Loss 1.1760. Take-Profit 1.1600, 1.1575, 1.1520, 1.1400, 1.1285

Buy Stop 1.1760. Stop-Loss 1.1680. Take-Profit 1.1790, 1.1850

260718-_DXY.png


260718-_EU--_D.png


260718-_EU--_H4.png


*) For up-to-date and detailed analytics and news on the forex market visit Tifia Forex Broker website tifia.com
 
USD/JPY: SUPPORT AND RESISTANCE LEVELS

31/07/2018


The yen fell on Tuesday after the decision of the Bank of Japan to maintain its current monetary policy unchanged.

The Bank of Japan retained the key short-term rate at the level of -0.1% and the zero target level of 10-year government bonds yield.

A statement by the central bank of Japan said that the bank "intends to maintain current extremely low levels of short-term and long-term interest rates for an extended period".

The Bank of Japan reiterated that it wants to achieve the target inflation rate of 2% as soon as possible, although acknowledged that inflation will not reach the target level, at least until the end of 2021.

By the beginning of the US trading session, the USD / JPY rose 0.45% to 111.60.

The USD / JPY is rising in the upward channel on the daily chart, continuing to trade above the key support levels of 110.20 (the Fibonacci level 38.2% of the pair's correction since August last year and the level of 99.90), 110.00 (EMA200 and lower line of the ascending channel on the daily chart).

The further growth of USD / JPY with the nearest target at resistance level 113.10 (Fibonacci level 50% and maximums of the year) is probably. Long-term growth targets - the level of resistance 116.00 (Fibonacci level 61.8%), 118.60 (highs in January 2017).

The alternative scenario will be connected with breakdown of short-term support levels of 111.30 (EMA200 on the 1-hour chart), 111.00 (EMA200 on the 4-hour chart) and further decline to the support levels 110.20, 110.00.

Nevertheless, against the background of a different focus of monetary policies of the Fed and the Bank of Japan, the upward trend is predominant. Long positions are preferred.

*)An advanced fundamental analysis is available on the Tifia Forex Broker website at tifia.com/analytics


Support levels: 111.30, 111.00, 110.20, 110.00

Resistance levels: 112.00, 112.25, 113.10, 113.70, 114.00, 114.40, 115.00, 116.00


Trading Scenarios


Buy Stop 111.65. Stop Loss 111.20. Take-Profit 112.00, 112.25, 113.10, 113.70, 114.00, 114.40, 115.00, 116.00

Sell Stop 111.20. Stop Loss 111.65. Take-Profit 111.00, 110.20, 110.00

310718-ujd.png


310718-ujh4.png


310718-ujh1.png


*) For up-to-date and detailed analytics and news on the forex market visit Tifia Forex Broker website tifia.com
 
GBP/USD: Support and resistance levels

02/08/2018


From the middle of April and from the level of 1.4340, the GBP / USD fell sharply. The decrease to current levels was almost 10%. Starting in May, GBP / USD is traded in a downward channel on the daily chart, the lower limit of which is near the support level of 1.2900.

Below the nearest resistance levels 1.3213 (the Fibonacci level of 23.6% of the correction to the GBP / USD decline in the wave, which began in July 2014 near the level of 1.7200), 1.3248 (EMA50 and the upper limit of the descending channel on the daily chart), only short positions should be considered.

The negative dynamics is maintained, and if the decline continues, the 1.2900 mark will be the immediate target.

The further target of the decline is the level of 1.2590 (June 2017 lows).

The signal for corrective growth will be a confirmed short-term resistance level of 1.3127 (EMA200 on the 1-hour chart) breakdown. In this case, the corrective growth can continue to the resistance levels 1.3213, 1.3248.

Short positions are preferred, long-term bearish trend is maintained.

*)An advanced fundamental analysis is available on the Tifia Forex Broker website at tifia.com/analytics


Support levels: 1.3055, 1.3000, 1.2960, 1.2900

Resistance levels: 1.3127, 1.3213, 1.3248, 1.3335, 1.3445


Trading Scenarios


Sell in the market. Stop-Loss 1.3140. Take-Profit 1.3055, 1.3000, 1.2960, 1.2900

Buy Stop 1.3140. Stop-Loss 1.3090. Take-Profit 1.3213, 1.3248, 1.3335, 1.3445

020818-_GU---_D.png


020818-_GU---h1.png


*) For up-to-date and detailed analytics and news on the forex market visit Tifia Forex Broker website tifia.com
 
NZD/USD: Trading Scenarios on the eve of the RBNZ meeting

08/08/2018


Since mid-April, the NZD / USD has been trading in a downward channel, falling from the level of 0.7380. After the breakdown of the important support levels of 0.7240 (the Fibonacci level 38.2% of the upward correction to the global wave of decline of the pair from the level of 0.8800, which began in July 2014; the wave minimums are near the level of 0.6260), 0.7200 (EMA200 on the weekly chart) the NZD / USD decline accelerated. In July, NZD / USD reached multi-month lows near the 0.6690 mark. However, later, NZD / USD "fell into a drift", having spent July in the range between the levels of 0.6725, 0.6865 (Fibonacci level of 23.6%).

The negative trend persists, and NZD / USD is traded in the descending channel on the daily chart.

In case of breakdown of support levels of 0.6725, 0.6690 NZD / USD will target at May 2016 lows near the 0.6675 mark.

A signal for the development of an upward correction may be a breakdown of the short-term resistance level 0.6762 (EMA200 on a 1-hour chart). The correction target may be the level of resistance 0.6865 (Fibonacci level of 23.6% and the upper limit of the range formed in July). The strong negative dynamics prevails.

Indicators OsMA and Stochastics on the daily, weekly, monthly charts are on the side of sellers.

Below the resistance level 0.6865 short positions are preferred. The global downtrend, which began in July 2014, resumed.

Today at 22:00 (GMT) the decision of the RBNZ on the interest rate will be published. Probably, the interest rate will remain at the same level of 1.75%. If, during a press conference that starts at 11:00 pm (GMT), signals about the possibility of tightening monetary policy in the near future will sound, then the New Zealand dollar may strengthen, including against the US dollar. Nevertheless, the growth of NZD against the USD will be short-term.

*)An advanced fundamental analysis is available on the Tifia Forex Broker website at tifia.com/analytics


Support levels: 0.6725, 0.6700, 0.6690, 0.6675

Resistance levels: 0.6762, 0.6807, 0.6865, 0.6900, 0.6965, 0.7010


Trading Scenarios


Sell Stop 0.6720. Stop-Loss 0.6765. Take-Profit 0.6700, 0.6690, 0.6675, 0.6600

Buy Stop 0.6765. Stop-Loss 0.6720. Take-Profit 0.6805, 0.6865, 0.6900, 0.6965, 0.7010

080818-dxy.png


080818-_NU_dd.png


080818-_NU-h1.png


*) For up-to-date and detailed analytics and news on the forex market visit Tifia Forex Broker website tifia.com
 
WTI: Support and resistance levels

09/08/2018


After in July, the prices for WTI oil reached the next annual maximum near the mark of 73.85 dollars per barrel, later prices fell sharply.

As a result of a sharp decline on Wednesday, the price reached the first important support level of 65.87 (EMA144 on the daily chart).

If downward dynamics develop, the targets will be support levels of 65.50 (Fibonacci level 23.6% of the correction to the wave of growth, which began in June 2017 with a support level near the 42.00 mark), 64.15 (EMA200 on the daily chart).

Indicators OsMA and Stochastics on the 4-hour, daily, weekly, monthly charts are on the side of sellers.

The bullish trend persists until WTI oil trades above the key support level 64.15 (EMA200 on the daily chart).

In case of return to the zone above the resistance level of 68.50 (EMA200 on a 4-hour grafik, as well as EMA50 and the lower boundary of an ascending channel on the daily chart), the price increase will resume.

Support levels: 65.87, 65.50, 64.15, 63.00, 61.00

Resistance levels: 68.50, 69.50, 70.00, 72.80, 75.00


*)An advanced fundamental analysis is available on the Tifia Forex Broker website at tifia.com/analytics


Trading Scenarios

Sell Stop 65.70. Stop-Loss 66.80. Take-Profit 65.50, 64.15, 63.00, 61.00

Buy Stop 66.80. Stop-Loss 65.70. Take-Profit 68.50, 69.50, 70.00, 72.80, 75.00

090818-_WTI-_D.png


090818-_WTI-_H4.png


*) For up-to-date and detailed analytics and news on the forex market visit Tifia Forex Broker website tifia.com
 
AUD/USD: Prospects for AUD

14/08/2018


Prospects for AUD look negative against the US dollar.

The unfavorable external background (the intensification of international trade conflicts), as well as the different orientation of the monetary policies of the Fed and the RBA (economists believe that the RBA will not raise rates by the end of 2020), create fundamental prerequisites for further decline of the AUD / USD.

It is necessary to consider the possibility of entering into the short positions on AUD / USD.

This is best done by rolling back to the nearest resistance levels of 0.7290 (EMA200 on the 15-minute chart), 0.7320 (EMA200 on the 30-minute chart), 0.7350 (EMA200 on the 1-hour chart).

The immediate goal of the decline is the support level of 0.7155 (the lows of 2017 and May 2016).

The alternative scenario involves a breakdown of the resistance level of 0.7395 (EMA200 on the 4-hour chart) and the continuation of the growth to resistance levels of 0.7500 (minima of December), 0.7580 (EMA200 on the daily chart).

The downward global trend that began in July 2014 predominates. Short positions are preferred.

*)An advanced fundamental analysis is available on the Tifia Forex Broker website at tifia.com/analytics


Support levels: 0.7200, 0.7155, 0.7100

Resistance levels: 0.7290, 0.7320, 0.7355, 0.7395, 0.7500, 0.7580


Trading Scenarios


Sell in the market. Sell Limit 0.7290, 0.7320, 0.7350. Stop-Loss 0.7370. Take-Profit 0.7200, 0.7155, 0.7100

Buy Stop 0.7410. Stop-Loss 0.7370. Take-Profit 0.7500, 0.7580

140818-_AU-_W.png


140818-_AU---_D.png


140818-_AU-_H1.png


*) For up-to-date and detailed analytics and news on the forex market visit Tifia Forex Broker website tifia.com
 
XAU/USD: Support and resistance levels

16/08/2018


Since mid-April, XAU / USD is trading in a downtrend. Below the key resistance level of 1277.00 (EMA200 on the daily chart and the Fibonacci level of 61.8%) is dominated by a downward trend.

On Thursday, the pair XAU / USD moved into the corrective phase, consolidating to the nearest resistance level at 1185.00 (Fibonacci level of 23.6% of the correction to the wave of decline since July 2016).

The signal for buying and developing an alternative scenario will be a breakdown of the short-term resistance level 1200.00 (EMA200 on the 1-hour chart). In this case, corrective growth can last up to resistance level 1220.00 (EMA200 on the 4-hour chart and Fibonacci level of 38.2%). Below this level, sales look safe.

Short positions are preferred. The XAU / USD on Wednesday broke the last strong support level at 1185.00 (the Fibonacci level 23.6% of the correction to the wave of decline since July 2016).

The breakdown of the support level of 1185.00 (the Fibonacci level of 23.6%) could mean the return of XAU / USD to the global downtrend, which began in October 2012.

*)An advanced fundamental analysis is available on the Tifia Forex Broker website at tifia.com/analytics


Support levels: 1175.00, 1160.00, 1128.00

Resistance levels: 1185.00, 1200.00, 1220.00, 1237.00, 1248.00, 1268.00, 1277.00


Trading Scenarios


Sell Stop 1174.00. Stop-Loss 1186.00. Take-Profit 1170.00, 1160.00, 1120.00, 1128.00

Buy Stop 1186.00. Stop-Loss 1174.00. Take-Profit 1200.00, 1220.00, 1237.00, 1248.00, 1268.00, 1277.00


160818-dxy.png


160818-_XU---_D.png


160818-_XU-_H1.png


*) For up-to-date and detailed analytics and news on the forex market visit Tifia Forex Broker website tifia.com
 
AUD/USD: Support and resistance levels

20/08/2018


The different focus of monetary policy of central banks in the US and Australia will be the main most important long-term factor in favor of weakening the AUD / USD pair.

Since the beginning of the year, the AUD / USD has been actively declining. AUD / USD develops a downward trend, trading in the downward channel on the daily chart, the lower limit of which near the support level of 0.7155 passes.

Indicators OsMA and Stochastics on long-term periods (weekly and monthly) indicate short positions.

In case of further decrease in AUD / USD, the targets will be support levels of 0.7235 (August lows), 0.7155 (the bottom line of the descending channel on the daily chart). Only in case of the return of AUD / USD to the zone above the key resistance level of 0.7570 (EMA200 on the daily chart) long-term long positions can be considered with targets at the levels of 0.7820 (EMA200 on the weekly chart and Fibonacci level of 23.6% of the correction to the fall wave from August 2011 year and level 1.1030. The minimum of this wave is near the level of 0.6830). The signal for purchases may be a breakdown of the short-term resistance level 0.7370 (EMA200 on the 4-hour chart). So far, negative dynamics prevails. Short positions are preferred. The immediate goal of the decline is the support level of 0.7235 (the lows of the year and August). The AUD / USD is returning to the global downtrend, which began in August 2011.

*)An advanced fundamental analysis is available on the Tifia Forex Broker website at tifia.com/analytics


Support levels: 0.7300, 0.7235, 0.7200, 0.7155, 0.7100

Resistance levels: 0.7320, 0.7350, 0.7370, 0.7500, 0.7570


Trading Scenarios


Sell Stop 0.7290. Stop-Loss 0.7330. Take-Profit 0.7235, 0.7200, 0.7155, 0.7100

Buy Stop 0.7330. Stop-Loss 0.7290. Take-Profit 0.7350, 0.7370, 0.7500, 0.7570

200818-_AU---_D.png


200818-_AU---_H1.png


*) For up-to-date and detailed analytics and news on the forex market visit Tifia Forex Broker website tifia.com
 
DJIA: stock markets are growing

21/08/2018

Current situation


US and world stock indexes continue to grow. Investors were encouraged by reports of the resumption of negotiations between the US and China with a view to resolving the trade conflict between the countries. Market participants also expect that strong US economic data and financial results of companies will continue to support the indices.

DJIA rose on Monday by 0.3%, to 25758.69 points, the highest level of closure since February 1. S&P500 added 0.2%, reaching 2857.05 points, which is 0.6% lower than the January record. Nasdaq Composite increased by 0.1%, to 7821.01 points. All three major US indices are growing on Tuesday for 4 consecutive days.

The main risk for the economy and the stock market at the moment are trade conflicts. As they weaken, the growth of US stock indices is likely to accelerate.

*)An advanced fundamental analysis is available on the Tifia Forex Broker website at tifia.com/analytics


Support and resistance levels

DJIA retains positive dynamics, trading in the ascending channels on the daily and weekly charts. Above the short-term support level of 25260.0 (EMA200 on the 4-hour chart and the bottom line of the rising channel on the daily chart), only long positions should be considered.

The breakdown of the support level of 25260.0 may provoke a deeper correction decrease to the key support levels 24775.0 (EMA144 on the daily chart), 24450.0 (EMA200 on the daily chart). Near these levels also passes the bottom line of the rising channel on the weekly chart.

In general, the positive dynamics remains. Only the breakdown of the support level of 24050.0 (the Fibonacci retracement level of 23.6% of the correction to the growth from the level of 15650.0 in the wave that began in January 2016. The maximum of this wave and the 0% Fibonacci level are near the 26620.0 mark) may call into question the DJIA's bullish trend.

DJIA is growing, heading toward resistance level 26620.0 (absolute and annual highs).

Support levels: 25670.0, 25260.0, 25000.0, 24775.0, 24450.0, 24050.0

Resistance levels: 26000.0, 26200.0, 26620.0


Trading Scenarios


Buy in the market. Stop-Loss 25650.0. Take-Profit 26200.0, 26620.0

Sell Stop 25650.0. Stop-Loss 25800.0. Take-Profit 25260.0, 25000.0, 24775.0, 24450.0

210818-_DJIA-_D.png


210818-_DJIA-h4.png


210818-_DJIA-_W.png


*) For up-to-date and detailed analytics and news on the forex market visit Tifia Forex Broker website tifia.com
 
NZD/USD: Support and resistance levels

24/08/2018


Since mid-April, the NZD / USD has been trading in a downward channel, falling from the level of 0.7380. In August, NZD / USD reached multi-month lows near the 0.6548 mark. The negative trend persists, and NZD / USD is traded in the descending channel on the daily chart.

In the event of a breakdown of the support level of 0.6548, NZD / USD will target at lows 2015 near the 0.6260 mark.

The objective of the upward correction after the breakdown of the resistance level 0.6715 (EMA200 on the 4-hour chart) may be the resistance level of 0.6865 (Fibonacci level of 23.6% of the upward correction to the global wave of the pair's decline from the level of 0.8800, which began in July 2014, level of 0.6260 and the upper limit of the range formed in July).

The prevailing negative dynamics. Short positions are preferred. The global downtrend, which began in July 2014, resumed.

Investors are preparing for the speech of Federal Reserve Chairman Jerome Powell at a symposium in Jackson Hole on Friday (14:00 GMT). Investors are interested in Powell's opinion about the growing US-China trade confrontation and the prospects for the monetary policy of the Fed.

*)An advanced fundamental analysis is available on the Tifia Forex Broker website at tifia.com/analytics


Support levels: 0.6600, 0.6548, 0.6500, 0.6410

Resistance levels: 0.6650, 0.6715, 0.6750, 0.6865, 0.6900, 0.6965


Trading Scenarios


Sell Stop 0.6620. Stop-Loss 0.6665. Take-Profit 0.6600, 0.6548, 0.6500, 0.6410

Buy Stop 0.6665. Stop-Loss 0.6620. Take-Profit 0.6715, 0.6750, 0.6865, 0.6900, 0.6965


240818-_NU-_D.png


240818-_NU-h4.png


*) For up-to-date and detailed analytics and news on the forex market visit Tifia Forex Broker website tifia.com
 
DJIA: stock markets are growing

28/08/2018

Current situation


US and world stock indexes continue to grow. Investors were encouraged by reports that the US and Mexico were approaching the conclusion of a treaty on the revision of the North American Free Trade Agreement (NAFTA), ignoring the possibility of excluding Canada from the trade union.

On the eve of Nasdaq, in which the technological sector has a lot of weight, for the first time overcame the mark of 8,000 points. The S&P 500 also reached new absolute record levels.

DJIA rose from the beginning of the week by 1.16% to 26105.0, the mark at which it traded at the beginning of the European session on Tuesday.

All three major US indices are growing on Tuesday for 3 consecutive days after Friday, Fed Chairman Jerome Powell said that the gradual increase in interest rates remains appropriate. However, Powell did not signal that the central bank will accelerate rates of rate hikes in the coming months. He said that the Fed plans to raise rates to a level that will neither stimulate nor slow economic growth.

The main risk for the economy and the stock market at the moment are trade conflicts. As they weaken, the growth of US stock indices is likely to accelerate.

*)An advanced fundamental analysis is available on the Tifia Forex Broker website at tifia.com/analytics


Support and resistance levels

DJIA retains positive dynamics, trading in the ascending channels on the daily and weekly charts. Above the short-term support level 25420.0 (EMA200 on the 4-hour chart and the bottom line of the upward channel on the daily chart), only long positions should be considered.

The breakdown of the support level of 25420.0 may provoke a deeper correction decrease to the key support levels of 24830.0 (EMA144 on the daily chart), 24530.0 (EMA200 on the daily chart). Near these levels also passes the bottom line of the rising channel on the weekly chart.

In general, the positive dynamics remains. Only the breakdown of the support level of 24050.0 (Fibonacci level of 23.6% of the correction to the increase with the level of 15650.0 in a wave that began in January 2016. The maximum of the wave and Fibonacci level of 0% are near the mark 26620.0) could jeopardize the bullish trend of the DJIA.

DJIA is growing, heading toward resistance level 26620.0 (absolute and annual highs).

Support levels: 26000.0, 25750.0, 25420.0, 25000.0, 24830.0, 24530.0, 24050.0

Resistance levels: 26200.0, 26620.0


Trading Scenarios


Buy in the market. Stop-Loss 26000.0. Take-Profit 26200.0, 26620.0

Sell Stop 26000.0. Stop-Loss 26140.0. Take-Profit 25750.0, 25420.0, 25000.0, 24830.0, 24530.0, 24050.0

280818-_DJIA-_W.png


280818-_DJIA-_D.png


280818-_DJIA-_H4.png


*) For up-to-date and detailed analytics and news on the forex market visit Tifia Forex Broker website tifia.com
 
USD/CAD: Support and resistance levels

30/08/2018


The USD / CAD keeps the medium-term negative dynamics, trading in the downward channel on the daily chart. At the same time, USD / CAD remains in the upward channel on the weekly chart, the upper limit of which passes near the resistance level 1.3600 (the highs of November, December 2016).

While USD / CAD is trading above the important support level of 1.2930 (200-period moving average on the daily chart), long-term positive dynamics remain.

In the vicinity of this support level 1.2930, the bottom line of the upward channel and EMA50 on the weekly chart also pass.

Thus, the support level of 1.2930 is the key.

In case of its breakdown, USD / CAD will go to support levels 1.2800 (EMA144 on the weekly chart), 1.2740 (Fibonacci level 38.2% of the downward correction to the pair's growth in the global uptrend from September 2012 and the 0.9700 mark).

The breakdown of the support level 1.2625 (EMA200 on the weekly chart) raises the risks of the final breakdown of the bullish USD / CAD trend.

The growth scenario is related to the breakdown of the resistance level 1.3050 (EMA200 on the 4-hour chart) and the resumption of positive dynamics within the rising channel on the weekly chart. The first signal for purchases will be the breakdown of the nearest short-term resistance level of 1.2995 (EMA200 on the 1-hour chart).

*)An advanced fundamental analysis is available on the Tifia Forex Broker website at tifia.com/analytics


Support levels: 1.2930, 1.2900, 1.2800, 1.2740, 1.2625

Resistance levels: 1.2995, 1.3050, 1.3130, 1.3200, 1.3285, 1.3380, 1.3450


Trading Scenarios


Sell Stop 1.2890. Stop-Loss 1.2945. Take-Profit 1.2800, 1.2740, 1.2625

Buy Stop 1.2945. Stop-Loss 1.2890. Take-Profit 1.2995, 1.3050, 1.3130, 1.3200, 1.3285, 1.3380, 1.3450


300818-_UC---_W.png


300818-_UC---_D.png


300818-_UC---_H4.png


*) For up-to-date and detailed analytics and news on the forex market visit Tifia Forex Broker website tifia.com
 
USD/CAD: Support and resistance levels

04/09/2018


On Wednesday (14:00 GMT) the Bank of Canada decision on rates will be published. It is likely that in the face of the unresolved issue on NAFTA, the Bank of Canada is unlikely to decide to change its monetary policy. The interest rate is likely to remain at 1.50%.

On Tuesday, USD / CAD broke the upper limit of the downward channel on the daily chart, thus breaking the medium-term negative dynamics.

Indicators OsMA and Stochastics on the 4-hour, daily, weekly charts went to the side of buyers.

Above the short-term support level 1.3055 (EMA200 on the 4-hour chart, EMA50 on the daily chart) long positions are preferred.

In general, long-term upward dynamics persist, and USD / CAD is rising in the upward channel on the weekly chart, the upper limit of which is near the resistance level 1.3600 (highs of November, December 2016).

The support level of 1.2930 (200-period moving average on the daily chart) is the key, long-term positive dynamics remain above it.

Long positions are relevant.

The first signal for the development of an alternative scenario may be a decline to a zone below the 1.3112 mark, through which the upper limit of the descending channel on the daily chart passes. The breakdown of the support level 1.3055 will confirm this scenario.

However, only the breakdown of the support level 1.2625 (EMA200 on the weekly chart) will signal a final break of the bullish USD / CAD trend.

*)An advanced fundamental analysis is available on the Tifia Forex Broker website at tifia.com/analytics


Support levels: 1.3112, 1.3100, 1.3055, 1.2970, 1.2930, 1.2900

Resistance levels: 1.3175, 1.3200, 1.3285, 1.3380, 1.3450


Trading Scenarios


Sell Stop 1.3080. Stop-Loss 1.3160. Take-Profit 1.3055, 1.2970, 1.2930, 1.2900

Buy Stop 1.3160. Stop-Loss 1.3080. Take-Profit 1.3175, 1.3200, 1.3285, 1.3380, 1.3450


040918-dxy.png


040918-_UC--_D.png


040918-_UC--_H4.png


*) For up-to-date and detailed analytics and news on the forex market visit Tifia Forex Broker website tifia.com
 
GBP/USD: on the eve of the meeting of the Bank of England

11/09/2018

Current dynamics


The US dollar declined on Monday. The driver of its decline was the message that the UK and the EU have made progress on Brexit negotiations.

The EU's chief negotiator for Brexit, Michel Barnier, said that an agreement with the UK could be reached in the next six to eight weeks. In response to this message, the pound rose sharply, including against the dollar, carrying with it other currencies, primarily European ones.

On Tuesday, with the opening of the trading day, the decline in the dollar continued. However, closer to the beginning of the US trading session, the decline in the dollar slowed, and the dollar index DXY, which tracks the rate of the US currency against the basket of 6 other major currencies, shifted to positive territory near 95.20, 6 points higher than the opening level of the trading day.

This week, investors will follow the meeting of the Bank of England, which will be held on Thursday September 13, and at 11:00 (GMT) will publish the decision on the interest rate. It is expected that the rate will remain at the same level of 0.75%. Economists believe that the next rate increase will occur no earlier than May next year.

The main risks for the UK after Brexit are associated with expectations of a slowdown in the country's economic growth, as well as a large current account deficit in the UK's balance of payments.

Meanwhile, the Fed is likely to continue tightening monetary policy. As Federal Reserve President Boston Rosengren said in an interview with the WSJ on Monday, "The US economy has good performance, and there is no need to slow or accelerate the current rate of quarterly rate increases". Rosengren sees no reason to pause the rate hike until economic growth and inflation slows. And this means, in his opinion, the Fed will raise the rate this year 2 more times. This is a bullish factor for the dollar.

*)An advanced fundamental analysis is available on the Tifia Forex Broker website at tifia.com/analytics


Support and resistance levels

Since the beginning of the week, the GBP / USD pair has grown amid reports of the possibility of a favorable outcome of the Brexit talks. At the beginning of the European session on Tuesday, GBP / USD was trading near the 1.3085 mark. However, in the future, GBP / USD moved to negative territory, trading closer to the opening of the US trading session near the mark of 1.3015.

Starting in May, GBP / USD is traded in a downward channel on the daily chart, the lower limit of which is near 1.2300.

Corrective growth may continue to resistance levels 1.3215 (Fibonacci retracement level of 23.6% of the correction to the GBP / USD decline in the wave, which began in July 2014 near the level of 1.7200), 1.3300 (EMA200 on the daily chart).

Nevertheless, short positions are preferable, a long bearish trend persists, and the GBP / USD pair may fall towards the August and annual lows near the support level of 1.2670, and 1.2365 mark, through which the lower border of the descending channel on the weekly chart is passing.

[b] Support levels: 1.3000, 1.2910, 1.2800, 1.2670, 1.2590, 1.2365

Resistance levels: 1.3085, 1.3100, 1.3215, 1.3300


Trading Scenarios [/b]

Sell Stop 1.2990. Stop-Loss 1.3050. Take-Profit 1.2910, 1.2800, 1.2670, 1.2590, 1.2365

Buy Stop 1.3050. Stop-Loss 1.2990. Take-Profit 1.3100, 1.3215, 1.3300


110918-_GU-_D.png


110918-_GU-_H4.png


*) For up-to-date and detailed analytics and news on the forex market visit Tifia Forex Broker website tifia.com
 
WTI: oil and oil products stocks rose

12/09/2018

Current dynamics


As the American Petroleum Institute (API) reported late Tuesday, oil and oil products stocks fell 8.636 million barrels last week. On the eve of oil prices have been growing on reports of riots in Libya and in connection with the hurricane Florence approaching to the US.

After the publication of the API data, the growth of oil quotes increased.

As a result, a barrel of oil WTI worth at the end of the trading day on Tuesday 69.66 dollars. Since the opening of the trading day on Wednesday, oil prices have remained almost unchanged, and investors are waiting for the publication (at 14:30 GMT) of weekly official data on US stocks from the Energy Ministry of this country. It is expected to reduce inventories by 0.805 million barrels, which should positively affect oil prices.

*)An advanced fundamental analysis is available on the Tifia Forex Broker website at tifia.com/analytics


Support and resistance levels

The price of WTI crude oil remains in an upward trend. While the price is above the key support levels of 66.35 (Fibonacci level of 23.6% of the correction to the wave of growth, which began in June 2017 with the support level near the 42.00 mark), 64.80 (EMA200 and the bottom line of the upward channel on the daily chart), long-term upward dynamics persist .

The nearest growth target is 71.00 (highs of August), through which the upper line of the ascending channel on the daily chart passes.

Support levels: 68.10, 67.00, 66.35, 64.80, 64.15

Resistance levels: 70.00, 71.00, 72.80, 73.85


Trading Scenarios


Sell Stop 68.90. Stop-Loss 70.10. Take-Profit 68.10, 67.00, 66.35, 64.80, 64.15

Buy Stop 70.10. Stop-Loss 68.90. Take-Profit 71.00, 72.80, 73.85


120918-wti-d.png


120918-wti-h4.png


*) For up-to-date and detailed analytics and news on the forex market visit Tifia Forex Broker website tifia.com
 
EUR/USD: Technical Analysis

14/09/2018


Since April 2018, EUR / USD remains within the descending channel on a weekly chart, the lower limit of which is close to the support level of 1.1150. However, at the moment the upward correction continues.

On Thursday, the European Central Bank retained the key interest rate at 0%, and on deposits - at the level of -0.40%. The ECB confirmed its intention to keep interest rates unchanged until the summer of 2019 and lowered its forecasts for GDP growth for 2018 and 2019, from 2.1% to 2.0% and from 1.9% to 1.8%, respectively.

Nevertheless, EUR / USD rose against the background of publication (at 12: 30 GMT) of weak inflationary indicators of the USA.

The dollar index DXY also trades lower, at 94.45 against 94.56 at the opening of the trading day, and EUR / USD at the beginning of the European trading session is trading slightly above the 1.1700 mark.

In case of breakdown of the local resistance level 1.1730 (August highs and EMA200 on the weekly chart), EUR / USD is likely to grow to resistance levels 1.1770 (EMA200 on the daily chart), 1.1790 (Fibonacci level 38.2% of the correction to the fall from the level of 1.3900, which began in May 2014). However, above the resistance level 1.1790, growth is unlikely.

The key interest rate of the Fed is in the range of 1.75% -2% and it will be much higher than the ECB rate by the time the ECB starts its policy tightening cycle.

The difference between interest rates in the US is an important fundamental factor in favor of dollar purchases against the euro.

The breakdown of the important support levels 1.1625 (EMA50 on the daily chart), 1.1605 (EMA200 on the 4-hour chart) will open the way for further decline with a long target at the support level of 1.1150 (the lower boundary of the descending channel on the weekly chart).

*)An advanced fundamental analysis is available on the Tifia Forex Broker website at tifia.com/analytics


Support levels: 1.1660, 1.1625, 1.1605, 1.1535, 1.1510, 1.1400, 1.1345, 1.1285, 1.1150

Resistance levels: 1.1730, 1.1770, 1.1790


Trading Scenarios


Sell Stop 1.1650. Stop-Loss 1.1740. Take-Profit 1.1625, 1.1605, 1.1535, 1.1510, 1.1400, 1.1345, 1.1285, 1.1150

Buy Stop 1.1740. Stop-Loss 1.1650. Take-Profit 1.1770, 1.1790

140918-_EU-_W.png


140918-_EU--_D.png


140918-_EU--_H4.png


*) For up-to-date and detailed analytics and news on the forex market visit Tifia Forex Broker website tifia.com
 
GBP/USD: Brexit will remain the focus of attention

18/09/2018


US President Donald Trump on Monday said that the United States for many years had suffered huge losses in foreign trade, and can not continue like this.

As it became known, the administration of the US President Donald Trump intends to introduce new duties on goods from China worth a total of $ 200 billion. The new tariffs will come into force on September 24 and will be 10%, and by the end of the year they will be raised to 25%. The Chinese authorities reported that they will introduce reciprocal duties on American imports.

European currencies reacted quite restrainedly to this news, as it did not become unexpected.

Last week, the Bank of England kept the interest rate at 0.75%. In the Bank of England's reports, it was noted that Brexit remains the key risk to the British economy. News on Brexit will continue to be in the center of attention of market participants and most strongly influence the dynamics of the pound.

*)An advanced fundamental analysis is available on the Tifia Forex Broker website at tifia.com/analytics


Support and resistance levels

The GBP / USD pair is declining at the beginning of the European trading session, but continues to trade above 1.3100, near the upper line of the rising channel on the daily chart.

Since mid-August, GBP / USD has been developing an upward trend, which can be described as a correction after months of decline. The growth may continue to the levels of resistance 1.3215 (Fibonacci level 23.6% of the correction to the fall of the GBP / USD in the wave, which began in July 2014 near the level of 1.7200), 1.3300 (EMA200 on the daily chart).

Nevertheless, the long-term bearish trend persists, and the GBP / USD pair may decline towards the August and annual lows near the support level of 1.2670 and the lower boundary of the downward channel on the weekly chart passing through the 1.2365 mark.

The breakdown of the local support level 1.3055 will be a signal to resume the decline.

Support levels: 1.3085, 1.3055, 1.3000, 1.2985, 1.2800, 1.2670, 1.2590, 1.2365, 1.2110, 1.2000

Resistance levels: 1.3200, 1.3215, 1.3300


Trading Scenarios


Sell Stop 1.3050. Stop-Loss 1.3175. Take-Profit 1.3000, 1.2974, 1.2800, 1.2670, 1.2590, 1.2365, 1.2110, 1.2000

Buy Stop 1.3175. Stop-Loss 1.3050. Take-Profit 1.3200, 1.3215, 1.3300


180918-_GU--_D.png


180918-_GU--_W.png


*) For up-to-date and detailed analytics and news on the forex market visit Tifia Forex Broker website tifia.com
 
XAU/USD: the price of gold rose against the background of a weakening dollar

21/09/2018

Current dynamics


Prices for gold increased by $ 3 to $ 1277.00 per troy ounce on Thursday. The sale of the dollar and its weakening contributed to higher prices for commodities and precious metals.

On Friday, during the Asian and early European sessions, the dollar's decline continued, however, closer to the beginning of the US trading session, the dollar moved to a positive territory.

The dollar index DXY, which tracks the rate of the US currency against the basket of 6 other major currencies, after rising sharply on Thursday to the June 2018 mark, is growing on Friday at the beginning of the US trading session near the 93.61 mark.

The pair XAU / USD also declines after rising yesterday. At the same time, XAU / USD continues to trade in the range between resistance levels 1212.00 (EMA50 on the daily chart) and 1185.00 (Fibonacci level 23.6% of the correction to the wave of decline since July 2016), pending the meeting of the Federal Reserve System, which will take place at the next week (September 25 - 26) to assess the prospects for the monetary policy of the Fed. With an increase in the Fed's interest rate, the price of gold usually falls.

The overall trend of XAU / USD, still remains bearish. Another test of the resistance level 1212.00 (EMA50 on the daily chart) is possible. However, further growth is unlikely, unless, of course, the dollar will not resume a decline.

Investors take into account the 100% probability of an increase in the Fed's interest rate in September. In conditions of an increase in the interest rate, the investment attractiveness of the dollar is growing, and gold is falling.

*)An advanced fundamental analysis is available on the Tifia Forex Broker website at tifia.com/analytics


Support and resistance levels

Since mid-April, XAU / USD is trading in a downward channel on the daily chart, the lower limit of which is near the support level of 1128.00 (the low of 2016).

Below the key resistance level of 1259.00 (EMA200 on the daily chart), the downside dynamics prevails.

The breakdown of the support level of 1185.00 (the Fibonacci level 23.6% of the correction to the wave of decline since July 2016) will confirm the return of XAU / USD to the global downtrend that began in October 2012.

The signal for medium-term purchases and the development of an alternative scenario will be a breakdown of the resistance level at 1212.00. In this case, the corrective growth can last up to resistance level 1220.00 (Fibonacci level 38.2%). Short positions are preferred below this level.

Support levels: 1200.00, 1198.00, 1185.00, 1175.00, 1160.00, 1128.00

Levels of resistance: 1212.00, 1220.00, 1237.00, 1248.00, 1259.00, 1266.00, 1277.00


Trading Scenarios


Sell Stop 1206.00. Stop-Loss 1213.00. Take-Profit 1200.00, 1198.00, 1185.00, 1175.00, 1160.00, 1128.00

Buy Stop 1213.00. Stop-loss 1206.00. Take-Profit 1220.00, 1225.00, 1237.00, 1248.00, 1259.00, 1266.00


210918-_DXY.png


210918-_XU-w.png


210918-_XU-_D.png


*) For up-to-date and detailed analytics and news on the forex market visit Tifia Forex Broker website tifia.com
 
NZD/USD: market expectations in connection with the meetings of the Fed and the RBNZ

25/09/2018

Current dynamics


On Wednesday, the two largest world central banks will hold meetings and decide on the interest rate. The Federal Reserve's decision on the interest rate will be published at 18:00 (GMT). It is widely expected that the rate will be increased by 0.25% to 2.25%, and this increase is already included in the price. Investors are more interested in the press conference and the opinion of Federal Reserve Chairman Powell on the prospects for monetary policy for 2019.

If Powell signals about the possibility of a faster increase in the interest rate, this will cause the dollar to strengthen and the US stock markets fall. Any hint of Powell that the Fed can pause, will bring down the dollar.

On the part of the RB of New Zealand, investors do not expect a change in the current monetary policy, despite strong macro data published last week. As the Bureau of Statistics of New Zealand reported, the country's GDP grew by 1.0% in the second quarter or by 2.8% in annual terms (the forecast was + 0.8% and + 2.5%, respectively). The pace of economic growth exceeded the expectations of the central bank by two times.

Moreover, the comments of the bank may indicate the possibility of lowering interest rates if economic growth does not accelerate. Probably, the head of RBNZ Adrian Orr will once again confirm the bank's desire to pursue a soft monetary policy, which will lead to pressure on the New Zealand currency. In any case, the volatility in the New Zealand dollar trade is expected to grow during the RBNZ press conference, which will begin on Wednesday at 22:00 (GMT).

The different focus of monetary policy in the US and New Zealand will further increase the difference between interest rates in the US and New Zealand. And this is the main fundamental factor for further reduction of NZD / USD. The main global trend of the pair NZD / USD, is still bearish.

*)An advanced fundamental analysis is available on the Tifia Forex Broker website at tifia.com/analytics


Trading scenarios

On Thursday, the NZD / USD attempted a breakdown of a strong resistance level of 0.6668 (EMA50 on the daily chart). Nevertheless, the breakdown of this level turned out to be false, and NZD / USD again declines, heading down the descending channel on the daily chart. Its lower limit passes below the local support level of 0.6505 (the lows of the year and September).

A confirmation of the resumption of the main scenario is the breakdown of the short-term support levels 0.6638 (EMA200 on the 4-hour chart), 0.6627 (EMA200 on the 1-hour chart).

A signal for the development of an upward correction may be a breakdown of the local resistance level of 0.6700. The correction target can be resistance levels of 0.6725, 0.6740. Long-term growth targets are resistance levels of 0.6865 (Fibonacci level 23.6% of the upward correction to the global wave of the pair's decline from the level of 0.8800, which began in July 2014; the minimums of the wave are near 0.6260), 0.6900 (EMA200 on the daily chart).

Nevertheless, short positions are preferable.

Support levels: 0.6638, 0.6627, 0.6600, 0.6585, 0.6505, 0.6410

Resistance levels: 0.6700, 0.6725, 0.6740, 0.6800, 0.6865, 0.6900


Trading Scenarios


Sell Stop 0.6625. Stop-Loss 0.6670. Take-Profit 0.6600, 0.6585, 0.6505, 0.6410

Buy Stop 0.6670. Stop-Loss 0.6625. Take-Profit 0.6700, 0.6725, 0.6740, 0.6800, 0.6865, 0.6900

250918-_NU-_D.png


250918-_NU-_H4.png


*) For up-to-date and detailed analytics and news on the forex market visit Tifia Forex Broker website tifia.com
 
Top