• The Forex, Binary Options Forum - welcomes you to our Community!

    DigitalCashPalace Forum is dedicated to discussions about Forex, Binary Options, commodities, stocks related.

    Please take a look around, and feel free to .

Technical Analysis by IFC Markets

IFCMarkets

Broker Representative
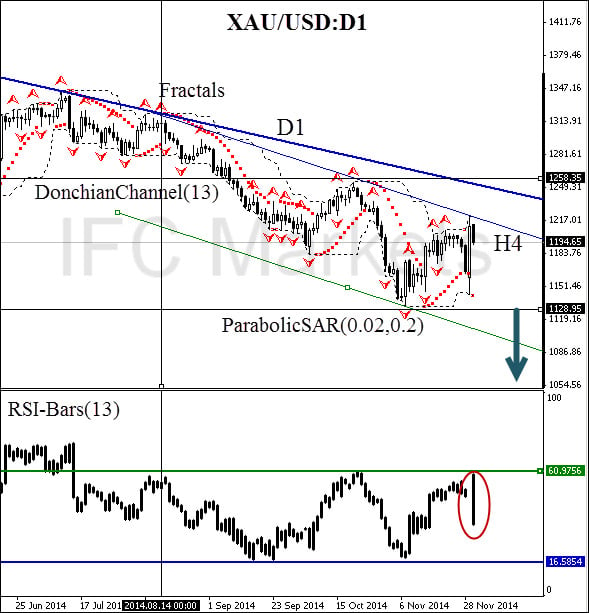
The fallen oil futures prices after the OPEC meeting resulted in a significant depreciation of commodity currencies against the US dollar: it was in favour of USD and led to a significant strengthening of the dollar index. Today at 14:00 CET we expect the monthly release of ISM Manufacturing PMI in the United States. This diffusion index is based on a survey of 400 purchasing managers in the manufacturing industry, which evaluate employment, output volume, orders and stockpiles. It is the most important economic indicator as it permits obtaining preliminary information on manufacturing activity which affects the investor optimism. In our opinion, the greatest volatility is expected today from the US currency relative to other liquid instruments of the currency market.

TA-01-12-2014-1.png


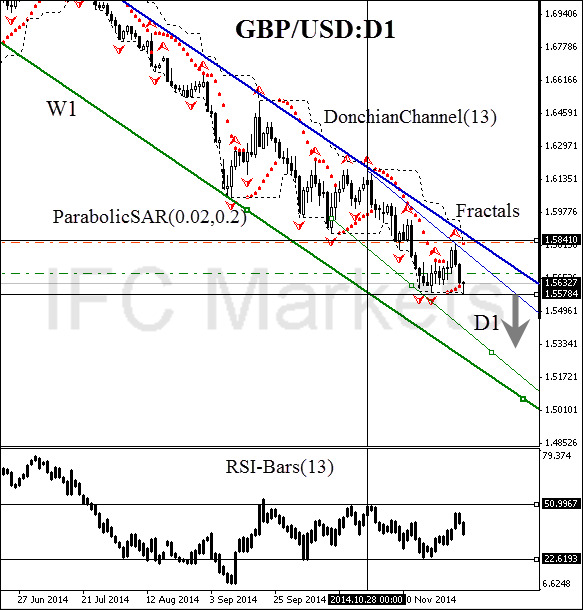
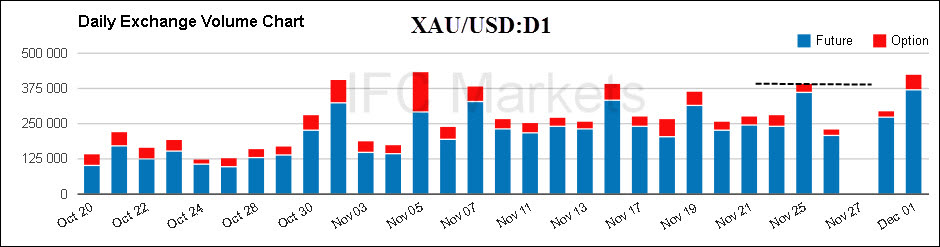
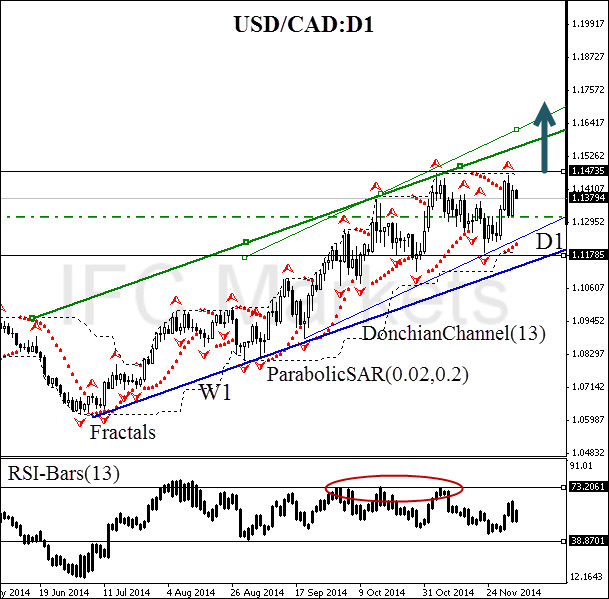
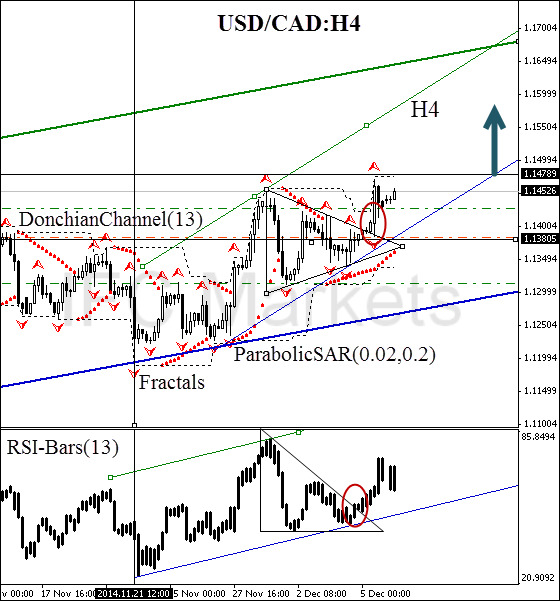
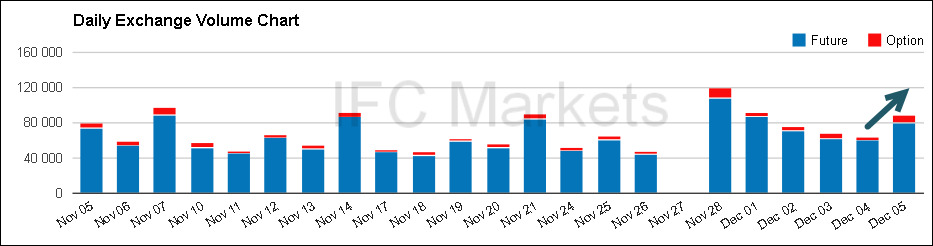
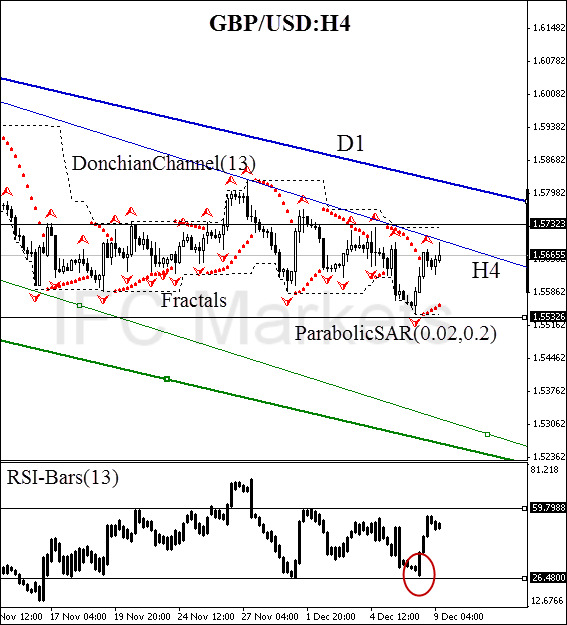
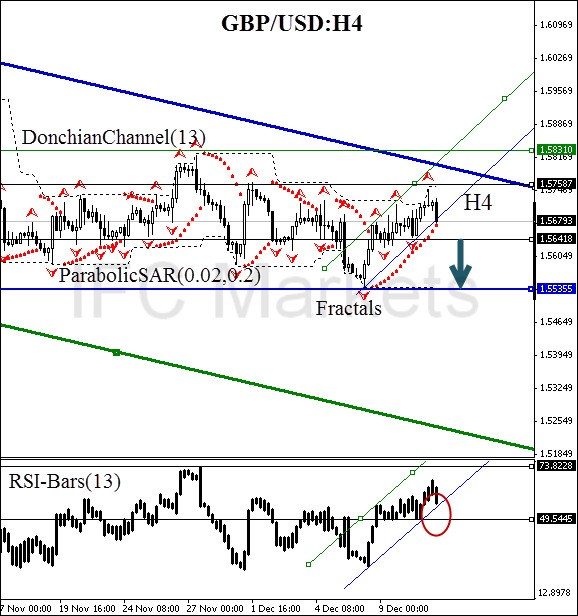
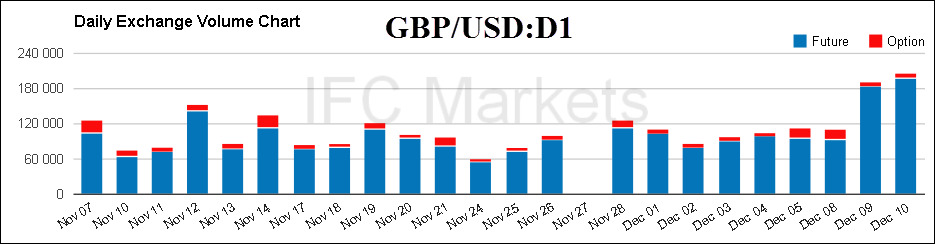
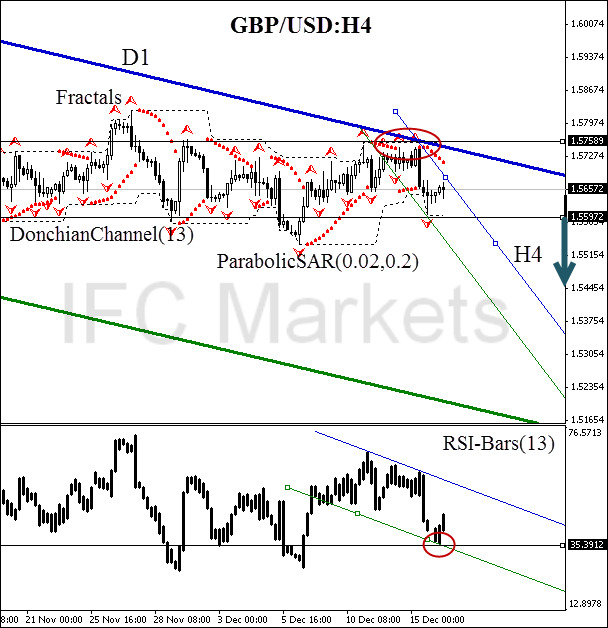
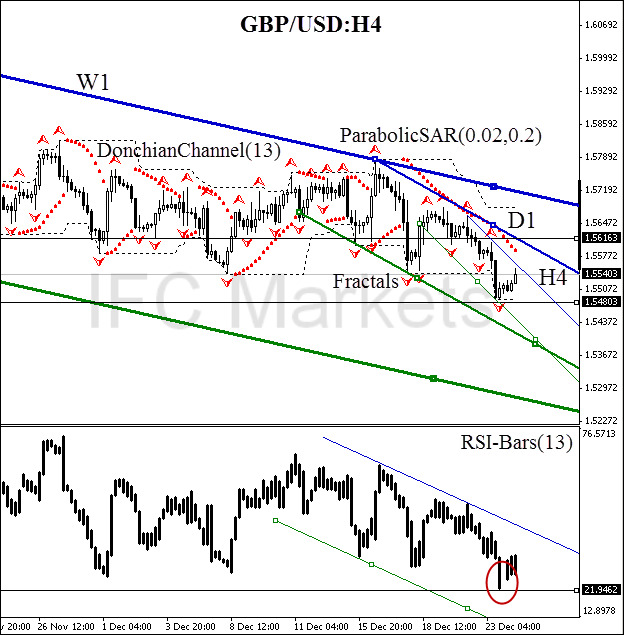
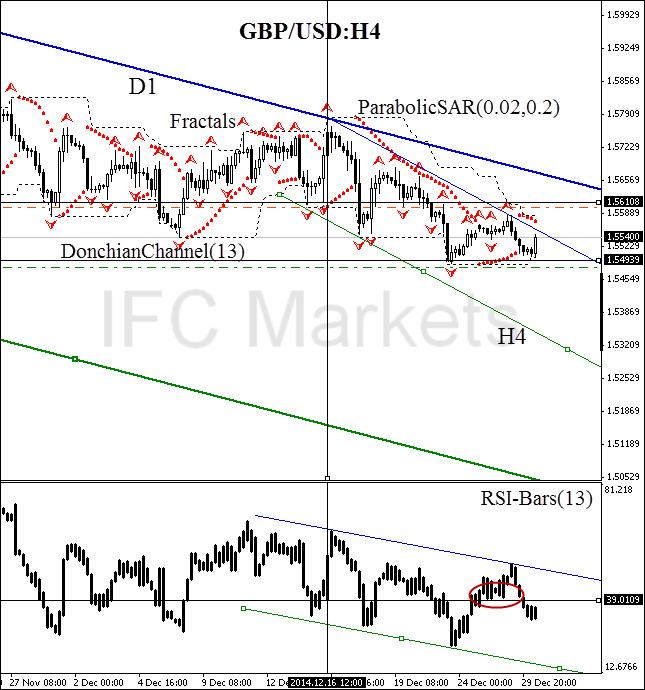
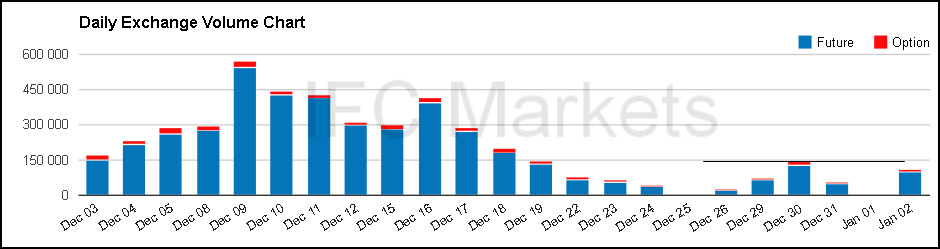
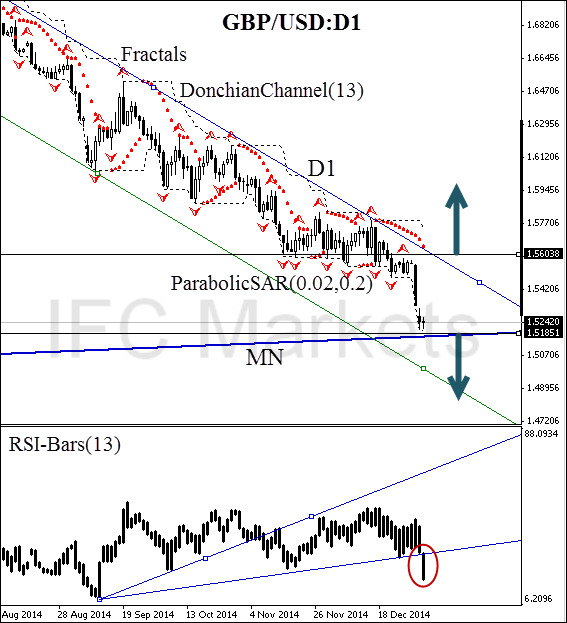
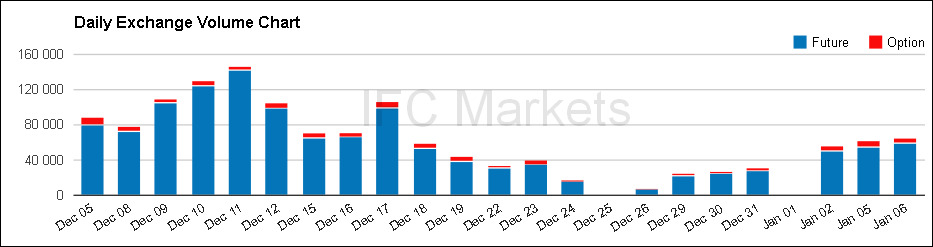
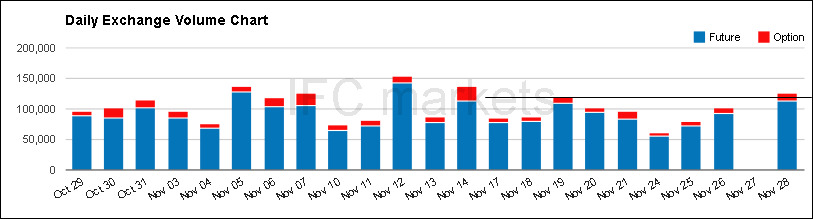
Here we consider the GBP/USD currency pair on the D1 chart. The price is preparing to move in the direction of the red zone, as evidenced by the Parabolic reversal. The fractal resistance level at 1.58410 is crossing the daily bearish trend line, which makes this mark suitable for reliable risk mitigation of a short position. This level is also confirmed by the upper Donchian Channel boundary. A pending sell order can be placed below 1.55784, which is confirmed by Parabolic historical values and the Bill Williams fractal. Conservative traders are recommended to look for the RSI-Bars support level breakout at 22.6194%. This signal must confirm the opening of a pending order. We can see the volume of futures traded on Chicago Mercantile Exchange outperformed the highest level of 125000 contracts: the downtrend is likely to maintain. The trading volume confirms the birth of a new trend.

TA-01-12-2014-2.png


After position opening, Stop Loss is to be moved after the Parabolic values, near the next fractal high. Updating is enough to be done every day after a new Bill Williams fractal formation (5 candlesticks). Thus, we are changing the probable profit/loss ratio to the breakeven point.

PositionSell
Sell stopbelow 1.55784
Stop lossabove 1.58410

Dear traders. For the detailed report of the strategy based on analytical issues of technical analysis click here.
 

IFCMarkets

Broker Representative
Let us consider the daily price chart of XAUUSD(GOLD) instrument. The price is moving in the limits of W1 and D1 bearish trend, containing the falling Donchian Channel. At the moment, we can observe the price retracement completion: the last bar peak of RSI-Bars oscillator is located on the border of the overbought zone, and that confirms a price reversal is about to happen when the oscillator signal breaks the support level at 16.5854%. The corresponding Parabolic confirmation will be obtained after the support level breakout at 1128.95, located below next to the last Bill Williams fractal and the Donchian Channel border. This mark can be used for opening a pending sell order with Stop Loss placed above 1258.35. This level is confirmed by the upper Donchian Channel boundary and the D1 trend line.

TA-02-12-2014-1.png


Currently, we have a confirmatory bearish signal looking at the volume of gold futures and options traded on Chicago Mercantile Exchange. The number of contracts outperformed the last level of 375000, and it is still advancing. For the trading volume data please click here.

TA-02-12-2014-2.png


After position opening, Stop Loss is to be moved after the ParabolicSAR values, near the next fractal high. Thus, we are changing the probable profit/loss ratio to the breakeven point.


PositionSell
Sell stopbelow 1128.95
Stop lossabove 1258.35


Dear traders. For the detailed report of the strategy based on analytical issues of technical analysis click here.
 

IFCMarkets

Broker Representative
Today we expect the release of two indicators which can affect significantly the Canadian dollar volatility. In the first place, ADP Non-Farm Employment Change will be published at 14:15 CET, released monthly by Automatic Data Processing. The parameters are based on the study of anonymous data from around 400.000 US business clients, excluding the farming industry and government. The preliminary estimate of employment rate is released two days before the publication of Nonfarm. That is why this indicator is worth a closer look. Employment rate is the key factor influencing the US consumer demand. If the index falls below the expected value, it will almost certainly result in the US currency weakening. Two hours later the Bank of Canada will publish the Rate Statement and cast light upon the economic situation development. We assume that the oil market restructuring and fallen energy prices may lead to the monetary policy revision of the largest exporter in favour of easing.

Here we consider the USDCAD currency pair on the D1 chart. The price is moving in the limits of W1 and D1 bullish trend, containing the rising Donchian Channel. Parabolic values are moving along the D1 trend line, confirming the trend direction. The final oscillator confirmation will be obtained after the local resistance level breakout at 73.2061%: this level is strengthened by “triple top” chart pattern, marked in red ellipse. In our opinion, this event will coincide with the price level intersection at 1.14735. This mark can be used for opening a pending buy order with Stop Loss placed below 1.11785. Both levels are confirmed by Donchian Channel boundaries, Parabolic historical values and Bill Williams fractals.
03-12-2014-1.png


After position opening, Stop Loss is to be moved after the ParabolicSAR values, near the next fractal low. Thus, we are changing the probable profit/loss ratio to the breakeven point.


PositionBuy
Buy stopabove 1.14735
Stop lossbelow 1.11785


Dear traders. For the detailed report of the strategy based on analytical issues of technical analysis click here.
 

IFCMarkets

Broker Representative
Today at 14:30 (CET) we expect the release of Building Permits in Canada. The indicator is released monthly and shows the number of permits for new construction, issued by the government. Building Permits data permits estimating the growth potential of the real estate sector and, as a result, goods of secondary demand and technology sector. The reduced index values are perceived by investors as a negative signal for domestic consumption and production. If the value is worse than expected, we can count on further growth of USDCAD currency pair.

TA-08-12-2014-1.png


Here we consider this instrument on the H4 chart. The price is moving upwards within the W1, D1 and H4 price channel: bullish trend is observed for all the timeframe scales. ParabolicSAR historical values confirm the H4 trend line and cross the lower boundary of Donchian Channel. Two graphic bullish signals are received: the breakout of the triangle side on the price chart, and a similar graphic pattern on the RSI-Bars oscillator chart. Note that RSI-Bars oscillator has justified itself as a leading indicator, because its graphic pattern was formed a few hours earlier (!).

TA-08-12-2014-2.png


The volume of futures traded on the Chicago Mercantile Exchange is growing: it confirms the trend on the D1 chart. For monitoring the liquidity evolution click here. A pending buy order may be placed above the resistance at 1.14789. This mark is confirmed by a Bill Williams fractal and the upper boundary of the Donchian Channel. Stop Loss is better to be placed below the support fractal at 1.13805. It is important to note that this level crosses the upper triangle side and it reinforces its significance.

After position opening, Stop Loss is to be moved after the Parabolic values, near the next fractal low. Updating is enough to be done every day after a new Bill Williams fractal formation (5 candlesticks). Thus, we are changing the probable profit/loss ratio to the breakeven point.

PositionBuy
Buy stopabove 1.14789
Stop lossbelow 1.13805

Dear traders. For the detailed report of the strategy based on analytical issues of technical analysis click here.
 

IFCMarkets

Broker Representative
Here we consider the GBP/USD currency pair on the H4 chart. The price is moving within the limits of D1 and H4 downtrend channel: bearish trend is observed for all the timeframe scales. Donchian Channel (13) is also demonstrating a negative bias, confirming the trend. At the moment there are no signs of a steady direction looking at the RSI-Bars oscillator: a channel was formed which has a high probability to be broken downwards at 26.48%. We believe that this signal would coincide with the price level crossing the fractal support at 1.55326. Having reached this level, we would get confirmatory signals: Parabolic values would indicate a bearish slope and Donchian channel would be destroyed. Stop Loss is recommended to be placed above 1.57323, strengthened by the Bill Williams fractal, Parabolic historical values and Donchian Channel upper boundary.

TA-09-12-2014.png


After position opening, Stop Loss is to be moved after the Parabolic values, near the next fractal high. Updating is enough to be done every day after a new Bill Williams fractal formation (5 candlesticks). Thus, we are changing the probable profit/loss ratio to the breakeven point.

PositionSell
Sell stopbelow 1.55326
Stop lossabove 1.57323

Dear traders. For the detailed report of the strategy based on analytical issues of technical analysis click here.
 

IFCMarkets

Broker Representative
Today we consider AUD/USD currency pair on the H4 chart. The price is moving within the limits of D1 and H4 downtrend channel: bearish trend is observed for all the timeframe scales. Donchian Channel (13) is also demonstrating a negative bias, confirming the trend. At the moment there are no signs of a steady direction looking at the RSI-Bars oscillator: a local overbought level is formed at 53.7114%, which was confirmed three times by the indicator signal. We believe that the formation of a new high below this level will be preceded by the intersection of a fractal price support level at 0.82183. Having reached this level, we would get confirmatory signals: Parabolic values would indicate a bearish slope and Donchian channel would be destroyed. Stop Loss is recommended to be placed above 0.83743, strengthened by the Bill Williams fractal, Parabolic historical values and Donchian Channel upper boundary.

TA-10-12-2014.png


After position opening, Stop Loss is to be moved after the Parabolic values, near the next fractal high. Updating is enough to be done every day after a new Bill Williams fractal formation (5 candlesticks). Thus, we are changing the probable profit/loss ratio to the breakeven point.

PositionSell
Sell stopbelow 0.82183
Stop lossabove 0.83743

Dear traders. For the detailed report of the strategy based on analytical issues of technical analysis click here.
 

IFCMarkets

Broker Representative
Today at 14:30 CET two key indicators of the US economy are to be released: Core Retail Sales and Unemployment Claims. The first indicator is released monthly by the US Census Bureau and, therefore, it is of interest for position trading. CRS shows a relative change in the total value of sales at the retail level, excluding automobiles, which account for 20% of the total volume. The index defines the consumer confidence. Less important indicator, Initial Claims, is projected on the basis of previous NonFarm performance. The data is published weekly by the Ministry of Labor. The indicator allows evaluating the domestic demand dynamics and the potential of consumer lending for the US economy stimulation. We assume that the release of both indicators would result in significant volatility of the US dollar against the most liquid instruments.

TA-11-12-2014-1.png


Here we consider GBP/USD currency pair on the H4 chart. The price is moving sideways, which is expected to finish with the support breakout at 1.56418 in the D1 trend direction. It occurs at the same time with the Parabolic downside reversal and the Donchian Channel bias change. Conservative traders are also recommended to get a confirmatory signal on the part of the RSI-Bars oscillator. At the moment, the oscillator line has approached the local resistance level at 73.8228% and is ready for reversal. The completion of bullish trend should be expected after the breakout at 49.5445%. Partially, Take profit may be possibly placed at 1.55355. Stop Loss is better to be placed at the fractal resistance 1.57587. This mark is confirmed by the upper Donchian Channel boundary.

TA-11-12-2014-2.png


Currently, the volume of futures and options traded on the Chicago Mercantile Exchange has increased significantly up to 180 000 contracts and even higher. You can monitor this data by clicking here. This indicates high liquidity of the currency ahead of a new volatility momentum. The probability of false breakouts in such conditions is low.
After position opening, Stop Loss is to be moved after the Parabolic values, near the next fractal high. Updating is enough to be done every day after a new Bill Williams fractal formation (5 candlesticks). Thus, we are changing the probable profit/loss ratio to the breakeven point.

PositionSell
Sell stopbelow 1.56418
Stop lossabove 1.57587

Dear traders. For the detailed report of the strategy based on analytical issues of technical analysis click here.
 

IFCMarkets

Broker Representative
Energy market reorganization governed by the US shale technology has led to increased volatility of currencies in developed countries. Volatility correlation of commodity prices and liquid instruments such as USD/JPY, GBP/USD suggests that non-commodity prices are currently behaving not in a traditional way. Today we demonstrate the impact of a new energy age on the national Japanese currency with the help of GeWorko model. Export-oriented economy of Japan benefited from fallen commodity prices. The tumbled prices for Brent futures from $77 to $73 and a further price decline allowed the Bank of Japan to continue the economic stimulus by conducting quantitative easing without a sharp increase in inflation risks: the refinancing rate has remained at zero level. The currency market was unambiguous about this event: yen dipped 2% in a few days after the OPEC summit. Note also that the Japanese trade surplus from February to November has grown 46%, while Brent futures tumbled 39%. These values are comparable. The 20-day correlation between the yen and Brent over that period was 66-85%. Usually it corresponds to correlation with the loonie as a commodity currency during the times of a stable market, but certainly not with the yen.

To take advantage of these trends, we consider the spread trading instrument &WTI_JPY, composed using Personal Composite Instrument - PCI technology. The basic part of the instrument includes 1 barrel of the US WTI crude oil, and the quoted part - 100 JPY. Get more details and the online &WTI_JPY chart by clicking here. You can also download the instrument for NetTradeX terminal.
TA-12-12-2014.png


Here we consider the daily closing/opening price chart of the given instrument. It was composed in NetTradeX trading platform. We can see that the exponential moving average is moving along the bearish trend line, confirming the trend. The price crossed it downwards and broke the fractal support at 71.741. At the same time there was a ParabolicSAR reversal in the direction of the red zone.

Another significant sign of the downtrend is the bearish gap, which was formed immediately after the OPEC meeting. Thus, it confirms our hypothesis about the Japanese monetary policy and investor’s reaction on it. We deem that a short position can be opened immediately, or (for conservative traders) after the MACD line breakout at 1.5036. Stop Loss can be opened at the crossover of the moving average and the trend line at 75.947. This mark is also confirmed by the Bill Williams resistance fractal.

PositionSell
Sell stopbelow 70.374
Stop lossabove 75.947

More information about the mechanism of portfolio operations is available on our website section “Quick Guide for Creating and Trading PCI”.
 

IFCMarkets

Broker Representative
Here we consider USD/CAD currency pair on the H4 chart. As oil prices keep falling, the Canadian dollar continues to slump. The price is moving within the limits of D1 and H4 uptrend channel: bullish trend is observed for all the timeframe scales. The trend is confirmed by ParabolicSAR values, which cross the line and fractal support level. Donchian Channel is also indicating the bullish bias. There is no contradiction on the part of the RSI-Bars oscillator. At the moment, it approached the local resistance level at 76.2609%. We expect that this level would be crossed when the price breaks the resistance level at 1.15294. This mark can be used for opening a pending buy order. Stop Loss is better to be placed at the Bill Williams support fractal 1.15106, which is strengthened by Parabolic historical values.

TA-15-12-2014.png


After position opening, Stop Loss is to be moved after the Parabolic values, near the next fractal low. Updating is enough to be done every day after a new Bill Williams fractal formation (5 candlesticks). Thus, we are changing the probable profit/loss ratio to the breakeven point.

PositionBuy
Buy stopabove 1.15294
Stop lossbelow 1.15106

Dear traders. For the detailed report of the strategy based on analytical issues of technical analysis click here.
 

IFCMarkets

Broker Representative
Here we consider GBP/USD currency pair on the H4 chart. As oil prices keep falling, we observe the US dollar strengthening against the most liquid currencies. The British pound is not an exception. The price is moving within the limits of D1 and H4 downtrend channel: bearish trend is observed for all the timeframe scales. The trend is confirmed by ParabolicSAR values, which cross the trendline and fractal resistance level. Donchian Channel is also indicating the bearish bias. There is no contradiction on the part of theRSI-Bars oscillator. At the moment, it approached the local support level at 35.3912%. We expect that this level would be crossed when the price breaks the support level at 1.55972. This mark can be used for opening a pending sell order. Stop Loss is better to be placed at the Bill Williams resistance fractal 1.57589, which is strengthened by Parabolic historical values and the bearish pattern “double top” (marked in red ellipse on the chart). We can see that the pound has been drifting sideways for almost a month. It increases the probability of volatility surge and the consolidation completion.

TA-16-12-2014.png


After position opening, Stop Loss is to be moved after the Parabolic values, near the next fractal high. Updating is enough to be done every day after a new Bill Williams fractal formation (5 candlesticks). Thus, we are changing the probable profit/loss ratio to the breakeven point.

PositionSell
Sell stopbelow 1.55972
Stop lossabove 1.57589

Dear traders. For the detailed report of the strategy based on analytical issues of technical analysis click here.
 

IFCMarkets

Broker Representative
Here we consider EUR/USD currency pair on the H4 chart. As oil prices keep falling, we observe the US dollar strengthening against the most liquid currencies. Euro is not an exception. The price is moving within the limits of D1 downtrend channel: four-hour price rebound is expected to be completed. The price approached ParabolicSAR values which cross the trend line and the fractal resistance level. Meanwhile, Donchian Channel is indicating the bullish bias, but we expect the situation to be changed after the support level breakout at 1.24105. It will coincide with RSI-Bars oscillator intersection at 50.3743%. At the moment, it has approached the local support level. The price support level can be used for opening a pending sell order. Stop Loss is better to be placed at the Bill Williams resistance fractal 1.25740, which is strengthened by the D1 trend line and the upper Donchian Channel boundary.

TA-17-12-2014.png


After position opening, Stop Loss is to be moved after the Parabolic values, near the next fractal high. Updating is enough to be done every day after a new Bill Williams fractal formation (5 candlesticks). Thus, we are changing the probable profit/loss ratio to the breakeven point.

PositionSell
Sell stopbelow 1.24105
Stop lossabove 1.25740

Dear traders. For the detailed report of the strategy based on analytical issues of technical analysis click here.
 

IFCMarkets

Broker Representative
Let’s consider the H4 chart of USD/CAD instrument. As oil prices keep falling, we observe the US dollar strengthening against the most liquid currencies. Canadian dollar, traditionally related to commodity currencies, is not an exception. A price is moving inside an H4 upward tendency. We expect a completion of correction at 1.15544 mark. It is crossed by trend line and a lower boundary of the Donchian Channel. A channel slope has a green zone direction as well. 1.15544 mark can be used for risk mitigation after the long position opening. The fractal resistance level 1.16761 in its turn is comfortable for the pending buy order opening. If it happens then a reverse of ParabolicSAR trend indicator will become probable. At the same time a divergence of RSI-Bars oscillator is going to complete. We recommend conservative traders to wait for a breakdown of the oscillator resistance mark 52.3319%.

TA-19-12-2014.png


After position opening, Stop Loss is to be moved after the Parabolic values, near the next fractal minimum. Updating is enough to be done every day after a new Bill Williams fractal formation (5 candlesticks). Thus, we are changing the probable profit/loss ratio to the breakeven point.

PositionBUY
Buy stophigher 1.16761
Stop losslower 1.15544

Dear traders. For the detailed report of the strategy based on analytical issues of technical analysis click here.
 

IFCMarkets

Broker Representative
Here we consider the USD/CAD on the H4 chart. The price is consolidated in the sideways and is preparing for a new bullish momentum. ParabolicSAR historical values are moving along the H4 trend line. There was also an important technical signal on the part of the RSI-Bars oscillator: its values indicated a valid reversal and returned back to the bearish resistance line. We expect the next bar would cross the oscillator resistance line at 61.4968% and it will coincide with the price breakout at 1.16491. Note that this mark is confirmed by the Bill Williams fractal and the upper Donchian Channel boundary. The mark can be used for opening a pending buy order with Stop Loss placed below the support line at 1.15571, which crosses the H4 trend line.

TA-23-12-2014.png


After position opening, Stop Loss is to be moved after the Parabolic values, near the next fractal low. Updating is enough to be done every day after a new Bill Williams fractal formation (5 candlesticks). Thus, we are changing the probable profit/loss ratio to the breakeven point.

PositionBuy
Buy stopabove 1.16491
Stop lossbelow 1.15571
 

IFCMarkets

Broker Representative
Today we consider GBP/USD currency pair on the H4 chart. The price is moving within the limits of H4, D1 and W1 downtrend channel: bearish trend is observed for all the timeframe scales. ParabolicSAR historical values are moving along the H4 trend line, confirming the investor sentiment. Donchian Channel is also demonstrating the negative bias. There is no contradiction on the part of the RSI-Bars oscillator: it indicated the daily downtrend. The final bearish confirmation will be obtained when the oscillator bar would cross the support level at 21.9462%. It will likely to coincide with the price breakout at 1.54803. This level is confirmed by the Donchian Channel lower boundary. This mark can be used for opening a pending sell order with Stop Loss placed above the resistance at 1.56163. This is a comfortable position for risk mitigation because the resistance level is strengthened by Parabolic historical values and the D1 trend line. We expect a new volatility momentum of this currency pair after the US Unemployment Claims being released at 14:30 (CET).

TA-24-12-2014.png


After position opening, Stop Loss is to be moved after the Parabolic values, near the next fractal high. Updating is enough to be done every day after a new Bill Williams fractal formation (5 candlesticks). Thus, we are changing the probable profit/loss ratio to the breakeven point.

PositionSell
Sell stopbelow 1.54803
Stop lossabove 1.56163

Dear traders. For the detailed report of the strategy based on analytical issues of technical analysis click here.
 

IFCMarkets

Broker Representative
Let’s consider the H4 chart of USD/JPY instrument. In spite of long-term bullish mood (D1,W1,…) we observe a downwards correction. Price crossed an upward H4 trend line and entered a narrow range of 119.829-120.927. In case of a flat motion signals of leading oscillators are extremely important. That’s why we recommend paying attention at RSI-Bars patterns. We observe that an upward tendency slowly turns to the red zone – look at the trends fan. Then a formation of a new bullish trend was fixed (marked by the red corridor) and a simultaneous breakdown of the support level occurred. In such a way the oscillator sent an outrunning signal to the most prudent investors – a direction choice became obvious. The 119.829 support may be used for the pending sell order placement. Risk mitigation may be tied to the fractal resistance of 120.927. This key level was confirmed by the historical values of ParabolicSAR, the upper boundary of Donchian Channel and the intersection of a previous H4 trend line. We suppose that the given scheme of risk control should be comfortable for conservative traders.

TA-26-12-2014.png


After position opening, Stop Loss is to be moved after the Parabolic values, near the next fractal high. Updating is enough to be done every day after a new Bill Williams fractal formation (5 candlesticks). Thus, we are changing the probable profit/loss ratio to the breakeven point.

PositionSell
Sell stopbelow 119.829
Stop lossabove 120.927
 

IFCMarkets

Broker Representative
Today we consider EUR/USD currency pair on the D1 chart. In line with long-term bullish players (W1), there is a bearish momentum formation on the daily chart. Parabolic historical values are moving along the D1 downtrend line, confirming the market sentiment. Donchian Channel is also demonstrating the negative bias. The only alarming signal comes from the RSI-Bars oscillator: it indicates the sideways movement. The support breakout at 27.5216% may be considered as a confirmatory signal. It is expected to be preceded by a strong bearish momentum and the price level intersection at 1.21576. This mark can be used for opening a pending sell order with Stop Loss placed above the fractal resistance at 1.25768. This key level is also confirmed by ParabolicSAR historical values, the upper Donchian Channel boundary, and the D1 trend line crossing. We deem that the proposed scheme of risk management should be comfortable for conservative traders.

TA-29-12-2014.png


After position opening, Stop Loss is to be moved after the Parabolic values, near the next fractal high. Updating is enough to be done every day after a new Bill Williams fractal formation (5 candlesticks). Thus, we are changing the probable profit/loss ratio to the breakeven point.

PositionSell
Sell stopbelow 1.21576
Stop lossabove 1.25768

Dear traders. For the detailed report of the strategy based on analytical issues of technical analysis click here.
 

IFCMarkets

Broker Representative
Today the monthly Consumer Confidence index will be released at 16:00 CET in the United States. The index provides a growth estimate of consumer spending. It is based on household survey. The indicator measures labor availability, business conditions, therefore, it is particularly interesting for investors. At that time we expect a volatility momentum on the US currency market. Let’s consider GBP/USD currency pair on the H4 chart. The major D1 trend and the H4 trend are influenced by bears. Parabolic historical values are moving along the trend line, confirming the investor sentiment.

At the moment Donchian Channel is consolidated: a new momentum is about to appear and retracement is to be completed. There is no contradiction on the part of the RSI-Bars oscillator. Moreover, the double bottom pattern was breached (marked in red ellipse) and the last three bars are located below this level. The price mark at 1.54939 can be used for opening a pending sell order. This level is confirmed by Parabolic historical values and the lower Donchian Channel boundary. Please note that this level and the trend line form a triangle with a bearish slope. Stop Loss can be placed at the fractal 1.56108, located above the trend line.

TA-30-12-2014.png


After position opening, Stop Loss is to be moved after the Parabolic values, near the next fractal high. Updating is enough to be done every day after a new Bill Williams fractal formation (5 candlesticks). Thus, we are changing the probable profit/loss ratio to the breakeven point.

Dear traders, analytical department of IFC Markets is wishing you love, health, professional progress and, of course, successful trading! Happy New Year!

PositionSell
Sell stopbelow 1.54939
Stop lossabove 1.56108

Dear traders. For the detailed report of the strategy based on analytical issues of technical analysis click here.
 

IFCMarkets

Broker Representative
Today we consider USD/JPY currency pair on the H4 chart. Last week the markets reacted to the statement made by the ECB President Mario Draghi, who made it clear that the deflation possibility in the euro zone has increased. It means that the EU financial system is not adapted to new conditions which were settled after the crisis, so the financial recovery leader still remains to be the United States. After that, investors started to hedge risks, converting deposits into USD. This has resulted in greenback strengthening against the most liquid currencies, including the Japanese yen. However, the growth potential is not yet fully exposed: last week the yen tested the resistance for three times 120.822, without having a breakout. Along with that, a bullish gap and the ascending triangle appeared. The triangle was formed by the H4 support and resistance. Both signals indicate the bullish investor sentiment. ParabolicSAR historical values are moving along the trend line, confirming the price direction. We will wait for a new volatility momentum after the price crosses the double top pattern (marked in red ellipse). This level can be used for placing a pending buy order.

TA-05-01-2014-1.png


Conservative traders are also recommended to wait for the resistance line breakout of the RSI-Bars oscillator and the trading volume to reach above the local low. At the moment the market is recovering after holidays. The daily volume of contracts traded on the Chicago Mercantile Exchange has not yet outperformed 150000. We will expect this mark to be exceeded to confirm short-term trends on the H4 timeframe. To monitor the volumes click here.

TA-05-01-2014-2.png


Stop Loss can be placed at the fractal support 118.772. This mark is confirmed by the lower DonchianChannel boundary. In case of the channel breakout, after the position opening, Stop Loss is to be moved after the Parabolic values, near the next fractal low. Updating is enough to be done every day after a new Bill Williams fractal formation (5 candlesticks). Thus, we are changing the probable profit/loss ratio to the breakeven point.

Buy Stopabove 120.822
Stop Lossbelow 118.772
Dear traders. For the detailed report of the strategy based on analytical issues of technical analysis click here.
 

IFCMarkets

Broker Representative
Today at 16:00 CET we expect ISM Non-Manufacturing PMI to be published in the US. The index is released monthly by the Institute for Supply Management, on the third trading day. ISM index is the result of a monthly survey of more than 400 purchasing managers, excluding the manufacturing industry. Purchasing managers are asked about employment, price levels, suppliers, and inventories. If the index is below 50, it indicates economic recession due to reduced activity, especially if the trend remains for several months. We expect the index release would result in volatility momentum of the most liquid currencies against the US dollar.

Here we consider GBP/USD currency pair on the D1 chart. The bearish trend channel has approached the significant support line (MN). At the moment, Parabolic historical values are moving along the D1 trend line. Donchian Channel is also demonstrating the negative bias. Thus, there are no technical conditions for the trend slowing. We also see that the last bar of the RSI-Bars oscillator crossed the trend line. The trend direction is changing towards the red zone, excluding the divergence to happen. The fractal support breakout at 1.51851 would surely result in a new large-scale weakening of the British pound. This mark can be used for opening a pending sell order. On the other hand, the trend stability may not be sufficient for the MN support line breakout. Therefore, the second pending order is placed above the closest resistance at 1.56038. Risk mitigation levels are placed symmetrically.

TA-06-01-2014-1.png


Conservative traders are also recommended to wait for the trading volume to reach above the local high. At the moment the market is recovering after holidays. The daily volume of contracts traded on the Chicago Mercantile Exchange has not yet outperformed 120000. We will expect this mark to be exceeded to confirm the trend. To monitor the trading volumes click here.

TA-06-01-2014-2.png


Buy Stopabove 1.56038
Stop Lossbelow 1.51851

Sell Stopbelow 1.51851
Stop Lossabove 1.56038

Dear traders. For the detailed report of the strategy based on analytical issues of technical analysis click here.
 

IFCMarkets

Broker Representative
Today at 14:30 CET we expect the Trade Balance releases in the US and Canada. Besides, 15 minutes earlier the monthly Non-Farm Employment Change will be published by Automatic Data Processing. The indicator is based on the study of anonymous data of about 400.000 business clients, excluding the farming industry and government. The preliminary outlook of the employment growth is released 2 days ahead the Nonfarm publication. This is the reason this indicator is worth a closer look. Employment is the key factor influencing the US consumer demand. If the data is better-than-expected, it will almost certainly result in the US currency strengthening.

TA-07-01-2014-1.png


Here we consider USD/CAD currency pair on the H4 chart. As heavy crude oil prices plunge, the Canadian “quasi-commodity” currency continues to slump. At the moment the graphical analysis indicates two bullish signals: the price leaving the triangle in the direction of the green zone and the H4 resistance line breakout. However, the fractal breakout is not confirmed by the RSI-Barsoscillator. It is recommended to wait for the oscillator breakout at 84.3602% for position opening. Other trend indicators confirm the bullish market sentiment. Stop Loss can be placed at 1.17239. This mark is confirmed by Parabolic historical values and the Bill Williams fractal. If negative statistics will be released in the US, this mark may be used for placing the opposite order. In this case, the price would return into the limits of the trend channel and the trend pace would slow down.

TA-07-01-2014-2.png


However, this situation has little chances to be developed. As the figure shows, the volume of CAD futures contracts traded on the Chicago Mercantile Exchange is going up, so that it confirms the trend stability. Conservative traders are recommended to wait for the trading volume to outperform the level of 80 000 contracts. We will expect this mark to be exceeded to confirm the trend. To monitor the trading volumes click here.

Dear traders. For the detailed report of the strategy based on analytical issues of technical analysis click here.
 
Top