The RSX indicator is a powerful VertexFX client-side script that is useful in identifying the strength of a trend. It employs smoothing and noise filtering mechanism to remove excessive noise, resulting in a smooth, bounded oscillator with minimal lag.
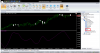
RSX is bounded between 0 and 100- values below 50 imply bearishness whereas values above 50 imply bullishness. When the RSX is rising smoothly the price is in a bullish uptrend, and when the RSX is falling smoothing the price is in a bearish downtrend. When the indicator is below 30, it is considered to be extremely bearish with a likelihood of reversal. Similarly when the indicator is above 70, it is considered to be extremely bullish with a likelihood of a reversal.
Traders prefer to enter a LONG trade when the RSX has started rising after have turned around from below 30. The stop-lossis typically placed below the nearest Swing Low during a LONG trade. A SHORT tradeis entered when the RSX has started falling after having risen above 70. In this case, the stop-loss is typically placed above the nearest Swing High.
The RSX is calculated based on the HIGH and LOW price series over the recent LENGTH period. In the first step, the sum of the previous HIGH and LOW is subtracted is the sum of the current HIGH and LOW price series. A smoothing co-efficient of 3 / (LENGTH + 2) is applied to this difference, and this step is repeated over the recent LENGTH bars. In the next step, the Relative Strength (RS) is calculated from this series over the recent LENGTH bars, and this value is smoothed using the smoothing co-efficient. The resultant value is bounded between 0 and 100 by expressing as a percentage.
Compared to other indicators, RSX produces a smoother output thereby eliminating whipsaws and jittery trades. Additionally, by using HIGH and LOW price series instead of CLOSE, it focuses on the trading range expansion or contraction - which is indicative of trend exhaustion. When a trend nears its exhaustion, the range first narrows down, and thenexpands in the opposite direction – this is captured by the RSX immediately, and thus provides better trading opportunity than other conventional indicators.
https://www.hybrid-solutions.com/plugins/client-vtl-plugins/free/rsx.html