• The Forex, Binary Options Forum - welcomes you to our Community!

    DigitalCashPalace Forum is dedicated to discussions about Forex, Binary Options, commodities, stocks related.

    Please take a look around, and feel free to .

RoboForex - roboforex.com

How to Trade by Reversal Strategy

Author: Andrey Goilov

24-1536x662.jpg


Dear Clients and Partners,

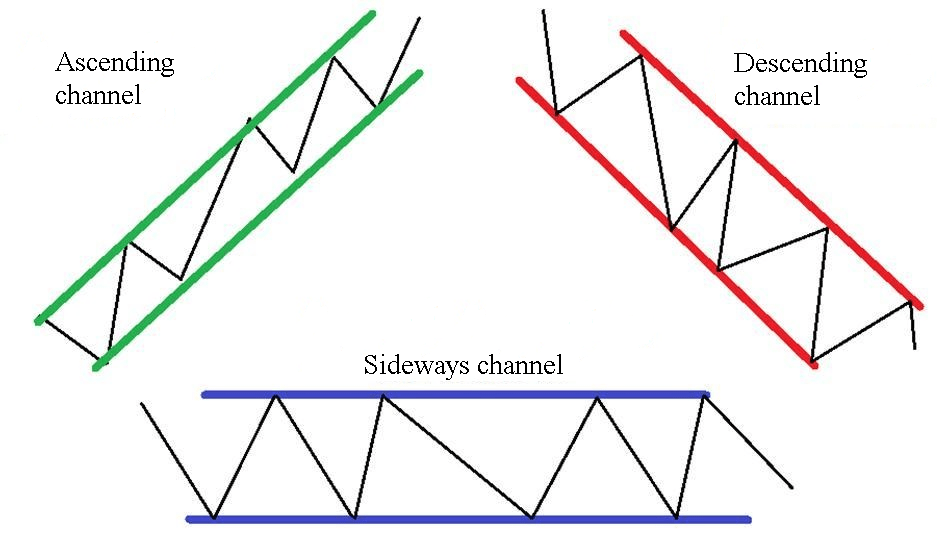
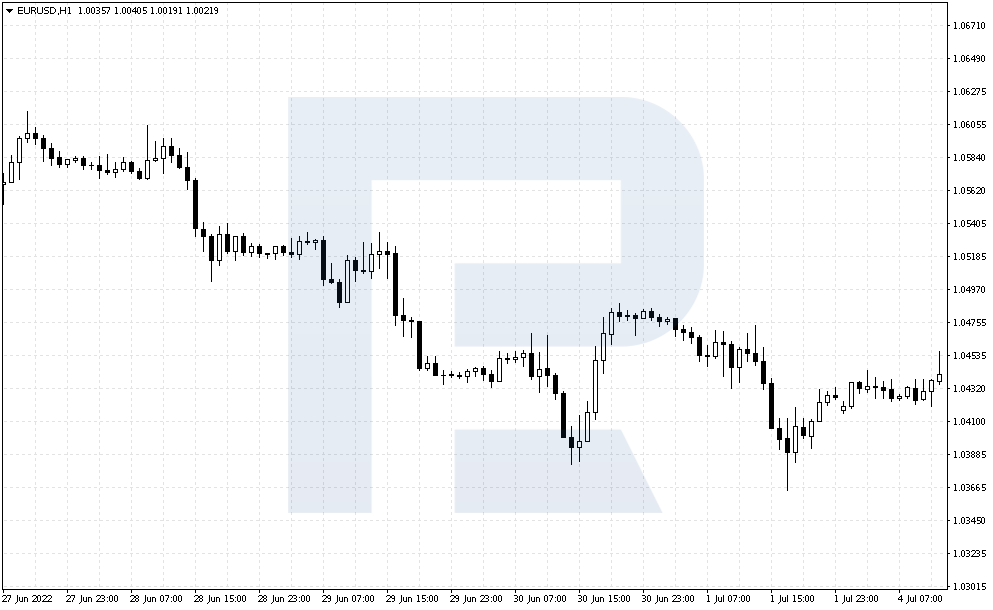
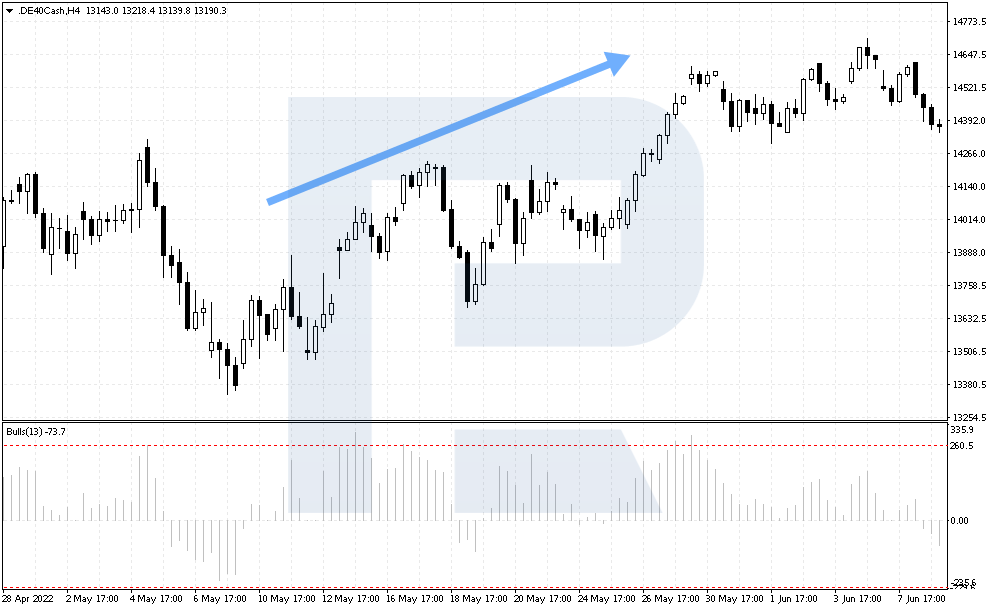
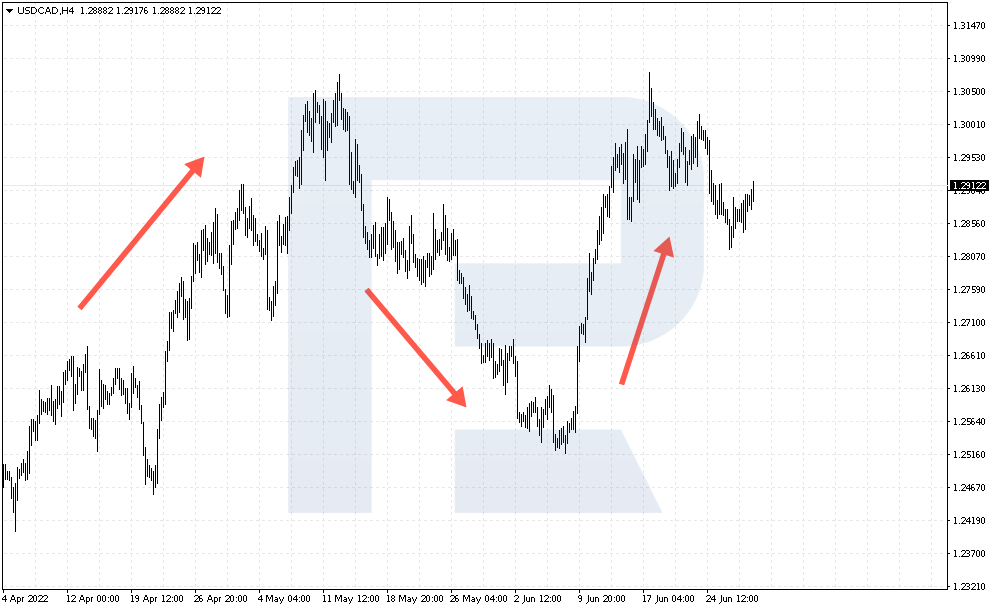
One of the main principles of tech analysis is “Trend is your friend”. Hence, some insist that for better results trading must occur by the trend only. However, any trend eventually comes to an end. A bull trend ends and changes or a bear one, and vice versa – see some examples on the charts.

Pic-1-ZigZag.png


The strategy we are about to discuss is called Reversal. The name makes it clear that here the trader is to wait for the trend to end and enter the market in the opposite direction. The timeframe is H4, which means the strategy does not require much time spent in front of the computer, tracking the price. The authors note that the method is quite easy to use, and risk management rules allow placing a Stop Loss much lower than the Take Profit.

In the article, we will see how to use the ZigZag and MA indicators to catch the end of the trend and enter by the new trend.

Setting up indicators for strategy

The method is applicable for two currency pairs only: EUR/USD and GBP/USD. These are popular instruments these days; also, movements of GBP/USD will be the strongest. To start trading, two indicators need to be added to the chart:
  1. Simple Moving Average with period 18
  2. ZigZag with period 150
Let us discuss each of these indicators for better understanding the Reversal strategy. Also, while the MA is, in essense, a basic instrument known by each trader, ZigZag is not so widespread.

Simple Moving Average

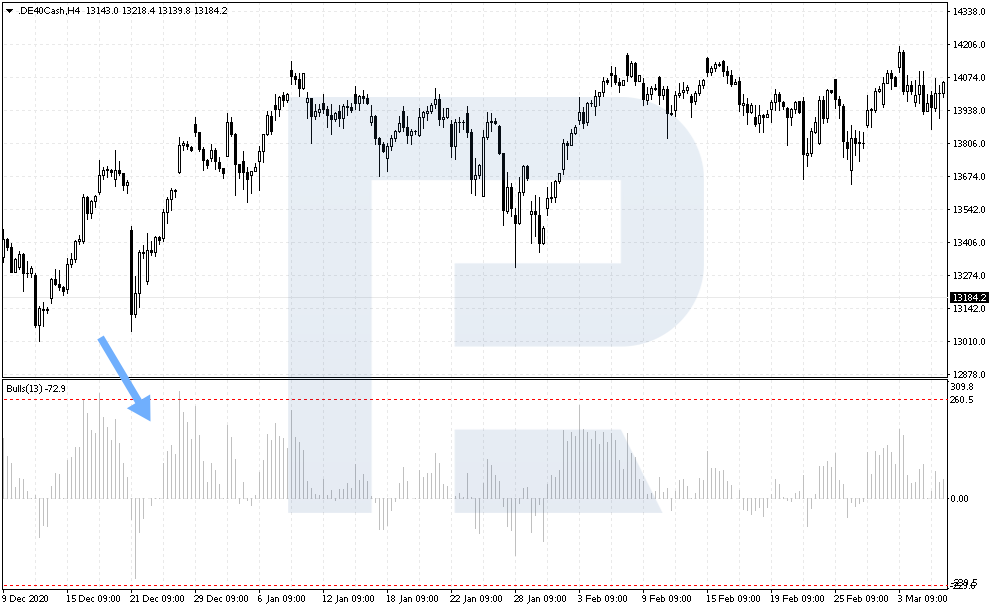
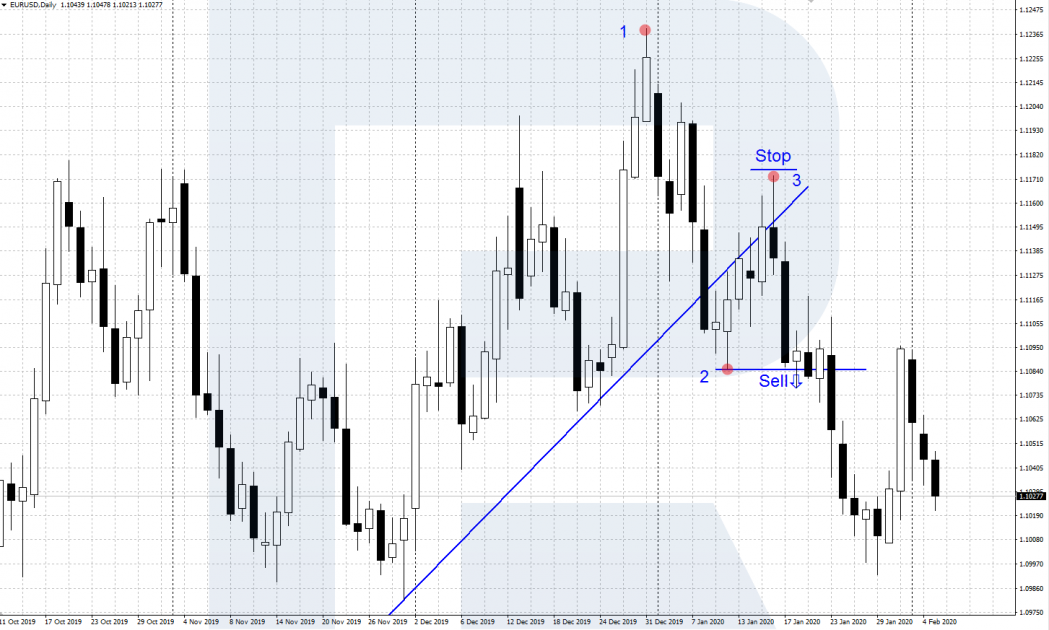
The method is based on the signals given by the SMA. It is super user-friendly: if prices are above the indicator line, it is a signal to buy. And if the price breaks the line from above, look for signals to sell. As a rule, this indicator is used in every trend strategy.

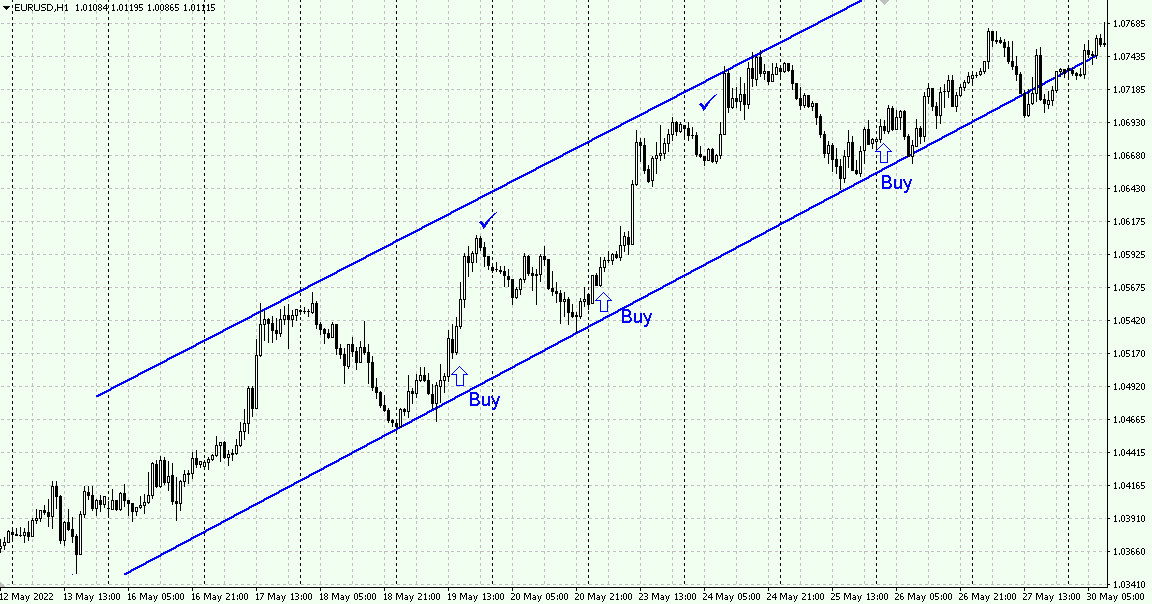
How to buy by Reversal strategy

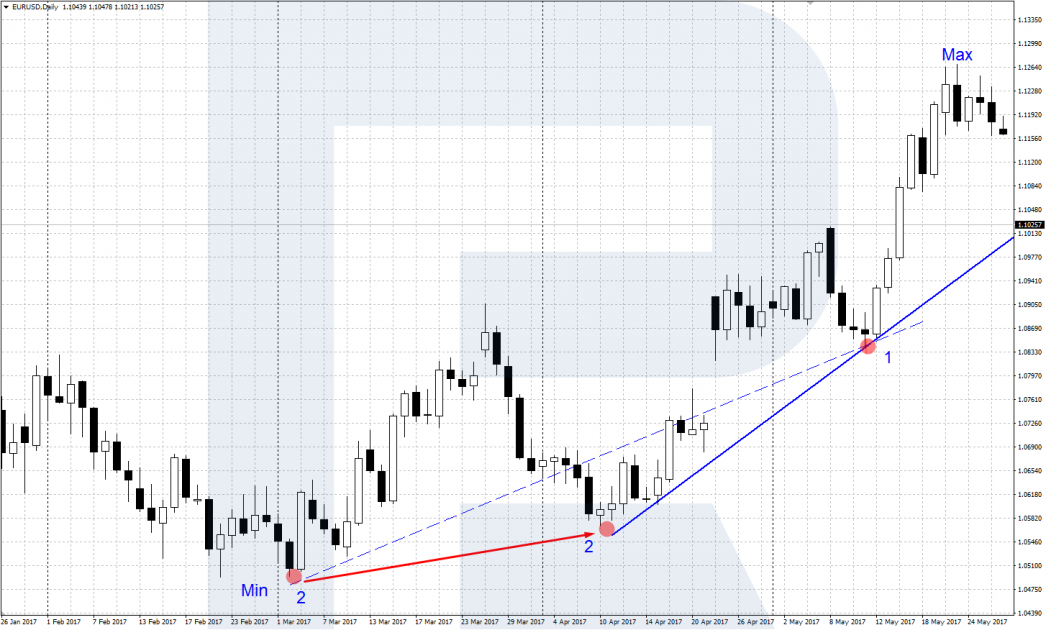
After adding all the instrument to the chart, let us look into the details of opening long positions:

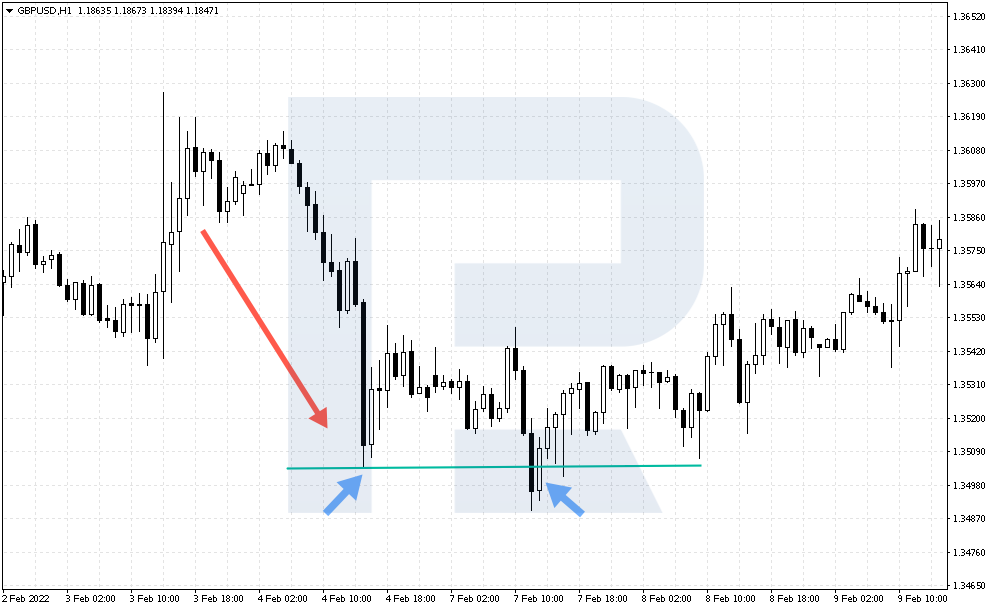
1. ZigZag values reach their lows. The indicator helps define important levels on the chart. If the indicator values reach the lows, a good bounce upwards is likely to follow.

Pic-5-ZigZag.png


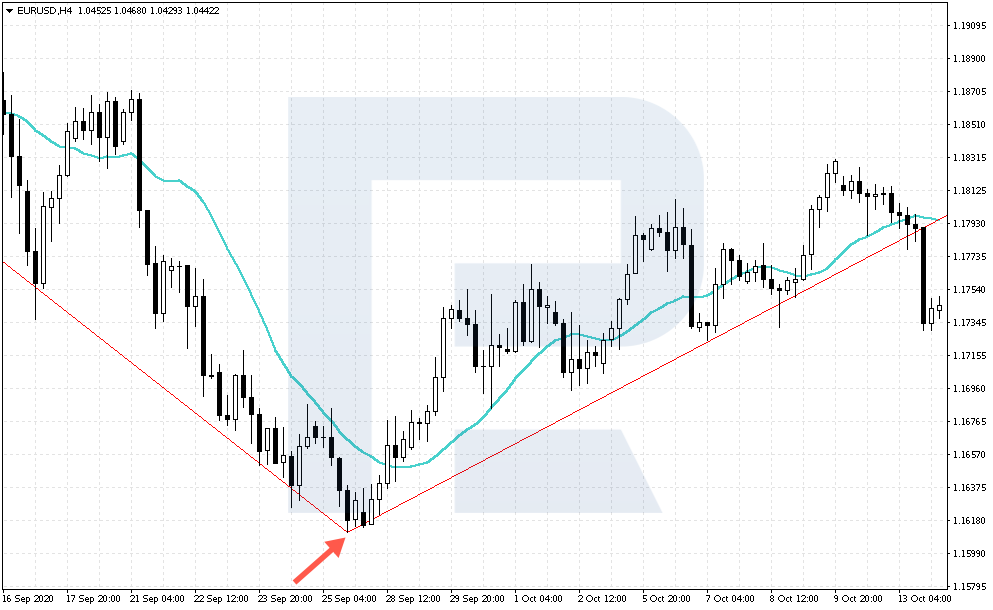
2. Price breaks through the SMA upwards. Check out the Close price of the candlestick: if the price turns out to be above the MA, the breakaway is true, so a buying trade can be opened at the opening of the next candlestick. This is the second signal by the strategy, which is necessary to avoid entering the market at each low shown by ZigZag. When the price breaks through the MA from below, this will be a signal for the beginning of an uptrend.

Bottom line

The Reversal strategy is an easy way to catch the change of the market trend. The advantages of the method are availability of the indicators: there is no need to look for anything extra and go deep into details. The potential goal is 3-4 times bigger than the loss, which allows for covering several losing trades by one profitable. However, trade occurs on H4 with altered ZigZag values, signals will be scarce, and only two currency pairs suit the strategy. This must be the only serious drawback of the strategy. Apart from this, this is a simple strategy with clear entry and exit rules.

Read more at R Blog - RoboForex

Sincerely,
RoboForex team
 
Dear traders!

This week, the ContestFX project, as usual, is waiting for you in the following competitions:

The 136th competition of "Demo Forex" has entered the final stage.
The 371st competition of "Week with CFD" has started today.
505th competition of "Trade Day" will start on 27.07.2022 at 12:00.
419th competition of "KingSize MT5" will start on 28.07.2022 at 20:00.

We remind you that all winners of our demo contests receive prize funds to their real trading accounts, so they could use them to perform trading operations in the Forex market without investing their financial savings.

If you want to be one of them, join us!

Sincerely,
RoboForex Contest
 
Price Channel in Trading: How to Draw and Use

Author: Victor Gryazin

3-1536x662.jpg


Dear Clients and Partners,

This overview is devoted to the use of price channels in trading: what does this term mean? How to find a price channel on the chart? Where to open and close trading positions?

What is price channel

According to a definition from tech analysis, price channel is the fluctuation of the asset price between two parallel support and resistance lines inside the current trend.

In other words, a price channel appears on the chart when the movements of the quotes of a certain asset over a certain timeframe are limited by two parallel lines: one up, one down.

Types of price channel

Depending on the direction of the support and resistance lines, three main types of price channel can be singled out:
  • Ascending price channel: the lines are headed upwards, the market is growing
  • Descending price channel: the lines are headed down, the market is falling
  • Sideways price channel: the lines are horizontal, the quotes fluctuate in a limited range.
pricechannel.png


How trade in price channel

Do you remember the motto of tech analysis? It goes: "Trend is your friend", i.e. one should trade the trend. Finding an active price channel on the chart, the trader does not only see the trend direction but also gets interesting entry and exit points for their positions. Let us get into classic ways of trading price channels.

Trading ascending channels

The channel forms in an uptrend: each new high is above the previous one, and so is each new low. The support line goes through lows — this is the main line of the channel, the trendline. The resistance line goes through the highs. In ascending channels, only buys are valid.

Main ways of trading:

The main thing is that buys are only opened at the support line. The Stop Loss is placed beneath this line. Positions are closed at the resistance line. Trading may go this way while the price remains inside the channel.
When the quotes break through the support line, the ascending impulse is over. The price escapes the channel and reverses. From now on, selling can be considered.

pricechannel-bull.png


Trading descending channels

The channel forms in an active downtrend: each new high is lower than the previous one, and so is each new low. The resistance line goes through the highs — this is the mainline of the channel (the trendline). The support level goes through the lows. Only selling trades may be opened in a descending price channel.

Read more at R Blog - RoboForex

Sincerely,
RoboForex team
 
Dear traders!

This week, the RoboForex company's project called ContestFX offers you the following competitions:

The 137th competition of "Demo Forex" and 372nd competition of "Week with CFD" have just started.
The 506th competition of "Trade Day" will start on 03.08.2022 at 12:00.
The 420th competition of "KingSize MT5" will start on 04.08.2022 at 20:00.

It does not take much effort to participate in our demo contests - all you have to do is go through a simple registration procedure just once and then you'll get access to any chosen competition with just a couple of mouse clicks.

We're looking forward to your joining in and wish you good luck!

Sincerely,
RoboForex Contest
 
How to Trade by Psychological Reversal Strategy

Author: Andrey Goilov

6-1536x662.jpg


Dear Clients and Partners,

Certain traders choose against using indicators in their strategies, considering them lagging. Such traders are sure that all they need for market analysis is the price chart. The price contains all the necessary parameters and factors and represents the behaviour of the mob and major players alike. One only needs to learn how to read and understand charts. Also, some investors think the fact that indicators base in price parameters to be yet one more their drawback.

Pic-1.png


The trade practice called Psychological Reversal presumes using no indicators. It is based in the understanding of the psychology and behaviour of a group of tra ders. It might seem to be similar to the False Breakaway technique but the Psychological Reversal strategy has strict time limits of market entry.

This article explains how to interpret the behaviour of market players correctly in times of strong movements and how to manage risks by the strategy.

What is Psychological Reversal strategy

The trader works on hourly charts. The idea is to look for strong breakaways of levels and expectations of fast price reversals. For example, if the market is in an uptrend, the price breaks through the nearest resistance level with a large candlestick and soon returns — this is a signal to sell.

Some think that most market players place protective orders behind local extremes, hoping for a soon market reversal. As soon as the price reaches these orders, a movement in the opposite direction happens; traders lose, and later the market, indeed, reverses downwards.

Example of buying by Psychological Reversal

On H1 of GBP/USD for 7 February 2022 the price is declining from the high, and the overall movement resembles a downtrend, in which each next high or low is lower than the previous one. The price tests 1.3504 and quickly bounces off it. We mark this level as a strong support area.

Pic-9.png


Then we need to keep an eye on a breakaway of this level and assess the behaviour of market players. The level is broken 21 hour later, after which the price returns to the level on the next candlestick already. This signals a trend correction, which means we may buy.

In this case, the TP is 15 points, equalling the distance from the level to the deepest point of the price decline.

Read more at R Blog - RoboForex

Sincerely,
RoboForex team
 
The Free Float Ratio: Everything Investors Should Know

Author: Maks Artemov

10-1536x662.jpg


Dear Clients and Partners,

There are plenty of indicators and multipliers for analysing public companies. In this article, we’ll talk about one of them, the Free float ratio. We’ll find out the formula for calculating it and describe how investors use it when analysing the market situation.

What the Free float ratio is

The Free float ratio is the quantity of shares available for public trading. They are traded on stock exchanges, are not owned by strategic investors, and are available to retail ones. You can meet other names it goes by – Float or Public Float.

What shares are not included in a Free float calculation?

When calculating the Free float ratio, the following shares are not included:
  • Owned by shareholders, the company’s management and top managers
  • Owned by the state
  • Owned by big investment funds, which are majority shareholders
In addition, limited shares are also not taken into account. For example, shares that were given to an employee as a reward for the merits for a company.

How the Free float ratio is calculated

To calculate the Free float ratio, we need to know the number of free float shares and the total number of shares issued. To make the formula look easy to understand, we’ll denote these parameters as A and B, respectively.

The Free float ratio calculation formula:

Free float = A / B

The ratio can be specified in two formats – in percentage (for example, 50%) or decimal fraction (for example, 0.5).

Let’s say that a company issued 100,000 shares; 51% of them, 51,000, a majority stake, are owned by the management, while the rest 49,000 shares were released for free circulation. In this case, the Free float ratio will be 0.49 or 49%.

The Free float calculation: 49,000 / 100,000 = 0.49

What Free float value is considered optimal?

The optimal Free float value for both traders and investors is in the range of 40–80%. Such volumes of free float shares provide some kind of protection against market fluctuations, increase the instrument's liquidity, and afford an opportunity to buy or sell an asset at any time. In other words, the higher the Free float ratio, the more liquid the instrument is and the more opportunities investors have.

Disadvantages of the low Free float ratio

First of all, small or limited market demand. After buying some shares, a trader might find it difficult to sell them. There is a possibility that there won’t be a buyer in the market to acquire this asset, or its price might be very low.

Secondly, there might be sharp price fluctuations in either direction at a time of news releases, which may cause panic among market players.

Thirdly, buying a vast amount of shares by a single investor might significantly raise the price and cause disbalance. Selling a major minority shareholding can be delayed and it also might result in a price surge. In some cases, shares can’t be sold at all because there are no investors willing to buy them.

How to use the Free float ratio for market analysis

To begin with, the ratio provides an investor with an understanding of an instrument's liquidity. If the ratio value is 40–80%, an instrument is considered quite liquid and involves smaller trading-related risks.

The Free float value above 80% means that it will be difficult for jobbers and big-time investors to cause higher volatility in the market by selling/buying big amounts of shares.

A ratio value below 40% says that the majority of shares are owned by principal shareholders and they have the ability to influence share prices by unloading a lot of shares in the market. Small amounts of free float shares raise additional difficulties for selling them.

Read more at R Blog - RoboForex

Sincerely,
RoboForex team
 
Dear traders!

This week, the ContestFX project invites you to take part in the following competitions:

The 137th competition of "Demo Forex" is gaining momentum.
The 373rd competition of "Week with CFD" has just kicked off.
The 507th competition of "Trade Day" will start on 10.08.2022 at 12:00.
The 421st competition of "KingSize MT5" will start on 11.08.2022 at 20:00.

We remind you that all the winners of our contests receive prize funds to their real trading accounts which they can use to perform trading operations on the Forex market

Take your chance to be one of them!

Sincerely,
RoboForex Contest
 
Electric Cars Increase Demand for Lithium: Which Companies Will Attract Attention?

Author: Eugene Savitsky

2-1536x662.jpg


Dear Clients and Partners,

Brass is the main metal for the global green energy transition. However, there is another metal which is vital for the process, and this is lithium. This article is devoted to this material, primarily used in batteries and energy storage units. Unlike brass quotes, lithium quotes are trading near their all-time highs instead of falling. Over the past two years, lithium prices increased by 1,280%. This article explains what this metal is like and which companies produce and sell it.

Lithium

Lithium is a light, soft alkaline metal of silvery white colour. It is used rather widely, including in chemical electricity sources, metallurgy, electronics, nuclear energy, healthcare, lubricants, space industry, glass industry, etc. The main consumers of lithium are glass industry (29%) and energy (27%).

The main lithium mines are situated in the so-called Lithium Triangle on the territory of Argentina, Bolivia, and Chile. This region holds about 70% of global lithium reserves. The Top 5 list of countries with largest reserves features Bolivia, Argentina, Chile, Australia, and China.

How lithium is mined

There are two ways of mining lithium. The first one is the ore method. It implies construction of a mine or quarrying. The metal itself is produced from pegmatite minerals. The second way is producing lithium from water solution.

The second method costs less: the solution is pumped up to the surface from the depth of several meters. It fills up huge pools and then evaporates under the sun, leaving in the pools a concentrate that is gathered and transported to the plant. There lithium is separated from the white flour, pressed in bricks, and sent to customers.

The second method is only used in countries with dry climate. In many Northern lands this method can hardly be used because water will need to be heated up in the process of gathering lithium, and this implies additional costs. So, only countries with extremely cheap energy carriers can afford this.

What Free float value is considered optimal?

The optimal Free float value for both traders and investors is in the range of 40–80%. Such volumes of free float shares provide some kind of protection against market fluctuations, increase the instrument's liquidity, and afford an opportunity to buy or sell an asset at any time. In other words, the higher the Free float ratio, the more liquid the instrument is and the more opportunities investors have.

What influences lithium prices

As said above, lithium is widely used and has always been in demand. However, the volumes required by the global market used to be much smaller than these days, and lithium companies managed to satisfy the demand fully. The situation changed abruptly when humanity started mass production of electric cars because lithium is used in batteries. So, the metal price started growing at once.

Take a look at the diagram of global sales of electric cars. Since 2014, sales of electric cars have been growing. In 2018 and 2019, sales volumes remained at a more or less equal levels, i.e. there was a minor pause. However, in 2020 and 2021, sales doubled.

sales.png


The dynamics of electric cars sales and lithium prices correlate. Hence, the main demand for lithium is created by the car industry. And the more electric cars appear, the higher becomes the demand for the metal.

Risks and lithium ETFs

The first ones to mention are political risks, i.e. limitations imposes on the business of foreign companies in certain countries, like in Chile. These situations will have a good influence on lithium prices, which means the price might grow after such events, yet the companies that get the limitations imposed on them will suffer a stock price decline. To avoid the risks entailed by investing in one company, investors might consider lithium ETFs, such as Global X Lithium & Battery Tech ETF (NYSE: LIT) or Amplify Lithium & Battery Technology ETF (BATT).

The second risk bases itself in active investments in lithium mining that might make the supply exceed the demand. In this case, lithium quotes will start declining, and companies that have invested in increasing production will fail their financial liabilities because their income will fall.

Read more at R Blog - RoboForex

Sincerely,
RoboForex team
 
Rule 72: What Is It for and How to Use It?

Author: Victor Gryazin

4-1536x662.jpg


Dear Clients and Partners,

This overview is devoted to such a method of assessing investments as Rule 72. We will see how it works and how it can be used.

What is Rule 72

Rule 72 is a simplified calculation method that shows how fast your investments will double if the profitability remains stable. Calculation of complicated percentage (profitability of constant reinvestments) is a really difficult mathematical operation that makes most people grab a calculator. Hence, for less accurate calculations, right on your lap, investors use Rule 72.

By this method, any person can simply count in their mind and fancy the magic of complicated percentage.

If you want to know how much time you will need to double your assets if the interest rate remains set, this Rule is the fastest option. It was for the first time mentioned in the works of an Italian mathematician Fra Luca Bartolomeo de Pacioli.

Calculation formula for Rule 72

The mathematical formula for Rule 72 looks as follows:

T = 72 / R

Where:

T is the time during which the capital be doubled;
R is the interest rate.

When it comes to assessing the errors of such estimations, you get better results when the interest rate is about 8%. Nonetheless, you can feel confident when the interest rate is between 1% and 15%.

When the profitability is higher than this, the calculation becomes too inaccurate. In the end, nothing can be compared to the real calculations of complicated percentage with special calculators.

How to use Rule 72 in finance

There are several main ways of using Rule 72 in finance:
  • Calculation of capital doubling time: the main task of the rule is assessing how many years it will take the capital to grow twice when the yearly interest rate is set (acceptable accuracy is between 1% and 15%).
  • Profitability calculation: the formula can be used vice versa as well, assessing which yearly interest rate is necessary to double the capital over a certain time. For example, to find out which interest rate we need to double the capital in 6 years, you just divide 72 by y = 12%.
  • Assessing inflation influence: it helps to understand how inflation decreases the capital if it just lies idle and brings no profit. For example, let us see how long it will take your savings under the mattress to become 2 times smaller when the yearly inflation is 6%: 72/6 = 12%. 12 years later, if inflation is stable, you will be able to buy twice as less goods and services than now. From some $10,000, you will only have $5,000.
What is the difference between Rule 72, Rule 70, and Rule 69

Apart from Rule 72, you can use Rule 70 and Rule 69 with the same goals. These rules help to simplify calculations or calculate more accurately depending on the period of interest payments.

For example, Rule 69 is most accurate when interest is paid daily. For monthly and annual payments, Rule 72 is normally used. Rule 70 is applicable for the sake of simplicity.

Anyway, each of these rules can be used for fast calculations with a set and relatively low error level. Choose the rule that is better for your goal.

Bottom line

Rule 72 is a simple and comfortable way of calculating the attractiveness of investments right in your mind. This is quite an innacurate way that makes certain errors but gives an opportunity to assess the profitability of investments without going deep in maths.

Read more at R Blog - RoboForex

Sincerely,
RoboForex team
 
Dear traders!

This week, the RoboForex company's project called ContestFX is waiting for you in the following competitions:

The 137th competition of "Demo Forex" has entered the third week.
The 374th competition of "Week with CFD" has just started.
At 12:00, August 17th, 2022, starts the 508th competition of "Trade Day".
At 20:00, August 18th, 2022, starts the 422nd competition of "KingSize MT5".

To take part in our contest, it is enough to go through a simple registration procedure and then any of the chosen competitions will be available to you in just a couple of mouse clicks

We wish good luck to all of you!

Sincerely,
RoboForex Contest
 
Depositary Receipts: Types, Specifics, And How They Are Different from Stocks

Author: Victor Gryazin

14-1536x662.jpg


Dear Clients and Partners,

In this article, we’ll discuss a popular financial instrument, depositary receipts. We’ll learn how they are used, what types of DRs there are, and talk about their advantages and disadvantages.

What a depositary receipt is

A depositary receipt (DR) is a security (certificate) that represents shares or bonds in a foreign company traded on a local stock exchange.

In fact, it’s a derivative security that removes any limitations or restrictions on investments is shares and bonds of foreign companies. These certificates have all rights of base assets being a domestic security.

Depositary receipts are bought by investors (DR holders) in accordance with a deposit agreement. A depository is an issuer’s agent and acts as a link between investors and an issuer.

Using depository receipts, investor can own shares of foreign companies without having to trade directly in foreign markets. Market players acquire depositary receipts the same way as stocks – directly, if they have access to stock exchanges, or via brokerage companies.

How depositary receipts work

Before describing all the nuances, we’ll tell you what is hiding behind such terms as “depository” and “custodian bank”.

A depository is a professional participant in the security market and its major function is registration of titles to assets. In other words, a depository keeps your securities.

A custodian bank both keeps and manages the securities or other financial assets of its clients. In addition, it can offer other financial services; for example, clearing, transaction settlement, or exchange operations.

For example, a Japanese car manufacturing company wants to attract money in the US market. For this purpose, it has to initiate the issuing of American depositary receipts for being listed on the NYSE. This procedure will be as follows:
  • A broker from the US buys shares of a Japanese company via its international branch in Japan and then forwards them to a local custodian bank.
  • A depository bank (the US) confirms that it received and deposited base shares in a custodian bank. Now, instead of them, a bank can issue depositary certificates.
  • A specific number of base shares are consolidated into a single DR. This number is defined after considering different economic factors, including the exchange rate of the Japanese Yen against the American dollar.
  • A broker that acts as an intermediary between an issuing company and the US stock exchange receives American depository receipts and lists them on the NYSE — now American investors can invest their money in shares of a Japanese company.
What types of depositary receipts there are

As a rule, they are classified in terms of the market where they are traded.
  • Global depositary receipts (GDR) are traded on several international markets at once. The more stock exchanges quote global depositary receipts of a specific foreign company, the more investors have a chance to invest in its shares.
  • American depositary receipts (ADR) are traded only on the US exchanges, such as NYSE, AMEX, and NASDAQ. Dividends are paid in US dollars.
  • Canadian depositary receipts (CDR) are derivatives that are traded on the Canadian stock exchange. CDRs are voting securities and imply dividend payouts.
  • Brazilian depositary receipts (BDR) are certificates on foreign stocks available on the Brazilian stock exchange. They are backed by shares or other securities kept in a foreign custodian bank.
1. Sponsored depositary receipts are issued on the initiative of a company that issued base shares. This company enters into an agreement with a depository, according to which it takes the responsibility to unveil financial information.

A depository is an intermediary between an issuer and investors. Such securities are also considered voting securities, just like ordinary shares.

2. Unsponsored depositary receipts are issued by one or several depositories without any official agreement with a foreign company. These certificates are issued on already floating securities.
However, since they do not imply a company’s involvement, they are mostly traded on over-the-counter markets and are not considered voting securities.

Read more at R Blog - RoboForex

Sincerely,
RoboForex team
 
How to Calculate Future Value of Money: Formulae, Calculator, Examples

Author: Andrey Goilov

8-1-1536x662.jpg


Dear Clients and Partners,

Today we will talk about the concept of the time value of money: what types there are, which advantages and drawbacks it has.

Moreover, we will discuss what we need to know to calculate the value of money in the future. In the article, you will find not only the calculation formulae but also understandable examples explaining all the details and a ready-made instrument – a calculator of future money value.

What is future value

As early as the Middle Ages, people noticed some correlation between money and time. There exists a concept of time value of money. By this concept, the sum made today has more value than the same sum received tomorrow. The idea is based on the possibility to get some income over a certain timeframe after investing your money under some interest.

Current value is the cost of the asset today, and potential value over a certain timeframe plus interest is called the future money value. To calculate this parameter, you need a formula.

However, it must be noted that calculation of future money value may differ in different situations. If your asset is on a savings account with a guaranteed interest rate, its value in the future is rather easy to calculate. However, if we take a look about stock market investments with unstable profitability, calculation will be complicated because of certain extra parameters.

Moreover, calculations usually neglect inflation and other factors that have negative influence over the asset price.

What types of future value there are

The main classification is based on interest calculation:
  • Simple interest calculation implies constant speed of growth and one payment in a certain investment period.
  • Complex interest calculation is applied to the total balance of all investments over certain time. The investor makes money not on the initial investment but on the whole account balance.
How to calculate future value of annuity

If an investor plans to invest a certain sum every month or year, calculation of the annuity future value will help to understand how much they will have in the end.

The formula of future value calculation looks as follows:

FV=C×[((1+I)N−1)/I]

C is the sum of investment

I is the interest rate

N is the number of payments.

Example of calculating future value of annuity

Imagine your investment plan implies a series of 5 payments, 10,000 USD each every year under the interest of 10%. The calculation of the future annuity value will be:

FV=10000×[((1+0.1)5−1)/0.1]

The future annuity value will be 61,051 USD.

How to use calculator of future investment value

Choosing an investment option, you need to account for not only your goals but also the time they will take to be reached. Having a general idea of how much money and for how long you need to invest it, you can choose an optimum option. You can decide on a more serious risk when you have the resources or stay conservative when your resources are limited.

And to know the future value of your asset, you can use a ready-made instrument – a calculator of future investment value. Just put in your current data and push the button, and you will get the result.

Read more at R Blog - RoboForex

Sincerely,
RoboForex team
 
Dear traders!

This week, the ContestFX project, as usual, continues with the following competitions on demo accounts:

The 137th competition of "Demo Forex" has been running since the beginning of the month.
The 375th competition of "Week with CFD" has just started.
The 509th competition of "Trade Day" will start on 24.08.2022, at 12:00.
The 423rd competition of "KingSize MT5" 25.08.2022, at 20:00.

Let us remind you that all winners of our contests receive prize money to their real trading accounts, and they can use them to perform trading operations on the Forex market without investing their own financial savings.

We wish you a winning trend!

Sincerely,
RoboForex Contest
 
RoboForex: important information in view of Tesla's stock split on 25 August 2022

roboforex-header.jpg


Dear Clients and Partners,

On 25 August 2022, Tesla will have its stocks go through a split. A stock split is a corporate action, as a result of which the company increases the number of issued shares by a specific multiplier and reduces the value of each share by the same multiplier.

Tesla will conduct a 3-for-1 stock split (1 share will be split into 3).

How will this affect positions and orders?​

If you have open positions in Tesla shares or plan to open such positions, please pay attention to the following changes, which will be effective as of 25 August 2022:

MetaTrader 4 / MetaTrader 5 accounts

The split procedure will take place on 25 August and will be completed prior to the US Stock session's start at 16:30 (server time).
  • All pending orders (Buy Limit, Buy Stop, Sell Limit, Sell Stop, Buy Stop Limit, Sell Stop Limit, Stop Loss, and Take Profit) in TSLA will be cancelled.
  • For positions in TSLA, the opening price will be divided by 3.
  • The volume of each open position in TSLA will be multiplied by 3.
Please note that if you are using an Expert Advisor (EA), we suggest that you check with its developers whether its code needs any modifications to ensure the correct interpretation of the price data after the stock split.

R StocksTrader accounts

The split procedure will take place on 25 August and will be completed prior to the US Stock session's start at 16:30 (server time).
  • During the split procedure, all active pending orders (Buy Limit, Sell Limit, Stop Loss, and Take Profit) in TSLA (CFD) and TSLA.nq will be cancelled.
  • For positions in TSLA (CFD) and TSLA.nq opened before the split, the opening price will be divided by 3.
  • The volume of all open positions in TSLA (CFD) and TSLA.nq will be multiplied by 3.
  • All positions in any of these instruments in the same direction and on the same account will be combined into one new position. This new position will have the opening price and a volume based on an average weighted price of all positions held before the split.
The historical charts in your trading terminal will be updated to reflect the new prices of the above-mentioned instruments.

All other aspects of trading conditions shall remain intact. Please take this information into account when planning your trading activity.

Sincerely,
RoboForex team
 
How to Use Dow Theory in Technical Analysis

Author: Andrey Goilov

12_2-1536x662.jpg


Dear Clients and Partners,

There is an opinion that modern tech analysis is based on the Dow theory, and today we will speak about this unique Charles Dow’s theory that still remains quite efficient. Also, we will discuss how this approach can be used in trading.

What is Dow theory

A series of Dow’s articles in the Wall Street Journal helped William P. Hamilton, Robert Rhea, and George Schaefer design a market research theory.

The Dow theory is an approach to trading based on six principles. The main focus is on price highs and lows that help detect the current trend. Also, each outer factor, such as news or random events, is supposed to be already incorporated in the price. The Dow theory in technical analysis remains topical these days as well.

Initially, the principles were used for the railway and industrial indices only that were included in the Dow Jones Industrial Average. However, some research proves the efficacy of the principles for the stock market as well.

For example, Martin Pring in his book Technical Analysis Explained wrote that the stocks from the Dow Jones index bought in 1987 for 44 USD could have yielded about 2,500 USD of profit if sold in 1990.

Charles Dow theory principles

As said above, the whole of the Dow theory is based on six principles. Let us take a look at each of them in a more detail.

Market cares for everything

All events and factors have already been taken account of by the market and included in the price. Absolutely any event that might happen, even a disaster or an earthquake, is valid. The principle is also known as “Market depreciates everything”.

For example, if a company is getting ready to present a great report, the market is likely to account for it even before the report appears. In other words, the demand for the shares of the company will grow in advance, and after the report is published, the growth might stop.
Moreover, the quotes might fall when a strong report is published because the report might turn not as great as expected

There are three types of trend

Charles Dow defined the trend but never made a focus on uptrends, downtrends, and flats as in classical tech analysis. Nonetheless, his definition of the trend remains efficient. It says that in an uptrend, each next high and low is higher than the previous one. In this principle of the Dow theory the length of trends is estimated:
  • A primary trend lasts for longer than a year, sometimes for several years. It is supposed that the main mass of investors in the stock market looks for a primary trend chiefly.
  • A secondary trend, a.k.a. intermediate trend, lasts from three weeks to three months. It might reach up to 50% of correction of the primary trend.
  • A small trend lasts for no more than three weeks. It consists of minor fluctuations inside a secondary trend. In modern trading, it is mostly called a short-term trend.
Dow theory in technical analysis

Charles Dow theory is quite easy to adapt to modern markets. Jesse Livermore said that markets are moved by the psychology of market players. Though there have appeared new markets, psychology has never changed; hence, the patterns and laws discovered by Charles Dow on charts will be working in the future as well.

What do you think about the Dow theory plus Forex? Indeed, these days it is used in Forex as well. For example, we trade the trend and combine different timeframes for signal search.

Trend reversals that appear when the price cannot renew the previous high often lead to the appearance of such patterns as the Head and Shoulders and Double Top.

And if we trade a bullish trend, some traders who use tech analysis think that one should buy when the price breaks through a high or nears the preceding low. If the trend is strong, a breakaway of the high can push the price further up and will not let the price fall below the previous low.

There might be no direct correlation between the Dow theory and Forex, but most often the ideas of price behaviour described above coincide with the analysis practises by modern traders. With graphic patterns, forecasts by the Dow theory can be made.

Read more at R Blog - RoboForex

Sincerely,
RoboForex team
 
Dear traders!

This week, RoboForex's project called ContestFX invites you to the following competitions:

The 137th competition of "Demo Forex" has entered the final phase.
The 376th competition of "Week with CFD" has just started.
The 510th competition of "Trade Day" will start on 31.08.2022 at 12:00.
The 424th competition of "KingSize MT5" will start on 01.09.2022 at 20:00.

If you've never taken part in our contests before, trust me, it's easy to do it: go through a simple registration procedure, and get access to any of the competitions you like in just a couple of mouse clicks

Join us, it won't be boring!

Sincerely,
RoboForex Contest
 
How to Trade by Antitrend Strategy

Author: Andrey Goilov

16-1536x662.jpg


Dear Clients and Partners,

Not all traders like to trade the trend: there are deep corrections able to kick even a most patient investor out of the market. When trading against the trend, the results of a trade take much less time to wait for. And if the trader masters catching reversals, risks will also be small.

Pic-1-1.png


A trading strategy called the Antitrend strategy allows looking for such signals in stock indices. For successful work, only one indicator is needed, set up especially for the DAX index, the most important stock index in Germany.

The article explains how to trade with the Bulls Power indicator, what peculiarities selling and buying trades have, and how Stop Loss and Take Profit can be placed.

What Antitrend strategy is like

By the Antitrend strategy, trading occurs on H4. Signals will be few but quite noticeable – on smaller timeframes, the number of false signals is overwhelming.

The strategy is based on using a not-so-popular indicator Bulls Power with a standard period. The instrument calculated the difference between an Exponential Moving Average with period 13 and the high of the price.

Pic-2-1.png


If the trend is bullish, the bars of the indicator are above zero, growing. This means buyers are strong, they have enough power to renew highs. And if the trend is bearish, indicator values drop below zero and are declining, demonstrating bearish pressure.

It is recommended to enter a trade only when Bulls Power reaches certain levels. For buying and selling, these levels are different. This tactics is applicable to all global indices but the levels are designed for the DAX index.

Closing thoughts

The Antitrend strategy is meant for trading the DAX stock index at strong impulses on an H4 chart. Signals will be few because levels for the Bulls Power indicator are extreme, and the timeframe is large.

However, this is more like an advantage for traders who do not want to enter the market frequently: they will be free of spending a lot of time before charts, constantly analysing price movements.

The rules for the strategy are extremely simple, and risk management is efficient because the profit-to-risk ratio is 3 to 1. Hence, such tactics can be used as an option for additional earnings.

Read more at R Blog - RoboForex

Sincerely,
RoboForex team
 
RoboForex: upcoming changes to the trading schedule in view of the Labor Day

roboforex-header.jpg


Dear Clients and Partners,

We are informing you that changes will be made to the trading schedule due to the Labor Day in the US.

This schedule is for informational purposes only and may be subject to further change.

MetaTrader 4 / MetaTrader 5 platforms

Schedule for trading on US indices (US30Cash, US500Cash, and USTECHCash) and the Japanese index J225Cash
  • 5 September 2022 – trading stops at 7:45 PM server time.
  • 6 September 2022 – trading starts as usual.
Schedule for trading on Metals (XAUUSD and XAGUSD) and CFDs on oil (Brent and WTI)
  • 5 September 2022 – trading stops at 7:45 PM server time.
  • 6 September 2022 – trading starts as usual.
Schedule for trading on CFDs on US stocks
  • 5 September 2022 – no trading.
  • 6 September 2022 – trading starts as usual.

R StocksTrader platform

Schedule for trading on US stocks and ETFs
  • 5 September 2022 – no trading.
  • 6 September 2022 – trading starts as usual.
Schedule for trading on CFDs on US stocks and ETFs
  • 5 September 2022 – no trading.
  • 6 September 2022 – trading starts as usual.
Schedule for trading on CFDs on US indices (US500, US30, and NAS100) and the Japanese index JPY225
  • 5 September 2022 – trading stops at 7:45 PM server time.
  • 6 September 2022 – trading starts as usual.
Schedule for trading on Metals (XAUUSD and XAGUSD) and CFDs on oil (WTI.oil, BRENT.oil)
  • 5 September 2022 – trading stops at 7:45 PM server time.
  • 6 September 2022 – trading starts as usual.

cTrader platform

Schedule for trading on Metals (XAUUSD and XAGUSD)
  • 5 September 2022 – trading stops at 7:45 PM server time.
  • 6 September 2022 – trading starts as usual.
Please take note of the above trading schedule changes when planning your trading activity.

Sincerely,
RoboForex team
 
Dear traders!

This week, the ContestFX project will continue with the following competitions:

The 138th competition of "Demo Forex" and the 377th competition of "Week with CFD" have just started.
The 416th competition of "Trade Day" will start on 07.09.2022 at 12:00.
The 425th competition of "KingSize MT5" will start on 08.09.2022 at 20:00.

All winners of our contests receive prize money to their real accounts using which they can perform trading operations on the Forex market without investing their own financial savings.

Don't miss your chance to be one of them!

Sincerely,
RoboForex Contest
 
Trading Like Sperandeo: 1-2-3 Reversal and 2B Pattern

Author: Victor Gryazin

sperandeo.png


Dear Clients and Partners,

In this article, we will discuss the trading methods of a famous Wall Street trader Victor Sperandeo. A long-time experience of trading on exchanges and managing investments as well as several books on trading have brought Sperandeo the popularity he deserves.

How to draw a trend line?

According to the definition from tech analysis, a trend is a period when the price is moving mostly in one direction, either growing or declining. In other words, a trend is a price movement in one direction. A trend can be explained by economic, political factors or force majeure events.

Sperandeo singles out three types of a trend in terms of its length; they can be active simultaneously and move in opposite directions:
  • Short-term trend lasts from several days to several weeks, 14 work days on average
  • Mid-term trend lasts from several weeks to several months
  • Long-term trend lasts from several months to several years.
Any of this trends can be traded; traders usually aim at short- and mid-term trends while investors – on mid- and long-term ones. To trade reversal patterns, we need the market to move in an up- or downtrend.

An uptrend is a price move in which each next high is higher than the previous one and each next low is also higher than the previous one.
A downtrend is characterized by each next high and low being lower than the previous one.
An important aspect of trend analysis is drawing the trendline. When the price breaks out the trendline, it signals the beginning of a correction or a trend reversal. For drawing the trendline, the following rules are used:
  • The trendline in an uptrend is drawn on the chart through 2 points: the first point is the low preceding the absolute high of the trend; the second point is the first low the uptrend has started from. If the trendline crosses the chart, the second point (the farthest low) is transferred to the next closer low for the trendline not to cross the price chart.
sperandeo-trendline-uptrend-1046x630.png


Trend reversal 1-2-3

The rule of Sperandeo trend reversal 1-2-3 comes into force when the price chart breaks out the trendline. This is the first signal of a possible trend reversal, which may precede a 1-2-3 reversal. Below, we will discuss in detail the rules of formation of this reversal and trading it in an up- and downtrend.

A 1-2-3 reversal in an uptrend
  • Find an actual uptrend on the price chart and draw a trendline.
  • After the trendline is broken out, name the high preceding the breakout as point 1 and the low formed after the breakout – point 2.
  • After point 2 is formed, a new ascending impulse in the direction of the trend forms. A short-term exceeding of point 1 is possible (it is called a false breakout) – it must be followed by a strong pullback down. The new high is named point 3.
  • The 1-2-3 reversal comes into force if the price goes further down renewing the low in the point 2. Open an selling position, putting an SL above point 3.
sperandeo-123-uptrend-1049x630.png

We have described an original conservative way of trading a 1-2-3 reversal by Victor Sperandeo. Sometimes, I use a more aggressive way of trading – I trade right after point 3 is formed. The signal might be a false breakaway or some Price Action reversal pattern. This is less trustworthy because the reversal has not been confirmed yet (point 2 has no been broken out) but this method allows to enter the market with a smaller SL and a more profitable profit to loss ratio.

Read more at R Blog - RoboForex

Sincerely,
RoboForex team
 
Top