• The Forex, Binary Options Forum - welcomes you to our Community!

    DigitalCashPalace Forum is dedicated to discussions about Forex, Binary Options, commodities, stocks related.

    Please take a look around, and feel free to .

RoboForex - roboforex.com

Divergence and Convergence in Trading: How to Use Signals

Author: Victor Gryazin

3.jpg


Dear Clients and Partners,

This article is devoted to such terms as divergence and convergence as well as their use in trading.

What is divergence

Divergence is the instance when the price chat diverges with the used trading indicator. This looks as follows: in an ascending movement the price chart forms a new high that is higher than the previous one while the indicator shows a high that is no higher than the previous one. This inequality might mean that the bulls are losing power, so next thing a descending correction or even a reversal follows.

A classic divergence consists of two highs of the price chart and two corresponding highs of the trading indicator. One of the most popular indicators for catching divergences is the MACD (Moving Average Convergence/Divergence).

diver-1-1012x630.png


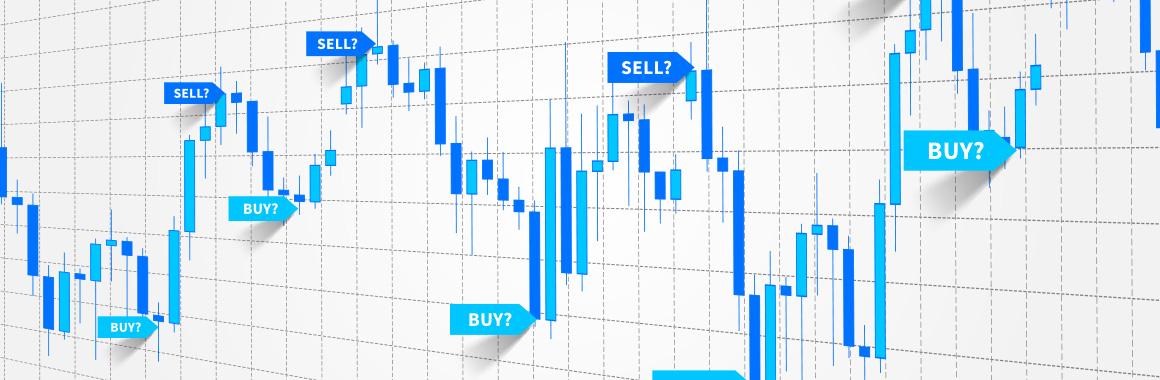
How to use convergence and divergence in trading

A divergence or a convergence on the chart is considered a useful trading signal. Many traders fish for them to open or close their positions.

To catch convergences/divergences, various indicators can be used, the most popular of them being the MACD, RSI, and Stochastic. Convergences/divergences can be traded on any highly liquid assets, on timeframes from H1 and higher.

How to sell with divergences

When a divergence appears, it gives a signal to sell: the quotes set a new local high but the indicator does not confirm it. However, quite often signals from divergences go against the current trend, giving a good reason for closing profitable positions because a reversal becomes too possible.

As for opening new positions against the trend, here one needs to be extremely careful. Beginners should rather abstain from this. To open new positions, divergences during corrections are better. If there is a correction of a downtrend, and a divergence appears in the meantime, this is a good signal to sell. Positions should be open by the current trend

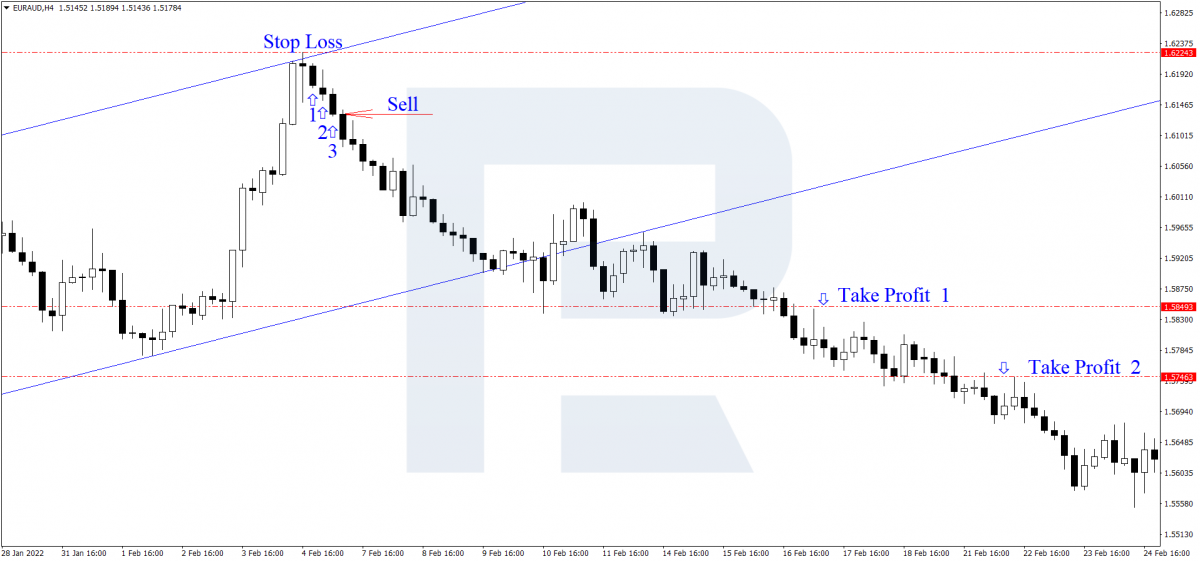
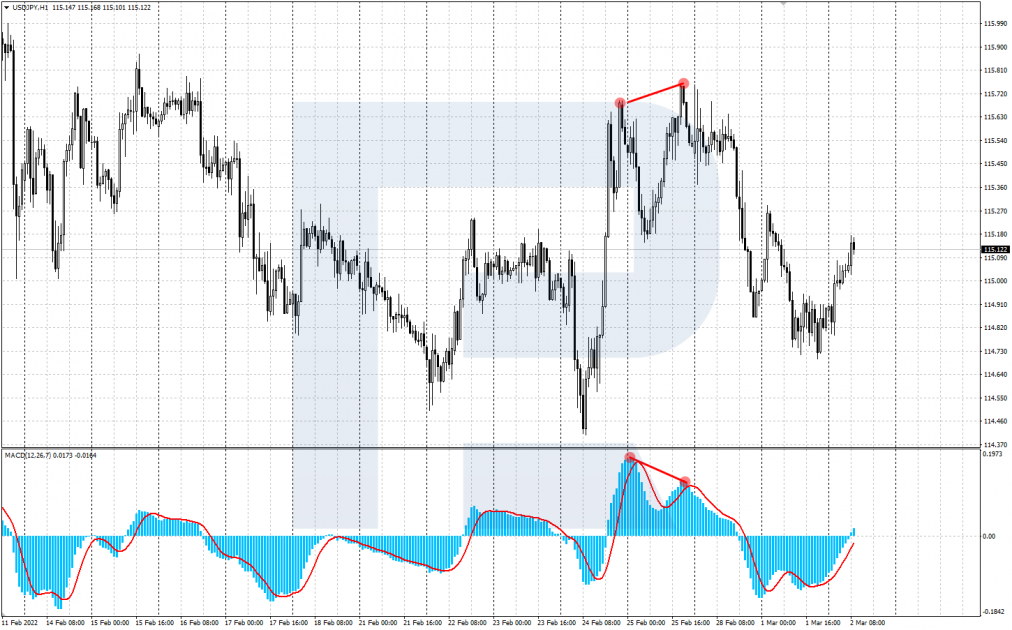
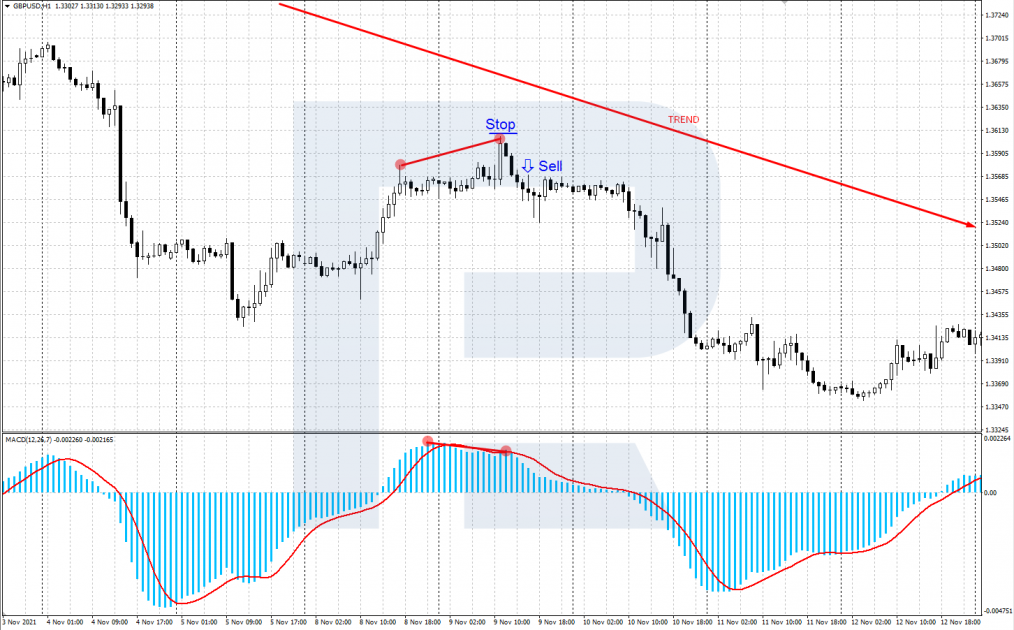
Example of selling by a divergence
  • On H1 of GBP/USD in an ascending correction the MACD signaled about a divergence.
  • After a local high formed and the price reversed downwards, a selling position by the trend can be opened.
  • Stop Loss is to be placed behind the last high, and Profit can be taken as soon as a strong support level is reached.
diver-sell-1014x630.png


Bottom line

Divergence and convergence stand for the process of diverging/converging of the price chart and the trading indicator. These are good trading signals used for opening and closing positions.

To make signals more efficient, the divergence/convergence should be used alongside other instruments of tech analysis. Before trading for real, practice on a demo account.

Read more at R Blog - RoboForex

Sincerely,
RoboForex team
 
Why ChargePoint Shares Are Interesting Investment

Author: Eugene Savitsky

5.jpg


Dear Clients and Partners,

Every year, more and more electric cars are sold all over the world. In 2021, 6.75 million electric cars were sold, i.e. 120% more than in 2020. If not for the shortage of semiconductors, the result would have been even more stunning. Today the overall number of sold electric cars in the world reaches almost 16 million, which is 8.5% of all vehicles.

For comfortable driving, electric cars require lots of charging points. The demand for the development of charging stations network makes companies from this segment quite appealing for investments. The leader of the segment is ChargePoint Holdings Inc. (NYSE: CHPT). This is the corporation that this article is devoted to.

What we know about ChargePoint Holdings

This company, founded in 2007, makes equipment and software for charging electric vehicles. As checked on 31 January 2022, Charge Point Holdings manages the world’s largest network of charging stations – 174,000 stations in 16 countries. 51,000 out of them are situated in Europe.

The company has carried out 13 rounds of investments, and the list of those eager to invest in its development features, among other companies, Daimler AG, BMW Siemens AG, Chevron Corp, Toyota Motor Corp, American Electric Power, Canada Pension Plan Investment Board, Singapore GIC, and Chevron Technology Ventures.

Note the participation of Canada Pension Plan Investment Board and Singapore GIC. Such large and conservative trusts investing in the company means that they consider ChargePoint promising.

Moreover, Canada Pension Plan Investment Board and Singapore GIC can now lobby the interests of the company in their home countries. This will not only let the American company increase its presence in the market but also step further away from the nearest rival – such as Blink Charging Co. (NASDAQ: BLNK).

Tech analysis of ChargePont Holdings shares

ChargePoint Holdings shares are trading in a downtrend, and here is an explanation of why it is normal. After the agitation of 2020, the shares of the corporation grew by 220% to 50 USD, and the capitalization reached 16.5 billion USD. However, the revenue at that time only reached 40 million USD.

To compare: the capitalization of ROKU Inc. (NASDAQ: ROKU) is now 16.7 billion USD, while its quarterly income is 865 million USD, and the net profit is 23 million USD.

The share price of ChargePoint Holdings did not stay at such levels for long and started descending gradually. The first strong support level at which market players started buying the shares was at 20 USD and stayed there for long. The quotations tested it 4 times, bouncing off each time and then rising by 30-85%.

chpt-1200x620.png


Now the resistance level of 15.5 USD should be noted, and a breakaway of this will be the first signal for possible growth of the price to 20 USD. And then, if the quotations manage to rise over 20 USD, the trend might reverse and start a long-term uptrend. This breakaway will mean a breakaway of the descending trendline.

Closing thoughts

ChargePoint Holdings is the leader in the market of electric car chargers. The growth in the sales of electric cars will provoke stable increased demand for the produce of the company.

Currently, investments in ChargePoint Holdings can be regarded as long-term. The risk here is an increase in the interest rate of the Fed that will make the debts of the company also grow. For now, this is the only weak point.

Read more at R Blog - RoboForex

Sincerely,
RoboForex team
 
Dear traders!

This week, RoboForex's project called ContestFX invites everyone to take part in the following competitions:

The 132nd competition of "Demo Forex" kicked off seven days ago.
The 352nd competition of "Week with CFD" has started today.
486th competition of "Trade Day" will start on 16.03.2022 at 12:00.
400th competition of "KingSize MT5" will start on 17.03.2022 at 20:00.

If you want to enter the Forex market without an initial deposit, it's time to win in our demo competitions. All winners of our competitions get prize money credited to their real accounts, so they can use them to earn on the Forex market without investing their own savings.

Good luck to all!

Sincerely,
RoboForex Contest
 
How to Use Standard Deviation Indicator in Trading

Author: Victor Gryazin

18.jpg


Dear Clients and Partners,

Today the article is devoted to the Standard Deviation indicator. It helps evaluate the dynamics of volatility of a financial instrument and find promising entry points.

What the indicator shows

Standard Deviation (STDev) is a trading instrument that shows how far the price of a financial instrument deviates from standard values of a certain period. It shows the deviation from a Simple Moving Average and thus helps to assess the change in the price volatility.

The indicator conditionally belongs to trend ones: when it grows, this might mean the beginning of a new market trend. The higher the volatility and the more the price fluctuates from the average over the chosen period, the higher STDev values will be. And vice versa: if the quotes are stable, trading in a narrow price range, indicator values will fall to the lows.

STDev can be used for trading on its own and alongside other indicators. Also, it is used inside more complicated indicators. For example, it can be found in a famous channel indicator Bollinger Bands: STDev helps to calculate the borders of the price range for the quotes.

Standard Deviation appears in a separate window under the chart and has just one main line. Its values start with 0 and always remain positive, i.e. never drop under 0.

The indicator does not show trend direction. The line will grow alongside the growth of volatility regardless of the market direction, equally when the quotes are growing and falling.

stdev-1004x630.png


How to install Standard Deviation

Standard Deviation is built in the majority of popular trading platforms. To install it on the chosen price chart on the MetaTrader 4 and MetaTrader 5 platforms, go to the Main Menu. Your algorithm is: Main Menu – Insert – Indicators – Trend – Standard Deviation.

You can customize the following settings:
  • Period is the period for which the indicator will be calculated. By default, it is 20.
  • Apply to: choose the price that calculations will be based on. By default, it is Close.
  • MA method is the calculation method for the MA. By default, it is Simple.
  • Style sets the appearance of the line. You can change its color, width, and representation method.
stdev-settings-en-1003x630.png


Calculating Standard Deviation

To calculate the indicator, use the following formula of statistic average square deviation:

Standard Deviation = Sqrt (SUM ((CLOSE - SMA (CLOSE, N)) ^ 2, N) /N)

Where:

Read more at R Blog - RoboForex

Sincerely,
RoboForex team
 
What Are Decentralized Finance

Author: Andrey Goilov

19.jpg


Dear Clients and Partners,

Decentralized Finance (DeFi) are an alternative to the traditional banking sector. It includes blockchain apps and services that facilitate digital transactions between the participants directly, without intermediaries. As the crypto community thinks, the current financial system is obsolete, it lacks transparency, and is highly controlled.

DeFi replaces traditional technology by open source protocols, granting access to financial services to anyone. The systems are maintained by the users. Meanwhile, the projects remain open and free of regulators that can block a transaction or deprive a user of access to a certain service.

Services feature crediting, investments, and buying crypto. Thanks to DeFi, those institutions that used to process operations slowly and be prone to human mistakes, became automatic and safe. DeFi provides passive income from storing crypto and save money on transactions and credits.

How DeFi is different from traditional finance

To understand the idea of DeFi and their popularity, it is important to see the difference between it and centralized, or traditional, finance. Here are the main issues of the banking sector that DeFi solves today:
  • Banking services are not available to everyone
  • Financial services include hidden payments
  • Transaction take time.
  • Financial entities have work hours.
In the classic banking sector, money is stores in banks and other financial institutions, the only goal of which is making money. Transactions are processed by third party services that charge fees for their intermediary functions.

Read more at R Blog - RoboForex

Sincerely,
RoboForex team
 
RoboForex received the “Best Stocks Broker Global” award

london-award.jpg


Dear Clients and Partners,

We’re happy to share the good news: RoboForex is recognised as the "Best Stocks Broker Global 2022" by The London Trader Show Awards. It’s an annual conference in London, where market professionals gather to discuss different trends in financial instrument trading. The event also implies awarding brokers for their quality products and services. The winners are decided by a vote among experts, which is held throughout the month before the conference starts

  • Over 12,000 instruments
    Stocks, Indices, and other popular exchange-traded and OTC assets.

  • Best trading solutions
    Trading operations can be performed through reliable terminals, such as MetaTrader 4 and MetaTrader 5, as well as the R StocksTrader multi-asset platform.

  • Charge-free additional materials
    RoboForex clients have access to a rich knowledge base and quick analytical tools.
Moving forward is our style!

The RoboForex team keeps a close eye on new trends in the industry and follows up on suggestions of the company’s clients and partners. A growing number of awards says that our products and services get better and meet the requirements of the market.


Thank you for choosing RoboForex and helping us to improve. Each of the Company’s successes is our common victory!


Sincerely,
RoboForex team
 
Dear traders!

This week, the ContestFX project will continue with the following exciting competitions on demo accounts:

The 132nd competition of "Demo Forex" has gained "full speed".
The 353rd competition of "Week with CFD" has just started.
At 12:00, March 23rd, 2022, starts the 487th competition of "Trade Day".
At 20:00, March 24th, 2022, starts the 401st competition of "KingSize MT5".

We remind you that to participate in any of our competitions, just go through a simple registration procedure once and then you'll get access to the chosen competitions with just a couple of mouse clicks.

We're looking forward to your joining in and wish you a winning trend!

Sincerely,
RoboForex Contest
 
How to Trade Three Black Crows Candlestick Pattern

Author: Maks Artemov

12.jpg


Dear Clients and Partners,

In candlestick analysis, all patterns can be divided into two groups – trend continuation patterns and reversal patterns. Today, the article is about the Three Black Crows pattern belonging to the second group. This is definitely not the most frequent pattern on the chart yet experienced traders who use candlestick analysis are well acquainted with it.

How Three Black Crows pattern forms

After a lengthy ascending impulse and a lot of purchases market players start closing their positions. The price forms a minor gap, and the first candlestick out of the three comprising the pattern opens above the previous closing price or at the same level.

Then the second candlestick opens at the close level of the first one, and after it closes in its turn, the third candlestick opens. The opening price of the third one coincides with the closing price of the second one or belongs somewhere close to this level. Next, the trend reverses.

Conditions for Three Black Crows
  • There is a lengthy ascending movement of the quotes.
  • The pattern forms at the resistance level.
  • The three candlesticks are of roughly the same size.
  • Three candlesticks successively forming on a smaller timeframe, form one big Engulfing candlestick on a larger one.
  • Each next candlestick opens at the close level of the previous one or a bit higher.
  • Shadows of the candlesticks are relatively small or totally lacking.
Three-crows-1-1200x561.png


Examples of using Three Black Crows

This pattern can be used both alongside other means of analysis and on its own. Indicators act as additional filters that enhance trade efficacy.

Example of selling by the pattern without indicators
  • On the EUR/AUD chart, there has formed a Hanging Man.
  • After that, at the top of the uptrend, there formed Three Black Crows.
  • When the third candlestick closes, open a selling position at the fourth candlestick.
  • Stop Loss is to be placed at the nearest high.
  • Place the TP as 1:3 against the SL. In this case, the SL is 900 points and the TP 1, accordingly – 2,700 points.
  • Later, when the price approaches the TP 1, the trader can place a TP 2 at the next support level.
  • The trader can monitor the position and move the SL to the positive zone when necessary.
Three-crows-2-1200x561.png


Bottom line

Before using Three Black Crows, the trader needs to study all of its conditions and peculiarities. The strategy is t be tested alongside other means of market analysis.

For example, the trader can try out those indicators they are used to. This will help filter signals from Three Black Crows.

Read more at R Blog - RoboForex

Sincerely,
RoboForex team
 
How to Use Correlation Calculator for Currency Pairs

Author: Victor Gryazin

11.jpg


Dear Clients and Partners,

This overview is devoted to the issue of correlation of currency pairs, counting it with a special calculator, and using it in trading.

What is currency pair correlation

In finance, correlation is a statistical measurement of how two assets move one against another. In other words, this is the capability of one financial instrument follow another one. For example, gold and silver have high correlation.

The idea of currency correlation represents the connections between currency pairs in Forex, the dependence of their movements one from another. Correlation demonstrates whether two pairs fluctuate similarly: the higher the correlation, the more in run are the two pairs. Currency pairs with strong correlation move somewhat in unison.

Positive correlation

Positive (or direct) correlation means that quotes go in the same direction – up or down.

For example, strong positive correlation is demonstrated by EUR/USD and EUR/CAD. In the picture below it is obvious that the quotes of these pairs often go in one direction, and their charts look quite similar.

correlation-direct-1002x630.png


How to calculate correlation indices

To assess the correlation of two instruments, there is a special index. It is estimated in shares, or percent: 100% = 1 for positive correlation and -1 for negative.

For calculating the index, Pearson’s formula is used. First, a set of values of both assets is formed – X and Y. Then average X and Y values are calculated. Next, they add up the product of the deviation of each set from the average and divide them by the product of the standard deviation.

The values of the correlation index are between +1 and -1.

The meaning of the values is as follows:
  • 0 – no correlation. Currency pairs show no dependence on one the other.
  • +1 – full positive correlation. Two currency pairs go in one direction, coinciding in movement size.
  • -1 – full negative correlation. Two currency pairs go in the opposite directions, coinciding in movement size.
Risks of using correlation in Forex

It should be noted that correlation between two currency pairs is not a stable and constant factor. It can change with time. Different political and social crises, unexpected changes in credit and monetary policies can alter the normal correlation at any moment, so that it stops working normally.

So, when using correlation in trading, the trader has to follow their risk management rules. Correlation can be used as some sort of a filter alongside classical fundamental and tech analysis. Before using correlation for real, practicing on a demo account is highly recommended.

Read more at R Blog - RoboForex

Sincerely,
RoboForex team
 
Dear traders!

This week, the RoboForex company's project called ContestFX is waiting for you to participate in the following competitions:

The 132nd competition of "Demo Forex" has reached the "finish line".
The 354th competition of "Week with CFD" has started today.
488th competition of "Trade Day" will start on 30.03.2022 at 12:00.
402nd competition of "KingSize MT5" will start on 31.03.2022 at 20:00.

All winners of our competitions receive funds to their real trading accounts, which they can use to perform trading operations on the Forex market without investing their own financial savings required as the first deposit.

Don't miss your chance to be one of them!

Sincerely,
RoboForex Contest
 
How to Calculate ROA: Formula and Examples

Author: Maks Artemov

4.jpg


Dear Clients and Partners,

This article is devoted to the market multiplier called ROA: what it is necessary for, how it is calculated, what peculiarities, drawbacks, and advantages it has, and how it can be used.

What is ROA multiplier

ROA (Return on Assets) is the multiplier that shows the profitability of assets. It expresses the ratio of the net profit and the average-weighted size of the assets, demonstrating the efficacy of using the capital of a company. It is expressed in percent.

Calculation formula of ROA

ROA = Net Profit / Average Assets

Where:
  • Net Profit is the net profit of the company over the calculation period. The latter is usually a year or a quarter.
  • Average Assets is the average-weighted size of the assets of the company.

Average Assets calculation formula:

Average Assets = (Assets 1 + Assets 2) / 2

Where:
  • Assets 1 is the size of the assets at the beginning of the calculation period.
  • Assets 2 is the size of the assets at the end of the calculation period.
Nowadays it is hardly necessary to calculate the ROA manually because this information is available in open sources.

Peculiarities of ROA

The ROA differs depending on the sector in which the company works and the nature of its business. For example, in services, the ROA will be higher than in the oil industry.

The reason is the working capital that companies need for functioning and production. The more the company spends on development, the smaller ROA it will have over a calculation period.

The intermediate conclusion is that comparison by the ROA can be accurate and correct only for companies working in one sphere of business. And the higher the ROA, the better for the company and its investors.

Closing thoughts

As many other multipliers, the ROA has its drawbacks and advantages. The multiplier can only give a prelim evaluation of the return on investments in the company, Optimum analysis should include several multipliers and financial reports of the company.

Read more at R Blog - RoboForex

Sincerely,
RoboForex team
 
Dear traders!

This week, the ContestFX project will continue with the following competitions on demo accounts:

The 133rd competition of "Demo Forex" and 355th competition of "Week with CFD" have just started.
489th competition of "Trade Day" will start on 06.04.2022 at 12:00.
403rd competition of "KingSize MT5" will start on 07.04.2022 at 20:00.

To take part in our competitions, it is enough to go through a simple registration procedure and then you'll get access to any competition with just a couple of mouse clicks.

We wish good luck to all of you!

Sincerely,
RoboForex Contest
 
What It is Important to Know about NFT in 2022

Author: Andrey Goilov

17.jpg


Dear Clients and Partners,

Last year, when people started selling NFT for millions of dollars, these digital assets became a new investment option. Some investors remained skeptical, while others became quite confident that non-fungible tokens would change the market.

For example, Twitter founder Jack Dorsey sold the tokenised version of his first personal tweet for $3 millions. For your information, he put up for sale a tweet saying “just setting up my twitter”, and the demand was insane.

What is NFT crypto token

Non-Fungible Tokens are unique blockchain-based digital assets the, among other things, have peculiar metadata. NFTs are coded by the same software that is used for digital currencies. They are sold and bought on digital platforms for crypto.

The NFT technology is used for creating a unique digital certificate of a valuable thing, such as a painting, photo, music, video, and even real estate. Moreover, tokenising tangible assets makes buying them more efficient and fraud-safe.

Current popularity of NFT crypto tokens is explained by how easy they are to buy. In December last year, there were NFTs sold for $12 billion.

How NFT differs from crypto

NFT and crypto have two obvious similarities: both are digital currencies and blockchain-based. However, digital money is fungible, and crypto exchange confirms it.

Moreover, each altcoin remains valuable regardless of the platform it was bought on. For example, each BTC equals any other BTC.

A less obvious common feature of NFT and crypto are speculation markets that create agitation around currency prices. The price of a token depends on demand: when the token is popular, the price grows, when the demand shrinks – the price follows it.

Types of NFT

In most cases, non-fungible tokens are created from tangible or non-tangible objects. Most popular options are virtual and physically existing real estate, sport events, and gaming accessories.

Real estate

Apartments and houses have unique furnishing and decoration, which means they satisfy the conditions of NFT. There are already examples of selling real estate as NFTs.

Now NFT companies can gather money for building a new apartment complex by selling ownership to individual investors as NFTs. Then those investors will be able to sell their NFTs to next investors while the real estate is being built.

Virtual real estate

Metaverse is a digital reflection of the real world, and the demand for it is growing all too fast. An example of NFTs in metaverse is the Decentraland project.

This is a three-D gaming world where gamers buy virtual land plots and build houses on them. Each land plot is a non-fungible token. Investors recommend keeping an eye on this market: virtual towns are built much faster than real ones.

What perspectives NFT market has

Flourishing growth provoked overwhelming skepticism of market experts, and many of them still insist on NFTs being a trivial bubble. However, these days such global brands as Nike or Microsoft keep experimenting with NFTs and the metaverse.

Analysts declare that NFTs and crypto will eventually be a part of the metaverse, and NFTs will integrate in the virtual world much faster. This idea is confirmed by the strong concern of global brands about digital assets.

Read more at R Blog - RoboForex

Sincerely,
RoboForex team
 
Dear traders!

This week, the ContestFX project traditionally continues with the following competitions:

The 133rd competition of "Demo Forex" started last week.
The 356th competition of "Week with CFD" has started today.
490th competition of "Trade Day" will start on 13.04.2022 at 12:00.
404th competition of "KingSize MT5" will start on 14.04.2022 at 20:00.

We remind you that every winner of our demo competitions receives funds to their real trading account as a reward, so they could use them to earn on the Forex market without investing their financial savings.

If you want to be one of them, join us!

Sincerely,
RoboForex Contest
 
How to Trade Three White Soldiers Pattern

Author: Victor Gryazin

25.jpg


Dear Clients and Partners,

This article deals with a candlestick pattern called Three White Soldiers: what it looks like, what signals it gives, how it forms, what types it has, and, of course, how it can be used in trading.

How Three White Soldiers pattern forms

Three White Soldiers is a reversal bullish candlestick pattern that predicts a change of a downtrend to an uptrend. This pattern can be encountered on price charts rather often.

When the Three White Soldiers pattern appears, it gives a signal to buy. The pattern has a bearish counterpart called Three Black Crows that was previously described in our blog.

The Three White Soldiers pattern consists of three white candlesticks with large bodies and almost no shadows. The pattern shows that the bulls have managed to capture the initiative and close trading sessions near the daily highs for three days in a row.

Conditions for Three White Soldiers to form
  • As long as this is a reversal pattern, it forms on the local lows after a descending movement. This can either be a reversal of a downtrend or the end of a correction in an uptrend.
  • Three white candlesticks go one after another and have large bodies.
  • Each next candlestick opens at the closing level of the previous one or a bit lower.
  • The shadows of the candlesticks are short. Sometimes candlesticks in Three White Soldiers have no shadows at all: such candlesticks are called Marubozu and make the whole pattern stronger.
  • The second and third candlesticks must be roughly of the same size. If the third candlestick is obviously smaller than the other two, this means bulls are weak.
3soldiers.png


Types of Three White Soldiers

There are two more candlestick patterns that also consist of three white candlesticks and resemble Three White Soldiers. These are the Advance Block pattern and the Stalled pattern; however, instead of giving a signal to buy, they warn the trader of the ascending momentum coming to an end.

Advance Block

If the second and third candlesticks of the Three White Soldiers have small bodies and long upper shadows, the pattern is called Advanced Block. As the name of the pattern shows us, the advance of the bulls was blocked and the bears fight back.

The ascending impulse meets serious resistance, and it becomes extremely possible that the quotations will reverse downwards. This pattern is not good for buying because bulls turn out weak. If the trader has open buying positions, they should take the profit in them.

3soldiers-type1.png


Closing thoughts

The reversal candlestick Three White Soldiers pattern forms after a downward movement and predicts an upward reversal of the quotes. It can be traded on its own or alongside tech analysis instruments and indicators.

Before using the pattern for real, test it on a demo account. See more about candlestick patterns in our Blog.

Read more at R Blog - RoboForex

Sincerely,
RoboForex team
 
RoboForex: upcoming changes to the trading schedule in view of the Easter holidays

roboforex-header.jpg


Dear Clients and Partners,

We are informing you that due to the Easter holidays in the US and Europe, there will be some changes to the trading schedule on Catholic Good Friday and Easter Monday.

This schedule is for informational purposes only and may be subject to further change.

MetaTrader 4 / MetaTrader 5 platforms

Schedule for trading on Currency pairs
  • 15 April 2022 - trading stops at 7:40 PM server time
  • 18 April 2022 - trading as usual
Schedule for trading on CFDs on the US indices (US30Cash, US500Cash, USTECHCash) and the Japanese index JP225Cash
  • 15 April 2022 - no trading
  • 18 April 2022 - trading as usual
Schedule for trading on CFD on the German index DE40Cash
  • 15 April 2022 - no trading
  • 18 April 2022 - no trading
  • 19 April 2022 - trading as usual
Schedule for trading on Metals (XAUUSD, XAGUSD) and CFDs on oil (Brent, WTI)
  • 15 April 2022 - no trading
  • 18 April 2022 - trading as usual
Schedule for trading on CFDs on US stocks
  • 15 April 2022 - no trading
  • 18 April 2022 - trading as usual
R StocksTrader platform

Schedule for trading on Currency pairs
  • 15 April 2022 - trading stops at 7:40 PM server time
  • 18 April 2022 - trading as usual
Schedule for trading on US stocks and ETFs, CFDs on US stocks and ETFs
  • 15 April 2022 - no trading
  • 18 April 2022 - trading as usual
Schedule for trading on CFDs on US indices (US500, US30, NAS100)
  • 15 April 2022 - no trading
  • 18 April 2022 - trading as usual
Schedule for trading on CFDs on EU and UK indices (GER30, UK100, FRA40, SPA35), Australian index AUS200 and Japanese index J225
  • 15 April 2022 - no trading
  • 18 April 2022 - no trading
  • 19 April 2022 - trading as usual
Schedule for trading on CFDs on EU and UK stocks (except Danish, Norwegian, and Swedish stocks)
  • 15 April 2022 - no trading
  • 18 April 2022 - no trading
  • 19 April 2022 - trading as usual
Schedule for trading on CFDs on Danish, Norwegian and Swedish stocks
  • 13 April 2022 - no trading
  • 14 April 2022 - no trading
  • 15 April 2022 - no trading
  • 18 April 2022 - no trading
  • 19 April 2022 - trading as usual
Schedule for trading on Metals (XAUUSD, XAGUSD) and CFDs on Crude Oil (BRENT.oil, WTI.oil)
  • 15 April 2022 - no trading
  • 18 April 2022 - trading as usual
cTrader platform

Schedule for trading on Currency pairs
  • 15 April 2022 - trading stops at 7:40 PM server time
  • 18 April 2022 - trading as usual
Schedule for trading on Metals (XAUUSD, XAGUSD)
  • 15 April 2022 - no trading
  • 18 April 2022 - trading as usual
Please take note of the above trading schedule changes when planning your trading activity.

Sincerely,
RoboForex team
 
RoboForex adds 7 new cryptocurrencies

rf-crypto-banner-news.jpg


Dear Clients and Partners,

RoboForex now offers 7 new cryptocurrencies to invest in: ALGOUSD, AVAXUSD, BNBUSD, LUNAUSD, MANAUSD, MATICUSD and UNIUSD. All these pairs are already available on the MetaTrader 4, MetaTrader 5, and R StocksTrader platforms.

Investing in Cryptocurrencies with RoboForex means:

  • 24/7 access to more than 30 crypto instruments
    BTC, ETH, BNB, LTC, BCH, LUNA, XRP, and others.

  • A single account for all investments
    You won’t need another wallet or account at a crypto exchange.

  • Conditions at the level of crypto exchanges
    The commission for cryptocurrencies on Prime accounts is 0.1%.
Cryptocurrencies are a promising investment trend, which is chosen by a lot of clients at RoboForex. Therefore, we plan to continue adding new crypto instruments to our existing list and enhancing investment conditions.


Sincerely,
RoboForex team
 
Dear traders!

This week, the RoboForex company's project called ContestFX is waiting for everyone to participate in the following competitions on demo accounts:

The 133rd competition of "Demo Forex" has gained "full speed".
The 357th competition of "Week with CFD" has just started.
491st competition of "Trade Day" will start on 20.04.2022 at 12:00 at 12:00.
405th competition of "KingSize MT5" will start on 21.04.2022 at 20:00.

To become a participant in our competitions, you need to go through a simple registration procedure just once - it will open access to participation in any of the competitions in just a couple of mouse clicks.

We're looking forward to your joining in and wish you good luck!

Sincerely,
RoboForex Contest
 
How to Trade Three Line Strike Candlestick Pattern

Author: Victor Gryazin

10.jpg


Dear Clients and Partners,

This article is devoted to a candlestick pattern called Three Line Strike, its type, forming principles, and use in trading.

How Three Line Strike forms

The Three Line Strike candlestick pattern is not a frequent guest on price charts. It appears at the local high/low in an uptrend/a downtrend.

The pattern consists of four candlesticks: the first three candlesticks have medium-sized bodies and the same colour, while the fourth one has a different colour, demonstrating a reversal, and a big body that fully covers the bodies of the first three candlesticks.

Some sources describe this one as a trend continuation pattern, but the logics of candlestick analysis suggest that this is a reversal one.

This article is based on the approach of a famous trader Thomas Bulkowski and his book “Encyclopedia of Candlestick Charts”. He considers this pattern to be a reversal pattern: according to his research, the price has a 84% probability of a reversal after this pattern appears on the chart.

When the pattern appears on the chart, this means the current trend is getting weaker as it has encountered strong opposition. The large reversal candlestick that with its body covers up the three preceding candlesticks forecasts a correction that can later turn into a real reversal.

Types of Three Line Strike

Depending on the place where the pattern appears and the colors of its candlesticks, two types of the Three Lines Strike can be singled out – the bullish and bearish ones.

Bullish Three Lines Strike

It forms after an ascending price movement at the local highs of the chart. It consists of three white candlesticks with middle-sized bodies and a large black candlestick, whose bode covers all the three preceding ones.

The large black candlesticks means that bears have captured the initiative and are ready to counterattack. Further decline of the quotes means the beginning of a descending correction. The decline should be confirmed by the price falling below the last low of the bearish candlestick of the pattern.
3strike-bullish.png


Bearish Three Line Strike

It appears in a descending movement at the local lows of the chart. It consists of three black bearish candlesticks with medium-sized bodies and one white large candlestick, whose body covers up the bodies of the three preceding candlesticks.

The large white candlestick means that bulls have managed to stop bears and are ready to reverse the quotes. Further growth of the price leads to the beginning of an ascending correction. The ascending movement should be confirmed by growth of the quotes above the high of the last white candlestick.

3strike-bearish.png


Bottom line

The Three Lines Strike pattern forms after a descending or an ascending movement and forecasts a reversal of the quotes. In certain sources, this pattern is considered a trend continuation pattern, yet Thomas Bulkowsli in his research has demonstrated that the probability of a reversal after this pattern appears is 84%.

The pattern can be used for trading either on itself or alongside other instruments of tech analysis and indicators. Before using the Three Lines Strike for real, make sure you back-test it.

Read more at R Blog - RoboForex

Sincerely,
RoboForex team
 
Richard Wycoff Trading Method

Author: Timofey Zuev

1.jpg


Dear Clients and Partners,

As trading kept developing, various methods and instruments for it also got to perfection. And today, when humanity is enjoying the internet, trading has become available to anyone, even if they do not have money. However, getting started is the hardest part for any beginner.

Why so? The internet is full of methods, ways, strategies, indicators, and advisors that, unfortunately, do not always work properly. So, the beginner gets lost in the variety of methods and trading strategies, for getting about the basics that trading is based on.

The Wycoff method used to be popular in the times of the trader himself because it was "different". Richard Wycoff never listened to analysts, experts, economists, and the like because at that time analysis was based on bare charts, nothing else. Wycoff, nonetheless, was sure that the price was moved by all market participants, so the future of the price was "in people's minds".

According to Wycoff, the trader must be some sort of a detective and calculate, based on the chart and volumes, who is controlling the market (the bulls or bears), after which they could attack this or that instrument. Psychology also plays its part here: for people, it is much easier to do their job when they are interested. And when the job becomes mere routine, people lose grip, so their productivity suffers

This approach made the Wycoff method popular nowadays, though no one apparently uses it "in the virgin form". However, many methods used by professional traders all over the world are based on Wycoff's system. It is applicable to all trading instruments: stocks, currencies, options, futures, etc. As for timeframes, the method is very good for intraday traders.

Main principle of the Wycoff trading method

The main task of the trader is to make conclusions about how their trading instrument (stocks, option, currency) will behave in the fight of demand and supply. To do it, the price chart and volumes are quite enough.

Then the trader finds possible tops (for a bullish trend) and bottoms (for a bearish trend). Also, make notice of correctional price movements because trading consists of certain cycles of purchases and sales. One cycle (wave) will last while new participants join in. As soon as the cycle is worn out, a reverse process starts, and the price goes in the opposite direction. All this can be seen on the chart.

As the creator of the method used to say, if you master it once, you will need a few minutes to make a forecast of future price movements.

You can find more about the system in a book by J.Hutson "The Wycoff Method". It is available on the internet.

Read more at R Blog - RoboForex

Sincerely,
RoboForex team
 
Top