• The Forex, Binary Options Forum - welcomes you to our Community!

    DigitalCashPalace Forum is dedicated to discussions about Forex, Binary Options, commodities, stocks related.

    Please take a look around, and feel free to .

RoboForex - roboforex.com

RoboMarkets is named the "Leading European Indices Broker"

rm-head__news.jpg


Dear Clients and Partners,

RoboMarkets has won "Leading European Indices Broker" award according to Global Forex Awards. The award ceremony took place on October 3rd 2019 in Limassol, the Republic of Cyprus.


bd6bcb93cb58.png

Reception of this respected award is the result of continuous improvements of trading conditions for trading indices introduced by RoboMarkets team throughout the year of 2019. We’re very proud that our efforts in this area were highly appreciated by the professional trading community.


"Leading European Indices Broker" award is another motivation to keep up the speed of our development and provide the Company’s clients and partners with the most competitive trading conditions and services.

Sincerely,
RoboMarkets team
 
Changes in trading schedule (Unity Day)

roboforex-header.jpg


Dear Clients and Partners,

We’re informing you that due to the public holiday in Russia (Unity Day) on November 4th 2019, the USDRUB currency pair will be traded according to the changed schedule*.

Trading schedule on USDRUB

  • November 4th, 2019 - no trading.
  • November 5th, 2019 - trading starts as usual.
Starting November 5th, 2019, the instrument will be available for trading as usual. Please, take into account these changes in schedule when planning your trading activity.

* – This schedule is for informational purposes only and may be changed.

Sincerely,
RoboForex team
 
Last edited:
RoboMarkets/RoboForex Group held a conference called “Systematic approach in investing”

head-news.jpg


Dear Clients and Partners,
RoboMarkets/RoboForex Group organized and sponsored “Systematic approach in investing”, a conference that took place on October 19th 2019 in Minsk.

The conference featured recognized experts in the financial area, such as Zdenek Zanka, Alexei Lutsayev, and Filippo Macaluso, who brought up the following topics in their presentations:
  • Stock market: artificial intelligence in service with a portfolio manager.
  • Risk Management and Trading: How to deal with Uncertainty and Black Swan from retail trader prospective.
  • Building and testing algorithmic strategies without programming.
The event included theoretical and practical studies, panel discussions, as well as coffee break and networking. A special appearance was made by Andrei Kulebin, a successful Belarus Muay Thai fighter and a kickboxing world champion, who told guests about his challenges in sport and took pictures with everyone who wanted.

The conference was held in a roomy hall of the “Beijing” hotel absolutely for free. On the event day, attendees had an opportunity to use MeYou, an online service, to take part in different surveys and put questions to organizers and speakers. The service was actively used by more than 70% of visitors.

"During the conference, we managed to create a favorable atmosphere for sharing knowledge and experience, and I’m sure our event made a weighty contribution to development of professional investor community in the Republic of Belarus."
Andrei Dziarnovich, RoboForex BY CEO

Sincerely,
RoboForex team
 
What Do You Know About Forex Trading Strategies?

Author: Timofey Zuev

roboforex-header.jpg


Dear Traders,

Before talking about strategies, it would be better to find out what strategies exist at all, which strategy suits which trader and what strategy to choose. Searching for your best strategy through trial and error may take years, that is why this issue requires a systemic approach.

Mechanical and discretionary strategies

mechanical-automatic-strategies.jpg


First of all, strategies can be divided into two groups: mechanical and discretionary ones. A mechanical strategy will require from a player nothing else but disciplined trading, because decision-making is built in the very algorithm of the strategies. The advantage of such strategies is the lack of emotional involvement into trading and of feeling responsible for its result: all steps are prescribed by the algorithm. Drawbacks are the very same – in case the market changes, the algorithm may start generating losing trades that the trader will have to perform without question, watching their money disappear.

As you may see, being a mere executor is not that easy. If the trader does not understand the market and the reasons for making certain steps, this may let them down, because at some point they may start sabotaging the prescribed trades. However, if you have created the strategy yourself and you are sure that it is based on the fundamental rules of the market, it will be much easier to follow such strategy. My experience and that of my fellow traders suggests that the most successful strategies are those that blend in mechanical algorithms and independently made decisions...

Read more at R Blog

Sincerely,
RoboForex team
 
Netting vs. Hedging: What Is The Difference?

roboforex-header.jpg


Dear Traders,

Many traders who use Forex terminals have come across a situation when they fail to place a lock and their open order is closed.

Another type of such a situation: when a second position on an instrument is open, the first position increased its volume for no obvious reasons. The explanation may be simple: the account could have been open by the Netting system.

The Netting system allows only one position open in any direction for one instrument. The system is used all over the stock market. To put it simpler, the trader cannot open selling and buying position on one instrument simultaneously - the positions mutually close, the orders open in one direction summing up.

The Hedging system allows as many open positions in different directions as you wish.

Why are there two types of accounts?

netting-and-hedging-accounts.jpg


The answer is simple. The Netting system was initially used for trading on stock markets. After the Forex market appeared, there was an attempt to make trading and controlling open positions simpler. This allowed traders to use different strategies on one account. Let us discuss the two systems in detail, looking at a couple of examples.

Let us discuss the two systems in detail, looking at a couple of examples.

Read more at R Blog

Sincerely,
RoboForex team
 
RoboForex: changes in trading schedule (Thanksgiving Day in the USA)

roboforex-header.jpg


Dear Clients and Partners,

We’re informing you that due to the celebration of Thanksgiving Day in the United States of America, several instruments will be traded according to the changed schedule*.

RoboForex

Trading schedule on CFDs on oil (WTI, Brent), Metals (XAUUSD, XAGUSD), and US indices (US500Cash, US30Cash, USTECHCash)
  • November 28th, 2019 – trading stops at 7:40 PM server time.
  • November 29th, 2019 – trading stops at 8:14 PM server time.
Trading schedule on US stocks
  • November 28th, 2019 – no trading.
  • November 29th, 2019 – trading starts as usual.
  • November 29th, 2019 – trading stops at 7:59 PM server time.

R Trader

Trading schedule on CFDs on US stocks and ETFs on US indices (US500, US30, NAS100)
  • November 28th, 2019 – no trading.
  • November 29th, 2019 – trading starts as usual.
  • November 29th, 2019 – trading stops at 7:59 PM server time.

Please, take into account these changes in schedule when planning your trading activity.

* – This schedule is for informational purposes only and may be changed.

Sincerely,
RoboForex team
 
RoboForex adds the netting position accounting system to R Trader

rf-news__netting-system-rtrader-112019.jpg


Dear Clients and Partners,

RoboForex has added the netting position accounting system to R Trader terminal. Earlier, the platform offered the hedging accounting system only.

From now on, you can choose a more preferable accounting system when opening a new R Trader account.

What is the difference between Netting and Hedging?

Netting is a classic position accounting system, which allows you to have only one position in the same instrument in any direction.

The hedging system allows to open multiple positions in the same instrument in different directions.


To find out what accounting system your account has, check the account list in R Trader terminal or in the account card in your Members Area.


Sincerely,
RoboForex team
 
Top 10 Forex Indicators That Every Trader Needs

Author: Victor Gryazin

roboforex-header.jpg


Dear Traders,

Indicators have long been introduced to the trading systems of many traders. As a minimum, they are of good help in chart analysis, as a maximum, they are the base of the whole trading system. Algorithmic trading, which means automatizing the work and creating trading robots, is also mostly based on the signals of various indicators.

In this article, we will review the ten most popular indicators for the analysis of and trading on financial markets.

Moving Average

It will hardly be too bold to say that the Moving Average is the queen of all indicators, as it is among the simplest and the most popular ones. Apart from the immediate use, it serves as the base for some more complicated indicators.

The Moving Average is the average price indicator for a certain period. There are several types of Moving Averages: the simple, exponential, smoothed, linear weighted ones. They are slightly different in terms of calculating but their essence remains the same: they demonstrate the dynamics of the averaged price during a certain period.

A Moving Average is represented as a line directly on the price chart. It shows the direction of the trend well: a declining MA indicates a downtrend, while a growing MA means an uptrend. To get trading signals, we normally use two or more Mas for different periods.

ma-eurusd-d1-1055x630.png


Fibonacci The indicator is based on the well-known sequence of numbers of an Italian mathematician Fibonacci (Leonardo of Pisa). It uses the relations of the numbers in the sequence...

Read more at R Blog - RoboForex

Sincerely,
RoboForex team
 
Signals on Forex: Where to Search, How to Find, Filter, and Create

Author: Dmitriy Gurkovskiy

roboforex-header.jpg


Dear Traders,

What is a signal on Forex?

If we try to describe briefly how a newcomer starts trading, the scenario of the market entry will be more or less the same. First, they study general information about markets, their laws of pricing; then the beginner trader gets acquainted with the trading platform and the work with orders in practice, and then they dive into the world of analysis and trading systems.

At this stage, they have to choose their paradigm, style, the viewpoint for their future work on the market. There are two main paradigms: the Stochastic (which includes forecasting, foretelling, or guessing the price direction) and algorithmic (which includes trading along with an algorithm and money management) ones.

Whatever the side the beginner takes, they will inevitably have to find certain patterns of market behavior signals for situation changes, as well as to make trading decisions. Thus, we may see that the basis of any trading model is the signal.

On Forex, under a signal, we mean a complex of circumstances, indicators, and events that show the trader in which direction they should open a trade, in other words, whether they should buy or sell.

n each paradigm, signals form and look different but many people mix them up. The Stochastic paradigm is based on statistical and fundamental data. In other words, it tries to answer a general question: “Which way: up or down?”, ignoring more detailed ones, such as: “Up or down to which level?”, “Where to put an SL?”, “What is the lifespan of the supposed movement?”, or “What to do after the SL?”.

The algorithmic paradigm, on the contrary, tries to define the level, on which a trade is worth opening, and the levels of the Take Profit and Stop Loss. We can even find the answer, though not very exact, to the hardest question about the perspectives of the movement.

Where to find signals? Signal types

Lagging signals

Before discussing where to find signals for trading, we should find out how they form. Let us have a look at a classical example of two Moving Averages crossing.

macross-1029x630.png


In this example, we may see that the signal from the technical indicators forms on the chart after the reversal of the trend. Such a signal can be called lagging because it is preceded by a serious change of price dynamics.

For an earlier signal, the timeframe and the number of candlesticks should be in line. This means that on a longer timeframe a smaller amount of candlesticks is better analyzed.

Read more at R Blog - RoboForex

Sincerely,
RoboForex team
 
How to Buy Apple, Uber, Facebook Stocks from a Broker: Simple Guide

Author: Victor Gryazin

roboforex-header.jpg


Dear Traders,

A stock is a security representing a share of the company that has issued it. Stocks give their owner (the stockholder) the right for a share of the company's income in the form of dividends; the right to participate in managing the company; the right for a part of the company's property in the case of its liquidation.

Why we buy stocks?

Stocks are one of the most popular investment instruments. Apart from the small dividend income, they also allow the owner to make money on the changes in their price. If the company is developing and the economic situation is good, the stock will be growing in price, bringing a decent income to its owner.

Stocks are normally bought on the stock market via a broker. A broker is a company, a professional market player, that is licensed to make operations on the stock market for its clients. At a broker, the client opens a trading account where they buy and sell stocks.

How much can be earned on the stock growth?

For successful investing, you should learn to evaluate the perspectives of the company the stocks of which you are going to buy. For this, there exist certain economic indicators, which the companies publish in their regular reports. Also, the overall political and economic situation in the world is to be assessed whether stock markets are growing or correcting.

As an example, let us take buying of the stocks of a world-famous company Apple. The corporation regularly demonstrates good economic results, and its stocks have been growing stably for years.

apple-m-1200x604.png


This January, the stocks were trading at $150.00 per stock. Today, the price is $266.70. So, this year the growth has been around $117 per stock. In percent, the result is even more impressing: if we had bought the stocks in January, the profit by now would have been 78%! Plus, some dividends.

Read more at R Blog - RoboForex

Sincerely,
RoboForex team
 
Copy trading: What Is It? Comparing PAMM and RAMM

Author: Victor Gryazin

roboforex-header.jpg


Dear Traders,

In this review, we will get acquainted with a popular way of trading that allows you to earn on copying the trades of professional traders, which is called copy trading. It suits those who are not ready to devote themselves to trading fully but who want to make a profit using the experience of successful managers.

What is copy trading? How to make money on it?

copy-trading3-1.jpg


Copy trading is one of the ways of investing that implies copying on your account the trades of experienced traders. The mechanism is quite simple and easy to master.

First thing, you need to make up your mind about the service you will be using. Most services are based on well-known broker companies. In the article “How to Choose your Broker: Guide for Beginner Trader” you can find the criteria for deciding upon the company.

Upon registering in the chosen system, you need to study trading in detail and choose one or more trustworthy traders and launch copying their trades on your account. You also must set the parameters of copying, limit the risks and specify the fee for the manager.

You must choose the trader with great accuracy. Make sure they have a good trading history (the longer, the better), the profit level satisfies you, the maximal drawdown is acceptable, and the deposit increase is stable. To diversify risks, you can join several successful managers with different strategies.

Later, you will be able to follow the copying of trades to your account in real-time. If with trading your deposit grows, congratulations: you have made the right choice. If the balance shrinks, and the statistics of the trader’s work worsens, you will have to think about changing the trader.

Read more at R Blog - RoboForex

Sincerely,
RoboForex team
 
How to Swing-Trade On Forex?

Author: Dmitriy Gurkovskiy

roboforex-header.jpg


Dear Traders,

Many of you have heard about swing trading but never know that they are swingers themselves (we mean, swing traders but not what you have just thought). In this article, let us look into swing trading.

Some history about swing trading

Swing trading is an approach to financial markets that appeared quite a long time ago. It should be3 noted that this is not a system but a style of trading. This means it can contain several tactics and strategies of market behavior.

The approach was described in the 50s of the last century by George Douglas Taylor in his book The Taylor Trading Technique. This method was designed for the stock market, first and foremost, but became equally popular in other segments. In the term “swing trading,” we can interpret swing either as “moving at a steady pace” and “closing a trade successfully” or as “being suspended,” which stands for high risks.

Like any other approach, swing trading uses the price change for making a profit on market operations. The position may remain on the market from several hours to several days. Swing trading requires professionalism and self-possession.

Such a style allows exiting the trade after accumulating enough profit and stay away while the market demonstrates short-term but intense surges of volatility. If you do not have enough time form trading intraday and do not want to miss the money that has appeared on the market than swing trading is definitely for you.

1_eurusd-swings-962x630.png


The principle of swing trading

The main principle of swing trading is moving along with the current trend. In other words, a swing trader avoids the periods of correction on the market but tries to take part in all impulse, swinging movements.

In general, the rule is: buy after the pullback, lock in profit after the trend reversal. One of the signals to close the trader is a breakout of the support line.

Read more at R Blog - RoboForex

Sincerely,
RoboForex team
 
RoboForex: changes in trading schedule (Christmas and New Year holidays)

roboforex-header.jpg


Dear Clients and Partners,

We’re informing you that during Christmas and New Year holidays, instruments will be traded according to the changed schedule*.

RoboForex

Trading schedule on DE30
  • From December 24th, 2019 to December 26th, 2019 – no trading.
  • December 27th, 2019 – trading starts as usual.
  • From December 31st, 2019 to January 1st, 2020 – no trading.
  • January 2nd, 2020 – trading starts at 10:00 AM server time.
Trading schedule on other instruments
  • December 24th, 2019 – trading stops at 7:00 PM server time.
  • December 25th, 2019 – no trading.
  • December 26th, 2019 – trading starts at 10:00 AM server time.
  • December 31st, 2019 – trading stops at 8:00 PM server time
  • January 1st, 2020 – trading starts at 10:00 AM server time.
  • January 2nd, 2020 – trading starts at 10:00 AM server time.

R Trader

Trading schedule on GER30
  • From December 24th, 2019 to December 26th, 2019 – no trading.
  • December 27th, 2019 – trading starts as usual.
  • From December 31st, 2019 to January 1st, 2020 – no trading.
  • January 2nd, 2020 – trading starts at 10:00 AM server time.
Trading schedule on UK100, SPA35, FRA40
  • December 24th, 2019 – trading stops at 12:00 PM server time.
  • From December 25th, 2019 to December 26th, 2019 – no trading.
  • December 27th, 2019 – trading starts as usual.
  • December 31st, 2019 – trading stops at 12:00 PM server time.
  • January 1st, 2020 – no trading.
  • January 2nd, 2020 – trading starts as usual.
Trading schedule on Stocks, ETFs, CFDs on Stocks and ETFs
  • December 24th, 2019 – trading stops at 8:00 PM server time.
  • December 25th, 2019 – no trading.
  • December 26th, 2019 – trading starts as usual.
  • January 1st, 2020 – no trading.
  • January 2nd, 2020 – trading starts as usual.
Trading schedule on other instruments
  • December 24th, 2019 – trading stops at 7:00 PM server time.
  • December 25th, 2019 – no trading.
  • December 26th, 2019 – trading starts at 10:00 AM server time.
  • December 31st, 2019 – trading stops at 8:00 PM server time.
  • January 1st, 2020 – no trading.
  • January 2nd, 2020 – trading starts at 10:00 AM server time.
Please, take into account these changes in schedule when planning your trading activity.

* – This schedule is for informational purposes only and may be changed.

Sincerely,
RoboForex team
 
Defining the Market State and Possible Reversals with DeMarker Indicator

Author: Victor Gryazin

roboforex-header.jpg


Dear Traders,

In this review, we will get acquainted with the DeMarker indicator. It was created for exchange trading by a famous trader and the guru of tech analysis Thomas DeMark.

DeMarker description and peculiarities

The DeMarker indicator was named after its creator, an outstanding exchange player and the author of many technical indicators Thomas DeMark. The indicator assesses the current state of the prices compared to the previous period, helps to define the market state, and find the place of a possible reversal.

DeMarker belongs to the group of normalized oscillators; its values lie between 0% and 100%; 100% is marked as 1. Unlike many other oscillators, DeMarker pays more attention to intermediate highs and lows rather than closing prices. The algorithm of the indicator compares the current highs and lows on the price chart with the extremes of the preceding period.

Like any other oscillator, DeMarker demonstrates the current state of the market:

  • If the indicator line is growing and demonstrates another high, it indicates an active uptrend and an overbought state of the market.
  • If the indicator line is declining, forming local lows on the chart, there is a downtrend and an oversold state of the market.
The indicator is displayed in a separate window under the price chart; it looks like a line moving between 0 and 1. The area above 0.7 is called the overbought area where a reversal downwards may form. The area below 0.3 is called the oversold area, where we may consider buying. The DeMarker indicator is included in most of the popular trading platforms.

demarker-998x630.png


DeMarker indicator

Calculation formula and settings

To add the indicator to the chart of the chosen instrument in MetaTrader 4 or MetaTrader 5, open it vie the Main Menu: Insert – Indicators – Oscillators – DeMarker.

The algorithm for calculating highs and lows (DeMax and DeMin) is based on comparing the highs/lows of the current period to the highs/lows of the preceding period. If the high of the current candlestick is higher than the preceding one, the corresponding difference is calculated.

If the current high is lower than the previous one or equal to it, the value is zero...

Read more at R Blog - RoboForex

Sincerely,
RoboForex team
 
How to Trade Three-Drive (Three Indians) Pattern?

Author: Maks Artemov

roboforex-header.jpg


Dear Traders,

Today, we will discuss yet another trend strategy called Three-Drive or Three Indians. It may have other names but the idea of the strategy and its signals remains the same.

From the name of the strategy, we may conclude that it is based on technical analysis. This means that to use it successfully, you need to understand the support and resistance levels, the trend, and, perhaps, the classical candlestick analysis.

What do you need to know before using the strategy?

Define the trend

Let us first discuss the main concepts that the trader will need for using this strategy, starting with the trend. A trend is a directed price movement.

It may be of one of three types:
  • Uptrend
  • Downtrend
  • Flat
An uptrend is a directed price movement, in which each next low is higher than the previous one. To put it simply, on the chart, we see the price growing, pulling back at times, looking like a wave with increasing peaks.

up-trend-1-1200x561.png


Uptrend

A downtrend is a directed price movement, in which each high is lower than the preceding one. In this case, the price on the chart also looks like a wave, declining with periodical pullbacks.

down-trend-2-1200x561.png


Downtrend

A flat is a horizontal price movement. In this case, highs and lows remain at more or less the same level. About this movement, we may also say that the price is moving in a horizontal channel.

Read more at R Blog - RoboForex

Sincerely,
RoboForex team
 
RoboForex reduces the minimum lot and the step for trading Indices

roboforex-header.jpg


Dear Clients and Partners,

Starting from May 14th, 2020, RoboForex is reducing the minimum lot and order volume step for trading Indices. Thanks to these innovations, Indices can be traded with lower margin requirements, while orders in the CopyFX platform will be copied with higher accuracy.

New conditions for trading Indices

  • Minimum order volume (lots): 0.01.
  • Minimum order volume step (lots): 0.01.

Reduction of the minimum lot and order volume step is another step in the Company's extensive work aimed to provide its clients with the most competitive conditions for trading Indices in the industry.

Please note that improved conditions for trading Indices may require you to adjust your Expert Advisor settings or review your trading strategies. We kindly ask you to take these changes into account when planning your trading operations.


Sincerely,
RoboForex team
 
Walt Disney and Sony Stocks: Will Entertainment Industry Survive?

Author: Maks Artemov

roboforex-header.jpg


Dear Traders,
There are plenty of companies and corporations in the entertainment sphere, and all of them are noticeable to some extent. However, today I have picked up the companies that are suffering from COVID-19, as many others are, but manage to stay the course. Its The Walt Disney Company (NYSE: DIS) and Sony Corporation (NYSE: SNE).

They are the giants of entertainment, video, and television. Each company has its activity streams but they are united in one sphere - the entertainment industry, in which they are the leaders. Each corporation has its specialties that help not only to survive the crisis but only make a profit in an unstable market situation.

Now, let us consider these companies and their stocks separately and compare the fundamental data to tech analysis. We will try to draw parallels between the corporations and forecast their future market behavior.

The Walt Disney Company

When the quarantine began, many people all over the world stopped going to the cinema and amusement parks; the Walt Disney Company was the one to suffer first, nonetheless, the company found a way out.

Fundamental analysis of Disney

The growth of the number of clients on the streaming platforms somewhat compensates for a lack of them in the amusement parks: from the end of March till the beginning of May 2020, the number of the subscribers of Disney+ online services grew from 33.5 million to 54.5 million, which was a record for the company.

It should be mentioned that the Disney platform is a serious rival to Netflix: it may not harm the latter gravely but will for sure play on the nerves. The reason for which Disney may not push Netflix out of the market is the fact that they have different subscribers.

Switching to online entertainment will help Disney cover up the significant losses that it suffers from the amusement parks and other offline entertainment facilities lying idle. During the last financial year, the income of Disney grew by 20.7% per annum. I think this is a serious promise of future success. These days, many of the company's rivals are struggling to minimize their losses, only dreaming about a profit.

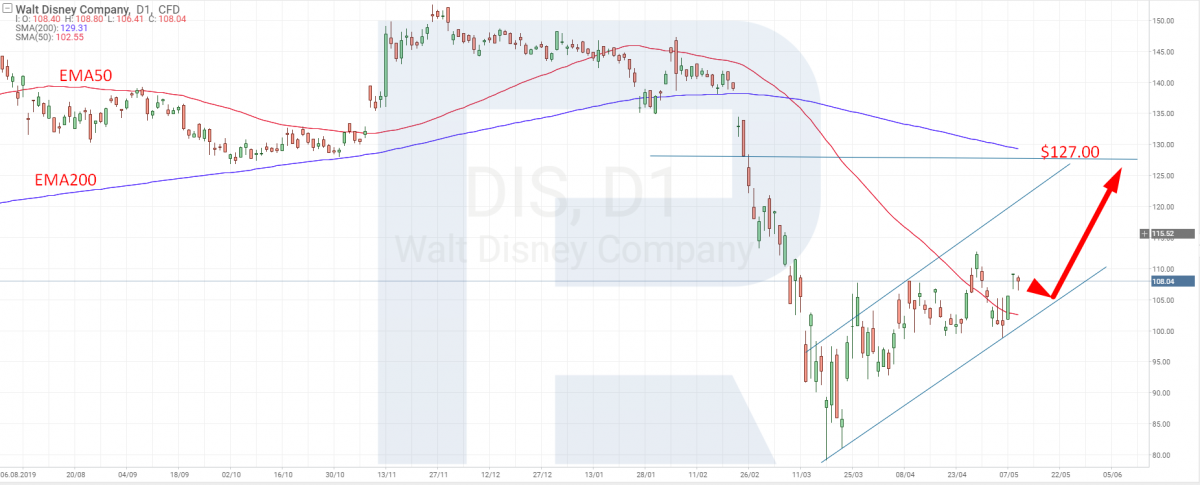
Tech analysis of Disney stocks

On D1, the stocks are restoring their positions after a swift decline. They keep growing with small pullbacks inside an ascending channel and have crossed the EMA50.

Crossing the EMA50 does not mean a trend reversal: while the price is heading for the EMA200, it might be too bold to forecast a change in the trend. However, the development of an uptrend is obvious, and many financial analysts also forecast further growth. I suppose we should agree with them.

The pandemics may slow down the growth a bit, however, I still recommend buying. The aim of the growth is currently $125.00 - $127.00. The price may correct on its way, remaining inside the ascending channel borders.

dis-d1-1-1200x485.png


Sony Corporation

Regardless of the company's specialization being the production of electronic devices and gadgets, Sony is currently a strong rival to Disney. In the sphere of technology, the competition is too tough for Sony but it is trying hard. However, it is doing much better in the sphere of entertainment.

Read more at R Blog - RoboForex

Sincerely,
RoboForex team
 
RoboForex: changes in trading schedule (Memorial Day in the USA and Late May Bank Holiday in the UK)

roboforex-header.jpg


Dear Clients and Partners,

We’re informing you that due to public holidays in the USA (Memorial Day) and the United Kingdom (Late May Bank Holiday), several instruments will be traded according to the changed schedule*.

MetaTrader 4 / MetaTrader 5 platforms

Trading schedule on Metals (XAUUSD and XAGUSD), US indices (US30Cash, US500Cash, and USTECHCash) and CFDs on oil (Brent and WTI)
  • May 25th, 2020 – trading stops at 7:45 PM server time.
  • May 26th, 2020 – trading starts as usual.
Trading schedule on CFDs on US stocks
  • May 25th, 2020 – no trading.
  • May 26th, 2020 – trading starts as usual.
Trading schedule on CFDs on Russian GDRs
  • May 25th, 2020 – no trading.
  • May 26th, 2020 – trading starts as usual.

R Trader platform

Trading schedule on US stocks and ETFs
  • May 25th, 2020 – no trading.
  • May 26th, 2020 – trading starts as usual.
Trading schedule on CFDs on US stocks and ETFs
  • May 25th, 2020 – no trading.
  • May 26th, 2020 – trading starts as usual.
Trading schedule on CFDs on US indices (US500, US30, and NAS100)
  • May 25th, 2020 – no trading.
  • May 26th, 2020 – trading starts as usual.
Trading schedule on CFDs on UK stocks
  • May 25th, 2020 – no trading.
  • May 26th, 2020 – trading starts as usual.
Trading schedule on CFD on UK100 index
  • May 25th, 2020 – no trading.
  • May 26th, 2020 – trading starts as usual.
Trading schedule on Metals (XAUUSD and XAGUSD) and CFDs on oil (WTI.oil, BRENT.oil)
  • May 25th, 2020 – trading stops at 7:45 PM server time.
  • May 26th, 2020 – trading starts as usual.
Please, take into account these changes in schedule when planning your trading activity.

* – This schedule is for informational purposes only and may be changed by the provider.

Sincerely,
RoboForex team
 
Gartley Butterfly Pattern: Indicator and Trading Strategy

Author: Victor Gryazin

roboforex-header.jpg


Dear Traders,

In this review, we will discuss a well-known trading pattern - the Gartley Butterfly. You may learn to find this pattern on the chart by yourself or use the ZUP indicator, specially created for finding and drawing the pattern on the price chart.

Pattern history

The Gartley Butterfly pattern appeared as long ago as 1935 thanks to a famous analyst and tech analysis expert Harold M. Gartley. He specialized in stock market analysis, delivered lectures on tech analysis, and consulted Wall Street traders. In the end, Gartley's tech analysis study course turned into a book called "Profits In the Stock Market", where he first described a pattern that was later named Butterfly.

The Gartley Butterfly became popular a bit later, at the end of the 20th century. Gartley's works were improved by his followers Scott M. Carney and Larry Pesavento. The latter added the Fibonacci levels to the Butterfly to define and classify patterns more precisely. A Gartley Butterfly with perfect Fibo proportions is called the Pesavento Butterfly.

Gartley Butterfly pattern description and trading method

The Gartley Butterfly belongs to harmonic trading patterns - the ones which form by a certain scheme including Fibo levels. The pattern consists of four price movement sections (waves), the second, third, and fourth ones being, in essence, a three-wave correction of the first movement. The pattern got its name because its lines and Fibo levels on the chart look like a butterfly's wings.

The Gartley Butterfly forms on different timeframes; quite often, it acts as a trend continuation pattern for the actual trend on a larger timeframe. The pattern works well with other tech analysis instruments: trendlines, support, and resistance levels. If the pattern forms according to the Fibo relations singled out by Pesavento, it will work off more probably, however, even without them, the pattern is trustworthy.

Bullish Gartley Butterfly

A bullish (buying) pattern looks like an ascending price impulse XA followed by a three-wave correction AB-BC-CD. The pattern roughly looks as follows:

gartley-scheme-buy.png


Read more at R Blog - RoboForex

Sincerely,
RoboForex team
 
Trading the Alligator+Fractals Strategy

Author: Maks Artemov

roboforex-header.jpg


Dear Traders,

Today, we will speak about one of the most popular Forex strategies called Alligator+Fractals. It was designed by a famous market psychologist and successful trader Bill Williams in the 20th century, however, it remains topical nowadays.

Alligator+Fractals belongs to trend strategies, which means it does not work in the times of a flat.

This strategy is multicurrency, however, observations show that it works better on instruments with a small spread, such as most basic currency pairs and metals. With high-volatile instruments, it may give false signals.

You may use any timeframe; however, on smaller ones, signals will be multiple but their quality may worsen. On H4 and longer timeframes, signals will demonstrate better quality but appear more rarely. A trade will be working off for several days if not weeks. The size of Stop Losses on large timeframes may exceed the size allowed by your risk management. However, the profit may be huge compared to the Stop Loss.

The Fractals and Alligator indicators: the base of the strategy

This strategy is based on two indicators designed by Bill Williams and included in most trading terminals by default:

  1. Fractals
  2. Alligator

Fractals indicator settings

The Fractals indicator looks like an arrow above a Japanese candlestick or a bar and points at the price extreme. For a Fractal to appear, the following conditions are necessary:

  • The highs of the two first candlesticks are increasing.
  • The high of the third candlestick is higher than those of the preceding two candlesticks.
  • The highs of the fourth and fifth candlesticks are decreasing gradually.
  • If all the requirements are met, a fractal forms on the extreme.

In the settings, you may only change the color and the width of the line. Other parameters are set.

ris-1-fractals-1200x540.png


Fractals indicator

Read more at R Blog - RoboForex

Sincerely,
RoboForex team
 
Top