• The Forex, Binary Options Forum - welcomes you to our Community!

    DigitalCashPalace Forum is dedicated to discussions about Forex, Binary Options, commodities, stocks related.

    Please take a look around, and feel free to .

NordFX - NordFX.com

Status
Not open for further replies.

Julia NordFX

Broker Representative
Forex Forecast for EURUSD, GBPUSD, USDJPY and USDCHF for 12 - 16 June 2017


First, a review of last week’s forecast:


- Let us recall that in the forecasts regarding EUR/USD, most experts (70%), supported by graphical analysis on H4, spoke about the possible decline of the pair to 1.1100. The forecast proved correct, with the pair having lost about 120 points in the course of the week. However, it ended up being 65 points short of the named target, having only managed to reach 1.1165 before turning and arriving at 1.1195;


- It is clear that the behavior of GBP/USD last week was determined by the snap parliamentary elections in the UK, the outcome of which was quite unexpected and rather unpleasant for the governing Conservative Party. Note that the forecasts of financial analysts we published last week turned out to be much more accurate than any voting polls. Recall that our experts expected the fall of the British pound first to 1.2765 and then to the support at 1.2600. Allowing for standard error adjustments, this is exactly what ended up happening: on Friday, the pair reached the local bottom at 1.2633, after which it gained back just over 100 points. It finished the five-day period in the 1.2740 zone;


- USD/JPY. Last week, we were unable to give a clear-cut forecast for this pair. The scenario closest to reality turned out to be that described by graphical analysis, which talked about an initial fall of the pair to the support at 110.00 (in reality, this level ended up being 109.10), and then a reversal and subsequent growth to 111.00 (in reality, the growth was to 110.80). The net movement following the week’s activity is virtually zero: the pair finished almost at the same level, where it started;


- USD/CHF. Boiling down the results of technical and fundamental analysis last week, in general, the leanings of both indicators and analysts were bullish: everyone expected the pair to grow. The question was only about how much the pair would actually grow: whether sharply to the landmark level of 1.0000, or more modestly to 0.9760. The pair, as expected, departed northwards. However, it struggled to cover as little as 100 points, reaching only 0.9725 by Friday. After this, the strength of the bulls dried up, and the pair slipped to 0.9690.


***

As for the forecast for the coming week, summarizing the opinions of analysts from a number of banks and broker companies, as well as forecasts made on the basis of a variety of methods of technical and graphical analysis, we can say the following:


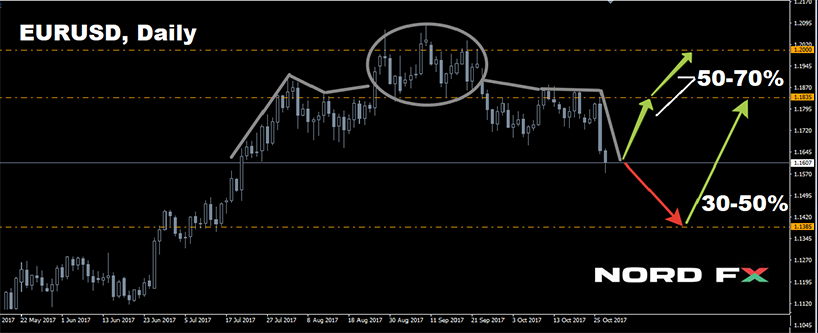
- EUR/USD. On one hand, last week the pair reached a powerful support level of 1.1165, which was followed by a small rebound. This, however, begs the question of whether this rebound represents 1) a shift of a bearish trend to a bullish one, or 2) a mere correction after which the pair's downward movement will continue.

Both trend indicators and the oscillators on D1 have taken a neutral stance. As for the graphical analysis on H4, it insists the pair will rise and return to the 1.1240-1.1285 zone.

Experts have taken a diametrically opposite position: 70% of them, supported by graphical analysis on D1, believe that the pair will continue moving southwards, dropping first to the 1.1000-1.1100 zone and then to 1.0825.

And, of course, we mustn’t forget that on Wednesday, 14 June, the US Federal Reserve is expected to decide on the interest rate. The forecasts do not anticipate anything extraordinary to happen, but if a rate increase (or even a hint at a future increase) occurs, one should expect a stormy market reaction which may make the dollar seriously strengthen its position;


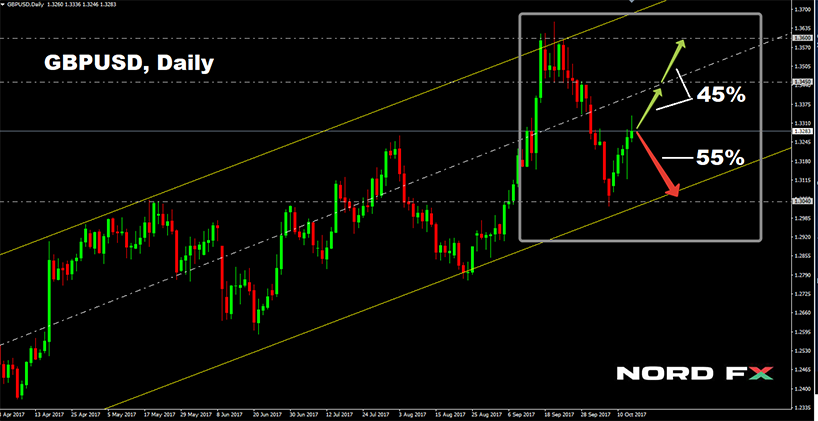
- As for the future of GBP/USD, technical analysis is still sidelined by politics and what will happen in the UK’s power structures in the coming days.

As for the graphical analysis on D1, it predicts an initial growth to 1.2980 and then a drop first to 1.2770 and then to 1.2650. Indicators and almost 85% of analysts agree with this, believing that by mid-summer the pair should drop to 1.2550;


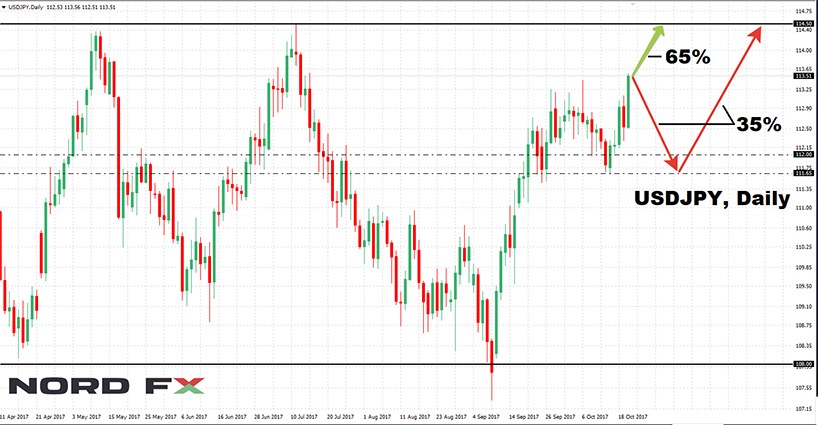
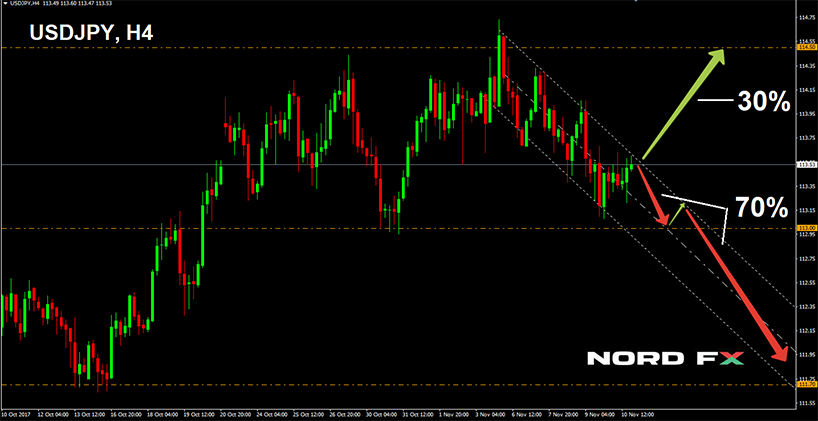
- USD/JPY. This week, experts, graphical analysis and indicators demonstrate extraordinary unanimity. For the next few days, they expect a sideways trend in the 110.25-111.00 range. In the longer term, the pair is expected to rise to 112.00. It should be noted that in the medium term, more and more people are expecting the pair to grow. Currently, only 50% of analysts support a short term bullish scenario, whilst in the medium term this number already exceeds 75%.

An alternative, bearish point of view is represented by a mere 25% of experts who point to a local minimum in the 109.00 zone. Just one analyst believes the pair will fall to the April low at 108.00;


- The last pair of our review is USD/CHF. Graphical analysis shows the continuation of its movement in the descending channel that had started in the beginning of 2017. This channel is clearly visible on the D1 and W1 charts. According to this forecast, the pair has now launched off the lower border of the channel (0.9610) and started an upward movement to its upper limit (0.9910). The main resistance on this path is 0.9810. Almost 85% of analysts agree with this. However, as usual, the pair’s behavior is largely dependent on what happens with EUR/USD;


To conclude the forecast, we believe it worthwhile to recall that, in addition to the aforementioned US Fed rate decision on 14 June, similar decisions of the Bank of Switzerland and the Bank of England are expected on Thursday, 15 June and the Bank of Japan on Friday 16, June.


Roman Butko, NordFX


Notice: These materials should not be deemed a recommendation for investment or guidance for working on financial markets: they are for informative purposes only. Trading on financial markets is risky and can lead to a loss of money deposited.


#forex #forex_forecast #eurusd #signals_forex #binary_options

www.nordfx.com
 

Julia NordFX

Broker Representative
Forex Forecast for EURUSD, GBPUSD, USDJPY and USDCHF for 19 - 23 June 2017


First, a review of last week’s forecast:


- It had been clear that the main moves for EUR/USD would begin on Wednesday 14 June, when the US Federal Reserve would officially announce a rate increase. Everyone was ready for this. What no one was expecting though was the sharp drop of the dollar 5.5 hours before this event. Taking advantage of negative data on the US consumer market, large speculators pulled the pair up by 100 points. As a result, the Fed's statement could only return it to the original value of 1.1200. However, the "bears" did not calm down there, and on Friday the pair reached the local bottom at 1.1130, after which it again returned to where it started the week: namely in the 1.1200 zone;


- As for GBP/USD, as expected, technical analysis proved useless last week. The pair made variously directed fluctuations with an amplitude of 100-150 points for the whole week, which were caused both by political factors and by the rate decisions of the US Federal Reserve and the Bank of England. Even though the latter left rates unchanged at 0.25%, it should be noted that instead of the expected seven members of the Monetary Policy Committee, only five voted for this decision. Three, wanting to stop the pound falling (or, perhaps, fearing the appearance of another George Soros), spoke in favor of raising the rate. We can infer from this that it is possible that the financial policy of Great Britain will face serious changes soon, with these changes being related primarily to the capital outflow and the terms for the country's withdrawal from the EU;


- USD/JPY. We can say, albeit rather liberally, that the forecast for this pair turned out to be correct. Recall that at the beginning of the week we expected the pair to move in a sideways trend in the range of 110.25-111.00 the range turned out to be 110.15-110.50). As a local minimum, experts had indicated 109.00 (the pair dropped to the level of 108.80), and the height of 112.00 was named as the maximum (the pair reached 111.40). As for the results of the week, it ended at the medium-term Pivot Point 110.85, along which the pair has been moving since mid-May;


- USD/CHF. As expected, the pair carefully copied all movements of the EUR/USD during the entire week, although it did this with less volatility. Thus, whilst the maximum fluctuation range of the euro/dollar was 165 points, for the Swiss franc it did not exceed 130.


***

As for the forecast for the coming week, summarizing the opinions of analysts from several banks and broker companies, as well as forecasts made on the basis of a variety of methods of technical and graphical analysis, we can say the following:


- EUR/USD. The only ones who took a neutral position this week were trend indicators: their votes on H4 and D1 were split approximately 50/50. As for the oscillators and graphical analysis, almost all of them point southwards. Almost 75% of experts agree with this view of events, considering that the pair will first fall to the support at 1.1100, and in the medium term even lower into the 1.0800-1.0900 zone. 1.1300 is indicated as the main resistance;


- As for the future of the GBP/USD, there is no unanimity among the indicators. H4, trend indicators, oscillators and graphical analysis all insist on buying the pair; D1 indicators suggest selling. In general, a fairly wide side corridor appears within the boundaries of 1.2580-1.2970. The picture among analysts, though, is quite different: the overwhelming majority of them (70%) have sided with the "bears", believing that the nearest target for the pair will be the 1.2600-1.2700 zone. The next target is 1.2400. The voices of the bulls’ supporters this week are very weak, and they all point to the May maximum at 1.3050;


- USD/JPY. 90% of experts believe that the uptrend for this pair is not yet complete, and it should necessarily try to break through resistance at 112.00. Graphical analysis on H4, as well as about 70% of indicators, agree with such developments. However, it should be noted that almost a quarter of oscillators indicate this pair is overbought. The main support in case of a fall is in the 109.00 zone;


- The last pair of our review is USD/CHF. Here, almost all indicators have turned green. Recall that, having fought off the lower border (0.9610) of the medium-term descending channel, which began at the very beginning of 2017, the pair started approaching the center. Now almost 80% of analysts and almost the same proportion of technical analysis instruments expect its further growth. The nearest resistance is 0.9810, the upper limit of the channel is 0.9910. However, almost 90% of experts do not exclude that the pair will not stop at this height and will soon overcome 1.0000.


Roman Butko, NordFX


Notice: These materials should not be deemed a recommendation for investment or guidance for working on financial markets: they are for informative purposes only. Trading on financial markets is risky and can lead to a loss of money deposited.


#forex #forex_forecast #eurusd #signals_forex #binary_options

www.nordfx.com
 

Julia NordFX

Broker Representative
Forex Forecast for EURUSD, GBPUSD, USDJPY and USDCHF for 26 - 30 June 2017


First, a review of last week’s forecast: the holiday season is approaching, which may be the cause of the diminishing stream of significant economic events. This necessarily affects the volatility of the major currency pairs, which have come close to the targets indicated by analysts, without having successfully overcome them.


- Thus, last week, the maximum range of the EUR/USD fluctuations hardly exceeded 90 points. Recall that 75% of our experts had assumed that the pair should descend to the support at 1.1100. Allowing for the standard backlash, that was what happened: the week's low was fixed at 1.1118. However, the bears' strength then dried up, and the bulls returned the pair to the same place from where it had started the five-day period;


- Regarding the GBP/USD, recall that 70% of analysts had voted for the fall of the pair, whilst technical analysis had determined 1.2580 as the local minimum. This forecast turned out to be correct, and by the middle of the week the pair had actually fallen to 1.2587. Then, just as in the case of EUR/USD, the trend reversed and the pair retreated north, returning to Pivot Point of the last two weeks in the 1.2715 zone;


- The USD/JPY. The basic forecast, supported by 90% of experts, graphical analysis and 70% of indicators, had suggested that the pair would certainly try to break through the 112.00 resistance. This is what happened in reality: at the very beginning of the week’s session, the pair rushed upwards and, flying up 100 points, quickly reached 111.77. It then rolled back a bit, after which it tried to conquer the treasured height three times. However, after all these attempts were exhausted, the pair retreated downwards by 50 points and finished the week at 111.27;


- However, the forecasts for the future of USD/CHF have not been fulfilled. The pair’s uptrend was expected to continue, which would have carried it to at least the resistance of 0.9810. However, the pair stayed in the side channel of the last five weeks - 0.9620-0.9770 - and completed the week session near its central line in the 0.9695 zone.


***

As for the forecast for the coming week, summarizing the opinions of analysts from a number of banks and broker companies, as well as forecasts made on the basis of a variety of methods of technical and graphical analysis, we can say the following:


- EUR/USD. As for indicators, about 90% of them look to the north on H4. But with the transition to a larger D1 time frame, the forecast changes to neutral. Moreover, almost a quarter of the oscillators already show that this pair is overbought, thereby recommends to sell. The graphical analysis on D1 and about 70% of analysts also agree with this, pointing to a possible fall of the pair first to 1.1100, and then even lower to the 1.0850-1.0960 area.

Speaking about the very near future, on Monday 26 June, the release of positive data on the US consumer market is expected, which may help strengthen the dollar. However, it may take the pair anything from one to several weeks to achieve these goals.

An alternative point of view sees the growth of the pair first to the resistance of 1.1285, and in the event of a breakthrough, even higher, bringing it to the 1.1400 region. However, in the medium term this forecast is supported by less than 10% of experts;


- As for the future of GBP/USD, here, too, most analysts are set to sell this pair. But a majority as obvious as the one for EUR/USD is nowhere to be seen: the vote is split 55% / 45%. Trend indicators and oscillators on D1 are on the side of the majority, whilst their "colleagues" on H4 as well as graphical analysis on both H4 and D1 side with the minority.

The nearest target for the bulls is 1.2815, the medium-term targets are 1.2920, 1.2975 and 1.3045. As for the bears, they will try to drop the pair first to the 1.2585-1.2630 region, before carrying it down by another ‘echelon’ to the 1.2365-1.2585 area;


- USD/JPY. The indicators on H4 are much more confident here than on D1. The former believe that the pair will once again try to take the height of 112.00, and this attempt should be crowned with success. Graphic analysis and about 60% of experts agree with this development. At the same time, graphical analysis on D1 indicates that after the pair reaches 112.15, it may roll back to 109.65-110.00;


- and the last pair of our review is the USD/CHF. If last week almost all the indicators were painted green, now many of them have changed to red, insisting that the pair will necessarily test the local minimum of 0.9610 again.

70% of experts, graphical analysis and about half of oscillators on D1 strongly disagree with this forecast. Based on the fact that the pair is oversold, they continue to insist on it moving to the upper boundary of the medium-term downtrend channel at 0.9910, which started early in 2017. The nearest resistance is 0.9810.


Roman Butko, NordFX


Notice: These materials should not be deemed a recommendation for investment or guidance for working on financial markets: they are for informative purposes only. Trading on financial markets is risky and can lead to a loss of money deposited.


#forex #forex_forecast #eurusd #signals_forex #binary_options

https://www.nordfx.com/
 

Julia NordFX

Broker Representative
Forex Forecast for EURUSD, GBPUSD, USDJPY and USDCHF for 03 - 07 July 2017


To begin with, a few words about the forecast for the previous week, which was a week full of speeches by senior Central Bankers globally. Forex trends were influenced by the ECB head Mario Draghi, as well as his colleagues from the Bank of England Mark Carney and Bank of Japan Haruhiko Kuroda. It goes without saying that the week would not be complete without the statements of the head of the US Federal Reserve, Janet Yellen.


- EUR / USD. The past week clearly showed that the opinion of the majority is not necessarily correct. Recall that, even though about 90% indicators on H4 voted for the growth of the pair, this forecast was supported by only about 10% of analysts. In their opinion, the pair had to first rise to the resistance at 1.1285, and then even higher to 1.1400. This is what happened - the pair was firmly entrenched in the zone 1.1390-1.1445 by the end of the five-day period;


- As for GBP/USD, 45% of analysts voted for its growth, which was supported by indicators on H4 and graphical analysis on H4 and D1. The bulls identified 1.2815, 1.2920, 1.2975 and 1.3045 as target levels. Backed by "hawkish" statements by Mark Carney about a possible increase in interest rates on the British pound, the pair took the first three heights with ease and came close to the fourth, finishing the week at 1.3025;


- USD/JPY. Here the main forecast was that the pair would once again try attempt to take the height of 112.00, and that this attempt would prove fruitful. This forecast turned out to be 100% true: the pair not only managed to reach this height, but also exceed it by almost 100 points. It then rolled back to finish at 112.40;


- The bears (30% of all forecasters), insisted that USD/CHF should test the local minimum of 0.9610 again. And indeed, after some hesitation, the pair went southwards, mirroring the movements of EUR/USD. On Wednesday, it reached this support, broke through it and spent the rest of the week in the side channel 0.9550-0.9600.


***

As for the forecast for the coming week, summarizing the opinions of analysts from a number of banks and broker companies, as well as forecasts made on the basis of a variety of methods of technical and graphical analysis, we can say the following:


- EUR/USD. It should be noted that, because of a powerful breakthrough last week, the pair reached the upper boundary of the side channel it had been moving in for over two years, ever since the winter of 2015. Perhaps that is why the experts are rather confused, being divided into approximately three equal camps: 40% favor the pair’s growth, 35% support its fall, and the remaining believe in a sideways trend.

If we look at the graph of W1, we can see that the pair escaped the limits of the said channel for a short period of time on two occasions: in August 2015 and in May 2016, reaching 1.1715 in the first case, and 1.1615 in the latter. So, from the point of view of graphical analysis, there is still potential for growth of the pair. However, a whole quarter of the oscillators on D1 already signal that the pair is overbought.

Do not forget that this week we are expecting a sufficiently large amount of data on the US economy to be published, a lot of which, according to forecasts, is positive for the dollar. For example, it is expected that one of the most important indicators, NFP (the number of new jobs outside the agricultural sector) may increase from 138K to 170-180K, which will provide significant support to the bears, and they will be able to drop the pair below the level of 1.1300;


- GBP/USD. Here, as in the case of the EUR/USD, both graphical analysis and the absolute majority of trend indicators and oscillators point northwards, believing that the pair should rise to at least 1.3120-1.3180, and then, possibly, by another 200 points. However, considering that the pair is now close to a very strong support/resistance level and is also approaching the 2017 high, a rebound is certainly plausible. In this case, the targets levels would be 1.2815 and 1.2760.

As for the opinion of analysts, 55% of them expect the pair to fall within the next few days, whilst 90% believe it will fall in the medium term;


- USD/JPY. Here, 40% of experts and almost 100% of indicators voted for the growth of the pair. The resistance levels are 113.10, 113.60 and 114.35. An alternative point of view is supported by 60% of analysts and only one indicator. The nearest support levels are 111.80, 110.80 and 110.25. Another possibility, suggested by graphical analysis on H4, has the pair grow to 113.10 and then fall to 112.00;


- The last pair of our review is USD/CHF. Next week, 75% of experts and a similar proportion of indicators expect the pair to fall to the zone of 1.9465-1.9520. The remaining analysts expect the pair to rise to 0.9650. And, as in the previous case, the alternative case is proposed by graphical analysis, which suggests a back and forth dancer in the lateral channel of 0.9520-0.9650. When it comes to the more distant future, almost 80% of experts expect the pair to return to the zone of 0.9860-1.010 in August.


Roman Butko, NordFX


Notice: These materials should not be deemed a recommendation for investment or guidance for working on financial markets: they are for informative purposes only. Trading on financial markets is risky and can lead to a loss of money deposited.


#eurusd #gbpusd #usdjpy #forex #forex_forecast #forex_signals #binary_options

https://www.nordfx.com/
 

Julia NordFX

Broker Representative
Forex Forecast for EURUSD, GBPUSD, USDJPY and USDCHF for 10 - 14 July 2017


First, a review of last week’s forecast:


- EUR/USD. As a result of a powerful breakthrough in late June, the pair reached the upper boundary of the side channel in which it has been moving for more than two years since the winter of 2015. It was this that gave reason to expect the pair to fall. Recall that this scenario was supported by 35% of experts and the quarter of the oscillators who signaled it was overbought. The level 1.1300 was named as the local minimum, and the pair reached it on Wednesday (1.1312). Having fulfilled this task ahead of schedule, it returned to the upper border of the channel and finished the week near 1.1400;


- As for GBP/USD, having approached the high of 2017, it reached critical values in late June, just like to EUR/USD. That is why 55% of analysts voted for its decline, identifying the support at 1.2815 as the target. As early as Monday the trend indeed made a reversal downwards, but the low point, which the pair managed to reach by Friday, was 50 points higher at 1.2865;


- USD/JPY. Here, 40% of experts and almost 100% of indicators voted for the growth of the pair. The level 114.35 was named as the top point. This forecast came true by 100%, and the pair climbed more than 200 points by the end of the week’s session, reaching 114.20;


- The most accurate forecast for USD/CHF was given by graphical analysis, which traced its back and forth motion in the lateral channel 0.9520-0.9650. That's exactly what happened: at first the pair rose to the upper border of the channel. Then, the bulls attempted to break it, but their strength was exhausted at 0.9685 and the pair turned southwards, ending the week near the strong support / resistance zone at 0.9635.


***

As for the forecast for the coming week, summarizing the opinions of analysts from a number of banks and brokerages, as well as forecasts made on the basis of a variety of methods of technical and graphical analysis, we can say the following:


- EUR/USD. This time, both experts and technical analysis voted overwhelmingly for the growth of the pair. 70% of analysts, graphical analysis on H4 and almost 100% of indicators agree with this scenario. In their opinion, the pair will try to break through the horizon 1.1500 and, if this attempt proves successful, rush even higher to the 2016 high at 1.1620.

The alternative forecast can hardly be called alternative, since it's not about the fall of the pair, but about its lateral movement within the boundaries of 1.1300-1.1445. The remaining 30% of experts, graphical analysis on D1 and only one oscillator, indicating that the pair is slightly overbought, agree with this.

It should also be noted that, despite the positive mood for the coming days, the medium-term outlook for the pair remains negative. It is supported by almost 70% of analysts. In addition, we should pay attention to the speech of the head of the Fed, Janet Yellen on Thursday, July 13, and data on the US consumer market, which are expected to be published on Friday July 14.


- GBP/USD. Here, unlike the case of EUR/USD, the indicators are divided almost equally. However, both trend indicators and oscillators on D1 show a slight bullish advantage. 65% of analysts also look northwards, supported by graphical analysis. They all point to the level of 1.3050 as a target. The next resistance is 50 points higher at 1.3100. Only 35% of experts side with the bears. However, if we talk about the forecast for the second half of the summer, almost 70% of these experts think that the pair should return to the zone of 1.2500;


- USD/JPY. Recall that the pair has been trying to reach the May maximum at level 1.1435 for more than a month now. And it is possible that this week it will once again attempt to rise to said level and even go beyond it to 1.1500. 60% of experts and most of the indicators agree with this scenario.

The remaining part of the analysts, as well as graphical analysis on H4, believe that the forces of the bulls have already dried up, and the pair is expected to sharply descend to the zone of 111.00-111.75. A third of the oscillators supports this scenario, signaling the pair is overbought.

As for the medium-term perspective, more than 80% of experts expect a fall;


- the last pair of our review is USD/CHF. Here, the opinion of analysts is also radically changing when moving from the weekly forecast to the medium-term forecast. For the next week, 100% (!) of experts speak about the descent of the pair to 0.9520-0.9560. However, once that happens, 60% of them maintain that the pair should rise above the horizon of 0.9800.

A slightly different scenario is offered by graphical analysis on D1: it suggests an initial growth of the pair to 0.9735, and then its fall into the 0.9480-0.9520 zone.


Roman Butko, NordFX


Notice: These materials should not be deemed a recommendation for investment or guidance for working on financial markets: they are for informative purposes only. Trading on financial markets is risky and can lead to a loss of money deposited.


#eurusd, #gbpusd, #usdjpy, # forex, # forex_forecast, #forex signals, # binary_options

https://www.nordfx.com/
 

Julia NordFX

Broker Representative
Forex Forecast for EURUSD, GBPUSD, USDJPY and USDCHF for 17 - 21 July 2017


To begin with, a few words about the forecast for the previous week, which ended up being almost 100% correct for EUR/USD, GBP/USD and USD/JPY.


- Recall that the overwhelming majority (70%) of experts and almost 100% of indicators voted for the growth of the EUR/USD. 1.1500 was named the main target. As for the remaining analysts, they thought lateral movement would dominate last week.

The pair worked on both scenarios. First, as predicted, leaning on the support of 1.1380, it rushed up and reached the height of 1.1490 on Wednesday. Then it rolled back to the support zone, turned around and rushed up again, finishing the five-day period in the zone of 1.1470;


- As for GBP/USD, the odds here, as in the case of the EUR/USD, were on the bulls' side. 65% of analysts, graphical analysis, as well as most indicators on D1, had voted for the movement of the pair to the north. In their opinion, the pair was supposed first to rise to the resistance at 1.3050, and then to the height of 1.3100, which was recorded at the very end of the weekly trading session;


- USD/JPY. The pair has been striving north for more than a month, trying to reach the May high at 1.1435. Most experts believed that last week it would manage to do it. At the same time, a third of the indicators signaled that the bulls' strength had already dried up, and this gave grounds to talk about an imminent fall of the pair.

That's exactly what happened: having hardly reached 1.1450, the pair immediately turned and sharply collapsed, groping the local bottom at 112.25 on Friday;


- The most accurate forecast for USD/CHF was given by graphical analysis, which was drawing a back-and-forth movement in the side channel for the second week in a row. However, the range of oscillations of the pair turned out to be narrower than expected (0.9520-0.9735), and it stayed within 0.9600-0.9700.


***

As for the forecast for the coming week, summarizing the opinions of analysts from a number of banks and brokerages, as well as forecasts made on the basis of a variety of methods of technical and graphical analysis, we can say the following:


- EUR/USD. Almost 100% of indicators believe that the upward trend of the pair will continue. And as for the experts, only 55% of them are bullish. This is because the pair has reached the upper boundary of its long-term lateral channel, where it has been moving since January 2015. The W1 chart clearly shows that if the pair breaks through the 1.1500 level, its next target will be the 2016 high: 1.1615.

An alternative scenario involves the pair being pulled downwards. In this case, 1.1380 and 1.1300 will be support levels. 45% of analysts and graphical analysis on D1 agree with this version.

In the coming week, we expect the publication of data on euro area consumer market on Monday, July 17 and the ECB's decision on the interest rate on Thursday, July 20. However, these events will likely not have a strong impact on the EUR/USD exchange rate.

As for the medium-term outlook, it remains negative, and 75% of analysts expect the pair to fall to 1.1100-1.1200 during the summer;


- GBP/USD. Graphical analysis on H4, 100% of trend indicators, 2/3 oscillators and only 1/3 of analysts believe that the pair still has enough strength to rise to 1.3150 or even 1.3200. On the other hand, an overwhelming majority of experts, supported by one third of oscillators, are confident that the upward impulse of the pair has dried up: judging by this view, the pair can now be expected to decline first to 1.3000, and then 175-200 points lower. After that, according to the readings of graphical analysis on D1, the pair will move in the lateral channel 1.2800-1.3025 for a month;


- If, speaking of the future of USD/JPY, most of the indicators on H4 look to the south, their eyes turn westwards on D1. In other words, they have taken a neutral position. But almost 70% of experts are sure that the pair will try to re-test the level of 114.50 and, in case of its breakthrough, will rush to this February high at the height of 115.50.

As for the small umber of supporters of the pair's decline, they think it can drop to the zone of 110.50-111.00.

The decision of the Bank of Japan on interest rates, which will be published on July 20, is unlikely to surprise the financial markets, and they are likely to react to it quite calmly;


- and the last pair of our review is USD/CHF. In this case, indicators do not provide any clear forecast. However, most analysts (85%) still expect the pair to fall at least to the zone of 0.9500-0.9550.

A slightly different scenario is offered by graphical analysis on D1: an initial growth of the pair to the resistance of 0.9700-0.9725, and only then its fall into the designated zone.


Roman Butko, NordFX


Notice: These materials should not be deemed a recommendation for investment or guidance for working on financial markets: they are for informative purposes only. Trading on financial markets is risky and can lead to a loss of money deposited.


#eurusd, #gbpusd, #usdjpy, # forex, # forex_forecast, #forex signals, # binary_options

https://www.nordfx.com/
 

Julia NordFX

Broker Representative
Forex Forecast for EURUSD, GBPUSD, USDJPY and USDCHF for 24 - 28 July 2017


First, a review of last week’s forecast:


- The main view on EUR/USD was that it would break through1.1500 and grow to the 2016 high at 1.1615. The next target would then be the maximum of August 2015: 1.1715. The main impetus for the pair's upswing was given by the head of the ECB Mario Draghi, who said on Thursday that the euro zone stimulus program (QE) will not end and will remain unchanged. Against the background of these comments, the euro's exchange rate against the dollar jumped by 0.5%, and the pair reached the height of 1.1680 by the end of the week session;


- As for GBP/USD, the forecast ended up being 100%. Accurate. Recall that the vast majority of experts, supported by one third of oscillators, were confident that the upward impulse of the pair had dried up, and it was expected to decline first to 1.3000, and then even lower. As a result, the pair dropped to 1.2930, then rebounded and finished the week at the level of 1.2994;


- USD/JPY. Indicators on H4 and only one third of analysts spoke about the fall of this pair last week. But it was them who turned out to be right, having predicted its decline to the level of 111.00, which became the week’s minimum.


- Predicting the future of USD/CHF, the majority of analysts (85%) insisted on it falling to at least 0.9500-0.9550, and possibly even lower. The pair obediently did so, having lost 190 points in a week and started touching a local bottom at 0.9437.


***

As for the forecast for the coming week, summarizing the opinions of analysts from a number of banks and brokerages, as well as forecasts made on the basis of a variety of methods of technical and graphical analysis, we can say the following:


- EUR/USD. After an impressive upwards spurt last week, the future of this pair now looks quite ambiguous. 55% of experts, 100% of trend indicators and graphical analysis indicate the uptrend will continue. The August 2015 maximum - 1.1715 - is named as the nearest resistance, the next target is 100 points higher.

An alternative point of view is represented by 45% of experts and more than a third of oscillators on H4 and D1, indicating the pair is overbought. In their opinion, the pair should return to 1.1480-1.1580. The following events can also contribute to the strengthening of the dollar: on July 26, the Fed will provide commentary on a possible increase in interest rates before the end of the year, and on July 28 we will see the publication of annual data on US GDP;


- GBP/USD. If we try to bring together the opinions of experts and technical analysis, we can talk about the prevalence of bullish sentiment and the movement of this pair in the 1.2950-1.3120 channel. In figures, it looks like this: 50% of analysts are for the growth of the pair, the other 50% are for its fall. Trend indicators: 70% look to the north, 30% to the south. Oscillators: one third is colored red, one third is green, and the rest are neutral. As for graphical analysis, on D1 it says that, starting from the support at 1.2950, the pair will try to gain a foothold above the level of 1.3100 and, if successful, rush to the resistance at 1.3280. Otherwise, it is expected to return to around 1.2950;


- The medium-term outlook for USD/JPY indicates that it should return to the height of 114.50. But it's too early to talk about the reversal of the trend, and the pair will continue to descend in the coming week. 65% of analysts agree with this point of view, as well as about 80% of indicators. At the same time, a quarter of the oscillators are already signaling that the pair is oversold. The main support levels are 110.85, 110.25 and 109.00;


- The last pair of our review is USD/CHF. 100% of experts, 100% of trend indicators, 75% of oscillators and graphical analysis on H4 and D1 expect the continuation of the downtrend and fall of the pair first to 0.9400, and then 100 points lower. However, one should bear in mind that, as in the case of USD/JPY, a quarter of the oscillators already indicate the pair is oversold, so it is impossible to exclude the correction to the north. The nearest resistance is at the level of 0.9525, the next one is 0.9560.


Roman Butko, NordFX


Notice: These materials should not be deemed a recommendation for investment or guidance for working on financial markets: they are for informative purposes only. Trading on financial markets is risky and can lead to a loss of money deposited.


#eurusd, #gbpusd, #usdjpy, # forex, # forex_forecast, #forex signals, # binary_options

https://nordfx.com/
 

Julia NordFX

Broker Representative
SERVICE "SIGNALS" - AUTOMATIC TRADING OF THE XXI CENTURY


How to compile your own rating of reliable and profitable signals for copying.


NordFX offers its clients access to one of the largest international networks of automatic trade signal copying.

Connecting to this network does not require installing any additional software on your computer, since access to it is integrated into the terminals MT4 and MT5. In order to start copying, just open the "Signals" tab, which is located at the bottom of your trading terminal.


There are about 10,000 signals at your disposal. As practice shows, the main difficulty is the choice of signal to copy in order to receive significant and stable profit for a long time.

To solve this problem, leading NordFX analyst John Gordon offers you a fairly simple but effective method.


For example, let's take the data for MT4 for July 2017. With the help of the auto-transfer function, we select the top 10 signals in the MT4 rating and 10 signals, most popular among subscribers (Table 1), and write out those signals that have entered both ratings.


NN

MQL5.com Rating

Subsribers’ Rating

1

BREAKFX

CALM

2

CALM

Opus 08

3

LidziyaForex

Ninja Trainer

4

Opus 08

Gann ADV

5

Gann ADV

EA PAMM

6

Master of EURCHF

LVIK Forex Commo

7

EA PAMM

Hand Made Milk Money

8

Gains ECN

Master of EURCHF

9

Simple Star

FastMoney

10

Kauri

MWsclp


Then, using the www.mql5.com data, we fill out Table 2 with the main online monitoring data on these signals. (There are about 50 such parameters, but we will limit ourselves to four of them).


Signal

Lifetime, weeks

Max. Drawdown,

%

Deposit Increase, max, %

Deposit Increase for 6 months 2017г, %

CALM

101

44

2 638

5

Opus 08

21

38


878

Gann ADV

85

9

1720

137

EA PAMM

98

27

492

10

Master of EURCHF

43

40

672

147


The longer the lifetime of the signal (in weeks), the better. The maximum drawdown, on the contrary, should be as small as possible.

As for the increase in the deposit, it is desirable that the signal brings a stable profit for a long time. For example, the signal CALM showed a profit of 238% for 6 months of the year 2015, in 2016 it showed 668%, but for the first six months of 2017, the profit was only 5%. It is for this reason that we reject this signal.

For the same reason, we also reject EA PAMM.


The Opus 08 signal has a lifetime that is too small. Thus, there remain just two signals: Gann ADV and Master of EURCHF. Setting the two against each other, the first one wins. It has a significantly smaller drawdown with a significantly longer life expectancy, indicating a lower risk for the investor/subscriber.


In this example, we have considered a selection of only the 10 signals that head the ratings. It is strongly advised to expand the search area to at least 20 or even 50 signals. It is also very important to subscribe not just to one of them, but immediately to several, in other words to form an investment portfolio. This will significantly reduce your trading risks.


More information about the service "Signals" is available on the NordFX website:

https://nordfx.com/Trading_Signals.html
 

Julia NordFX

Broker Representative
Forex forecast for EURUSD, GBPUSD, USDJPY and USDCHF for July 31 - August 4, 2017


First, a review of last week’s forecast:


- EUR/USD. The upward trend of the pair, which began on New Year's Eve 2017 and which marks a steady fall in the US dollar, was continued last week. Thanks to growing GDP, the US currency had a chance, at least temporarily, to change the situation. However, the growth of the German consumer market turned out to be more impressive, and the pair went up by 100 points, ending the five-day period at 1.1750. Thus, our basic forecast, supported by 55% of experts, graphical analysis and 100% of trend indicators, was justified;

- The US dollar was also falling against the British currency. Our forecast for the GBP/USD spoke of the predominance of bullish sentiment and the desire of the pair to gain a foothold above the level of 1.3100. 1.3120 was identified as a local target and the pair completed the weekly session just above it;


- USD/JPY. Most analysts (65%) and about 80% of the indicators said that the pair would continue to move down. However, what happened, can hardly be called a proper fall: it fell by only 40 points as the result of the week. And, before that, in the first half of the week the pair managed to rise by 120 points, due to which the question of overselling, which was signaled by the oscillators, was closed;


- Practice shows that the USD/CHF rate very often mirrors the movement of the EUR/USD. Last week, though, the opposite happened. At a time when the dollar was falling against other major currencies, it rose sharply (by more than 250 points) against the Swiss franc. The reason was the stop orders issued by major Japanese traders and investment banks, which made the pair return to a strong medium-term support/resistance level in the 0.9700 area;


***

As for the forecast for the coming week, summarizing the opinions of analysts from a number of banks and brokerages, as well as forecasts made on the basis of a variety of methods of technical and graphical analysis, we can say the following:


- EUR/USD. Last week, the pair exceeded the August 2015 maximum,1.1715, and rushed to the next target: the highest point of all 2015,1.1870. 60% of experts agree that it will be able to reach it in the near future. The rest believe that the pair is facing a downwards correction: first to 1.1615, and then to the support line of the upward four-month channel near 1.1570. Apart from the experts, graphical analysis on H4 and D1 and a quarter of oscillators agree with such a development of events, with the latter signaling that the pair is overbought.

It should be noted that 80% of experts believe the pair will fall to 1.1112-1.1300 in the medium term;


- GBP/USD. About 70% of analysts, supported by 100% of trend indicators and the vast majority of oscillators, believe that the upward momentum for this pair has not yet dried up, and it will strive to reach the upper limit of last year's summer corridor at 1.3370. The nearest resistance in the zone is 1.3200-1.3225. Support is at the level of 1.3050.

The remaining 30% of experts, supported by graphical analysis on H4 and D1 and just one oscillator, believe that the pair will not be able to rise above the 1.3160 horizon, and will return first to support 1.3050, and then, possibly, drop another 50 points.

The medium-term forecast for the pair remains the same – southwards movement to 1.2700-1.2800. 75% of analysts agree with this development of events;


- 65% of experts expect that USD/JPY should still break through the support of 110.60 and fall into the 109.00-110.60 range. However, 20% of the oscillators once again signal that the pair is oversold, and, together with 35% of analysts, talk about a possible return to 112.20. The next resistance is 112.85, then 113.55;


- USD/CHF. After an impressive upwards spurt last week, the opinions of experts are divided almost evenly: 5% side with bears, 45% are on the side of bulls. As for indicators, naturally, the vast majority of them are colored green. However, even here 20% of the oscillators are in the oversold zone. Graphical analysis offers a compromise option at D1: first a decline to the zone of 0.9550, and then growth to 0.9700, and finally 0.9770.


- Summarizing the weekly review, it is worth recalling that the upcoming week will be filled with many events that traditionally attract the attention of currency traders. The beginning of the week from Monday to Wednesday will be devoted, mainly, to the data from the Eurozone. Thursday, 3rd August will be marked by a meeting of the Bank of England, and here the distribution of votes regarding interest rate changes will be of great interest. Recall that the number of supporters of rate increases is growing, and therefore certain surprises cannot be ruled out. And finally, at the very end of the week - on Friday, 4 August - US employment data (NFP) will be published, and judging by the forecasts (187K compared to 222K in June), they could apply negative pressure to the dollar.


Roman Butko, NordFX


Notice: These materials should not be deemed a recommendation for investment or guidance for working on financial markets: they are for informative purposes only. Trading on financial markets is risky and can lead to a loss of money deposited.


#eurusd, #gbpusd, #usdjpy, # forex, # forex_forecast, #forex signals, # binary_options

https://nordfx.com/
 

Julia NordFX

Broker Representative
Forex Forecast for EURUSD, GBPUSD, USDJPY and USDCHF for August 7 - 11, 2017


First, a review of last week’s forecast:


- 60% of experts called the 2015 maximum at the height of 1.1870 as the nearest target for EUR/USD, the pair reached it on Wednesday. As for a longer-term forecast, 80% of specialists expected the trend to reverse to the south and the pair to start falling. That is what happened on Friday, thanks to the positive data from the US labor market. The NFP indicator rose to 209K instead of the expected 187K, and the unemployment rate fell to 4.3% in July. Taking advantage of this occasion, the bears could drop the pair by 150 points, and it returned to the values of the beginning of the week;


- The dollar strengthened its position to a certain extent in relation to the British currency as well. At the beginning of the week, as predicted by 70% of analysts and the clear majority of indicators, the pair showed growth, having reached the height of 1.3265. But then, thanks to the Bank of England and the data from the United States that we already mentioned, the dollar gained nearly 250 points from the British pound, returning to the medium-term support/resistance level in the zone of 1.3030;


- The basic forecast for the USD/JPY claimed that the pair should finally break through the horizon of 110.60 and go one level below. This forecast came true by 100%, and the level of 110.60 turned from support into Pivot Point of the past two weeks;


- USD/CHF. Recall that, after an impressive breakthrough of this pair up, the opinions of experts were divided almost equally - 55% sided with bears, 45% were on the side of bulls. As for graphical analysis, it was it that, having suggested a compromise option - first the pair's decline, and then its growth to the height of 0.9770, - was the closest thing to reality - having declined to 0.9630, the pair reversed and, having overcome resistance 0.9700, reached the height of 0.9763 on Friday.


***

As for the forecast for the coming week, summarizing the opinions of analysts from a number of banks and broker companies, as well as forecasts made on the basis of a variety of methods of technical and graphical analysis, we can say the following:


- EUR/USD. After the fall of the pair last Friday, about half of oscillators and trend indicators on H4 turned red, but the green still dominates on D1, strongly recommending to buy. 75% of experts are thinking of the pair's growth, calling the zone 1.1900-1.2000 as the target. Another 15% of analysts speak of a sideways trend, and only 10% of them turn their eyes to the south. Graphical analysis on H4 and D1 shows solidarity with this bearish minority as well. The support levels in this case are 1.1670, 1.1400 and 1.1200;


- GBP/USD. The overwhelming majority of analysts (75%) with the support of graphical analysis and indicators on D1, speak about the sideways movement of the pair within the limits of the previous week - from 1.3000 to 1.3270. A third of the oscillators on H4 agree with this scenario, signaling the pair is oversold. As for the remaining indicators, they side with those 25% of experts who expect the continuation of the downtrend, believing that the pair will first fall to support 1.2950, and then even lower - to the horizon 1.2810;


- the D1 chart clearly shows that the USD/JPY is once again descending from the upper border of the mid-term side corridor (114.50) to its lower border in the zone 108.10-108.80. And to reach it, the pair must go about 200 points to the south. That is why almost 80% of experts side with the bears. The remaining 20% of analysts, with the support of graphical analysis on H4, do not exclude a correction upwards, as a result of which the pair can rise to the zone of 111.30-111.75;


- Bearish sentiment prevails in the forecasts for USD/CHF as well. 65% of experts, supported by graphical analysis on D1 and a quarter of oscillators, expect the pair to fall to the level of 0.9600, and then another 100 points lower. An alternative point of view is represented by 35% of analysts and the overwhelming majority of indicators, according to which the pair will be able to gain a foothold above the 0.9765 mark, then rush to resistance 0.9900.


Roman Butko, NordFX


Notice: These materials should not be deemed a recommendation for investment or guidance for working on financial markets: they are for informative purposes only. Trading on financial markets is risky and can lead to a loss of money deposited.


#eurusd, #gbpusd, #usdjpy, # forex, # forex_forecast, #forex signals, # binary_options

https://nordfx.com/
 

Julia NordFX

Broker Representative
Forex Forecast for EURUSD, GBPUSD, USDJPY and USDCHF for August 14 - 18, 2017


First, a review of last week’s forecast:


- EUR/USD. It was not possible to have a more or less homogeneous forecast for this pair in the previous week. Whilst most experts looked to the north, graphical analysis unambiguously pointed to the south, naming 1.1670 as the nearest support level. Opinions of indicators were also divided: about half of the oscillators and trend indicators on H4 turned red, but on D1, the green continued to dominate. Thus, this discord was justified: at the beginning of the week, the pair grew a little, then it fell, reaching the local bottom at 1.1688, and went up again to the Pivot Point of the last two weeks in the 1.1820-1.1840 zone;


- GBP/USD. The overwhelming majority of analysts (75%), supported by graphical analysis and indicators on D1, spoke about the sideways movement of the pair. Indeed, the pair stayed in a horizontal trend for the whole week, although not exactly in the range where they had expected, the actual range being one level below. Just such a fall constituted what had been predicted by the remaining 25% of experts: the pair first descended to the horizon 1.2950 and only then moved to the east;


- The main forecast for USD/JPY claimed that the pair should go southwards about 200 points and reach the lower boundary of the mid-term side corridor in the 108.10-108.80 zone. This forecast turned out to be 100% true, and the pair, having descended exactly 200 points, fixed the week minimum at the level of 108.73;


- The forecast for USD/CHF also fully came true. Recall that 35% of analysts and the vast majority of indicators indicated that the pair would attempt to gain a foothold above the level of 0.9765. On Tuesday, the pair broke through this resistance, after which it fell, just as most experts had predicted, reaching support at 0.9600 by the end of the week's session.


***

As for the forecast for the coming week, summarizing the opinions of analysts from a number of banks and brokerages, as well as forecasts made on the basis of a variety of methods of technical and graphical analysis, we can say the following:


- EUR/USD. Like last week, the views of the majority of experts (65%) are turned to the north. Supported by graphical analysis and 80% of indicators, they expect the pair to grow to 1.1900-1.2000. Only 35% of analysts expect the pair to fall. However, graphical analysis and a number of oscillators on D1 already side with them, they expect the pair to fall to the level of 1.1685, and then 100 points lower;


- GBP/USD. If you combine the opinions of analysts and technical analysis, you can still talk about a sideways trend here. The opinions of experts were divided 45% to 55% in favor of growth. Trend indicators on H4 are weighed at 60% in favour of growth, whilst on D1, they are strictly neutral. Oscillators on H4 are divided as follows: 50% suggest purchasing, 20% suggest selling, 30% are neutral; on D1, as many as 70% recommend selling. As for graphical analysis, on D1, it shows a side channel in the range 1.2890-1.3125.

In the medium term, the picture is somewhat different: here over 65% of experts vote for the fall of the pair to the zone of 1.2590-1.2810;


- USD/JPY. Here, the vast majority of experts (85%) expect that the pair will continue its decline, aiming to reach the low of April 2017 at 108.12, after which it is expected to rebound to the horizon of 110.00. Bearish sentiment is also supported by 100% of the trend indicators. However, a quarter of oscillators on H4 and D1 give signals that the pair is oversold. Also, 15% of analysts and graphical analysis on H4 do not exclude a possible correction.

If we talk about the medium-term analysis, 70% of experts here expect the pair to return to the upper border (114.50) of the side corridor, in which the pair is moving starting from this winter;


- The last pair of our review is USD/CHF. Here, bearish sentiment dominates. 60% of experts, supported by graphical analysis and the overwhelming majority of indicators, expect the pair to fall to the zone of 0.9500-0.9550. As for the alternative point of view, which is expressed by the remaining 40% of analysts, the pair is expected to rise to the resistance at 0.9700, and, in case of its breakdown, by another 70 points. The 10% of oscillators who are giving signals that this pair is oversold can be considered bull supporters.


Roman Butko, NordFX


Notice: These materials should not be deemed a recommendation for investment or guidance for working on financial markets: they are for informative purposes only. Trading on financial markets is risky and can lead to a loss of money deposited.


#eurusd, #gbpusd, #usdjpy, # forex, # forex_forecast, #forex signals, # binary_options

https://nordfx.com/
 

Julia NordFX

Broker Representative
NordFX Clients Get the Opportunity to Trade CryptoCurrencies


Dear Clients! We are glad to offer you one more opportunity to make profit in the financial markets. The list of trading instruments that we offer has been enriched with three cryptocurrency pairs, BTCUSD, LTCUSD and ETHUSD, which are traded at the special CRYPTO account.


Even though such an instrument as virtual digital currencies has appeared quite recently, it is rapidly gaining popularity among traders. This is due, in the first place, to their unusually high volatility and, as a result, the potential profitability of transactions. Suffice to say that eight years ago, 1 Bitcoin was quoted at $ 0.001, and in August 2017, it exceeded $ 4000.


In this respect, it has been decided to expand the line of trading accounts, adding a new CRYPTO account, which allows to carry out transactions on the MetaTrader 4 platform with three best-known cryptocurrencies, Bitcoin (BTC), Litecoin (LTC) and ETHERIUM (ETH).


You can see the trading terms on the account page https://nordfx.com/trading_account_crypto.html. Although they are some of the most competitive in the market, we strongly advise our clients to carefully study specific features of the trade in cryptocurrency pairs, and in case you use expert advisers, to test and configure them thoroughly.
 

Julia NordFX

Broker Representative
Forex Forecast for EURUSD, GBPUSD, USDJPY and USDCHF for August 28 - September 1, 2017


First, a review of last week’s forecast: thanks to this forecast, traders who took into account the main recommendations of experts and technical analysis, could receive a significant profit. So:


- EUR/USD. The basic forecast, which was sounded by the majority of experts (60%) with the support of technical analysis, spoke about the growth of this pair. And it did go north, starting from Monday. Although at first this movement was not very strong and confident, on Friday, August 28, the pair shot up sharply, reaching the height of 1.1940, supported by the speech of the Federal Reserve Head, Janet Yellen, it finished the week at the height of 1.1921 - near the central level of resistance, indicated by analysts;


- Speaking about the behavior of the pair GBP/USD, the majority of experts, supported by the absolute majority of indicators (80%), as well as graphical analysis on D1, voted for its fall to the level of 1.2760. After that, the pair should have changed the trend to an ascending one. This forecast came true by all 100%. By Thursday, the pair had fallen to the level of 1.2772, then it turned and on Friday returned to the values of the beginning of the week;


- As for the USD/JPY, it was expected that the pair would stay in the sideways trend for a while, making fluctuations in the range of 108.80-110.30. With a slight adjustment, this forecast can also be considered absolutely true - the pair spent the whole week moving to the east in the channel 108.63-109.82;


- The analysts didn't make mistakes predicting the behavior of the pair USD/CHF either. Its fall to the level of 0.9500 was expected by 60% of experts and the overwhelming majority (about 85%) of trend indicators and oscillators. As a result, the local bottom was fixed at 0.9550. And although this horizon was 50 points higher than expected, all those traders who took into account this forecast benefited for sure, as the pair's fall for the week was about 100 points.


***

As for the forecast for the coming week, summarizing the opinions of analysts from a number of banks and broker companies, as well as forecasts made on the basis of a variety of methods of technical and graphical analysis, we can say the following:


- EUR/USD. Although a quarter of the oscillators on H4 and D1 are already signaling that the pair is overbought, the bulk of them, supported by 100% of trend indicators and 40% of experts, still insists on continuation of the uptrend. The nearest target in this case is 1.2040, the next one is 100 points higher. As for the bears' supporters, who are the majority among the analysts (60%), they, just like the graphical analysis on D1, expect a correction of the pair. The main support is 1.1780, the next one is 1.1740, and in case of a breakdown, it is 1.1680;


- Speaking of the future of the GBP/USD, about 35% of analysts are determined to buy this pair, 45% are for sale and 20% remain neutral. A similar discord is observed in the indicators as well. Out of the trend ones on H4, 70% are looking to the north, 30% to the south; on D1, the situation is exactly the opposite. Oscillators show the same picture: on H4, 75% are colored green, 25% indicate the pair is overbought, and on D1 90% of the indicators are colored red.

In such a situation, it makes sense to pay attention to the graphical analysis. Both on H4 and D1, its forecasts converge and speak first about the growth of the pair to the area of 1.3000, and then about the reversal of the trend and the fall of the pair first to the level of 1.2810, and in case of a breakdown, to support 1.2750 or another 100 points lower;


- As for USD/JPY, most analysts (70%) still expect the pair to fall to the April 2017 low (108.12). Approximately 90% of the indicators agree with this scenario. The resistance levels are 109.85, 110.60 and 111.00, the support zone is 108.60-108.75;


- The last pair of our review is USD/CHF. It is clear that most of the indicators here look to the south, but already about 20% of the oscillators on H4 and D1 signal that this pair is oversold. 70% of experts and graphical analysis on D1 also speak about its possible growth. The targets are 0.9615, 0.9700 and 0.9765. The support levels are 1.1685, 1.1600 and 1.1475.


- And in conclusion, here are some words about the major events that can seriously affect the indications of technical analysis. Thus, on Wednesday August 30, data on inflation in the UK and the US GDP will be released. Thursday will bring news on unemployment in Germany and the state of the consumer market of the Eurozone, in general. As for September 1, as it happens on the first Friday of each month, the market is expecting the US unemployment data.


Roman Butko, NordFX


Notice: These materials should not be deemed a recommendation for investment or guidance for working on financial markets: they are for informative purposes only. Trading on financial markets is risky and can lead to a loss of money deposited.


#eurusd, #gbpusd, #usdjpy, # forex, # forex_forecast, #forex signals, # binary_options

https://nordfx.com/
 

Julia NordFX

Broker Representative
Forex Forecast for EURUSD, GBPUSD, USDJPY and USDCHF for 04 - 08 September 2017


First, a review of last week’s forecast:


- EUR/USD. Recall that, although a quarter of oscillators were already signaling that this pair had been overbought, the bulk of them, supported by 100% of trend indicators and 40% of experts, insisted that the pair still had enough strength to rise at the very least to 1.2040. This is indeed what it did. On Tuesday, August 29, the pair overcame 1.2000, before rising another 40 points, and then, by inertia, by another 30. Having fixed a maximum at 1.2070, it turned and rushed downwards, having lost 250 points by the last day of summer. The pair completed the first day of autumn at 1.1860;


- As for the future of GBP/USD, the camps of both experts and indicators were full of discord – some were looking northwards, some to the west, and some southwards. In this situation, we advised paying attention to the readings of graphical analysis. This advice turned out to be correct. Both on H4 and D1, its forecasts predicted an initial growth of the pair to the zone of 1.3000, followed by a reversal and a fall. This is what happened. By Tuesday, the pair had risen by almost 100 points and, after failing to reach the coveted mark, it descended. Having fixed the local bottom at 1.2850, it took another leap upwards, coming close to the goal on Friday, when it reached 1.2995. It then rolled back to the lower boundary of the 1.2950-1.3000 range;


- The forecast for USD/JPY was very brief last week. It had been noted that the majority of analysts (70%), supported by 90% of the indicators, expected the pair to fall to the lows of April 2017 at 108.12. The pair obeyed this order, if not by 100%, then by 95%, having descended to 108.26. After that, like a spring, it quickly straightened up and, having overcome 240 points, conquered the height of 110.66 on August 31;


- USD/CHF. 70% of experts, graphical analysis on D1 and about 20% of oscillators spoke about the possible growth of this pair. It was not ruled out that, before moving northwards, it could drop to the support at 0.9430. That's exactly what happened: first the pair declined by 150 points, and then, pushing away from 0.9426, it rose, ending the five-day period in the long-term support/resistance zone near 0.9650.


***

As for the forecast for the coming week, summarizing the opinions of analysts from a number of banks and brokerages, as well as forecasts made on the basis of a variety of methods of technical and graphical analysis, we can say the following:


- EUR/USD. It is very difficult to give a forecast for this pair, as the opinions of analysts are divided equally, split 50%/50%. The same can be said about the indicators. The market does not expect any surprises from the ECB rate decision or from the comments of its leaders on Thursday, September 7. Therefore, focusing on the readings of graphical analysis on H4 and D1, one can expect this pair to continue its uptrend, which began as early as this January. The main support is around 111.60. Resistance is at the levels of 1.2000 and 1.2070, with the ultimate target being1.2150.

As for a longer-term forecast, almost 75% of analysts believe that the dollar will be able to regain some of its positions in the coming months, bringing the pair closer to 1.1600. Nevertheless, it is very difficult to make any concrete predictions whilst President Trump resides in the White House;


- Graphical analysis on H4 indicates a continuation of the uptrend for the pair GBP/USD. 45% of analysts and 80% of indicators agree with this. The nearest target is 1.3060, whilst the next target is 1.3115.

An alternative point of view is represented by 55% of experts and 20% of oscillators, who indicate that the pair is overbought. Graphical analysis on D1 agrees with them. According to its readings, the pair will drop first to the support of 1.2775, and only then, having beaten off from it, will depart to the height of 1.3060. In case of a break through 1.2775, the next support is 100 points lower;


- As predicted, USD/JPY continues the cyclical wave movement in the medium-term side channel in the range of 108.12-114.50. Last week, having fixed a minimum, the pair returned to the lower border of the Pivot-zone of the channel at the level of 110.25. At the same time, 55% of experts claim that before finally turning northwards, the pair will once again try to test the bottom of the channel and descend to at least 108.80;


- The last pair of our review is the USD/CHF. Here, most analysts (about 60%) expect that it will again fall to the minimum of August 29, at 0.9426. This development is supported by graphical analysis and more than half of the oscillators on D1, the readings of which indicate that this pair is overbought. The main resistance is in the 0.9700-0.9725 zone; the next one is at 0.9770.


Roman Butko, NordFX


Notice: These materials should not be deemed a recommendation for investment or guidance for working on financial markets: they are for informative purposes only. Trading on financial markets is risky and can lead to a loss of money deposited.


#eurusd, #gbpusd, #usdjpy, # forex, # forex_forecast, #forex signals, # binary_options

https://nordfx.com/
 
Forex Forecast for EURUSD, GBPUSD, USDJPY and USDCHF for October 16 - 20, 2017

First, a review of last week’s forecast:

- Recall that an overwhelming majority of experts expected a minor strengthening of the dollar. According to their forecasts, EUR/USD would fall to support 1.1660. This did not happen, however, and the minimum of the week was fixed 60 points higher, at the level of 1.1720. The forecast which was given by graphical analysis, supported by indicators on H4 and only 15% of analysts, turned out to be correct. According to this scenario, the pair was expecting a trend reversal and a move to the north, first to resistance 1.1835, and in the event of its breakdown, even higher, to 1.2035. This scenario was indeed the one that played out; however, the pair was unable to settle above the aforementioned resistance and completed the week near 1.1820;

- Speaking about the future of GBP/USD, 45% of analysts assured that the pair would be unable to break through the strong medium-term support in the 1.3000-1.3045 zone and, like EUR/USD, it would go up. About a third of the oscillators on H4 and D1 which signaled that the pair was oversold, agreed with this. The height 1.3250 was named as the final goal, which the pair reached in the first half of Thursday, after which it collapsed 140 points down. However, the bears’ joy was premature, and the bulls quickly won back losses. As a result, the pair met the weekend at the level of 1.3282;

- One of the scenarios, supported by a third of experts and most of the indicators on H4, suggested that before continuing northward, USD/JPY would test the local bottom in the 111.75-112.00 vicinity. This is what happened: the pair lost about 80 points over the course of the week and froze at around 111.83;

- USD/CHF. The readings of most indicators and graphical analysis indicated that this pair would first try to once again reach the high of the previous week at 0.9835, before returning to the support at 0.9770. It would then try to break it and, if successful, drop to the level of 0.9685. These actions did all occur, although the pair’s movement was somewhat less volatile than expected: at first the pair rose to the level of 0.9806, then returned to support 0.9770, broke it and found the local bottom at the level of 0.9700. The pair met the end of the week session in the zone of October Pivot Point 0.9745.


As for the forecast for the coming week, summarizing the opinions of analysts from several banks and brokerages, as well as forecasts made on the basis of a variety of methods of technical and graphical analysis, we can say the following:


- EUR/USD. Tensions with North Korea, statements about the US withdrawal from the nuclear agreement with Iran, fighting in Syria, the possible rise in oil prices, the change in the Fed leadership, the extraordinary EU economic summit: all this and much more makes the economic situation so uncertain that experts are unable to formulate any consensus regarding either the near future or the medium term. 45% of them vote for the growth of the pair, 45% for its fall, and 10% merely shrug their shoulders.
As for the indicators, they repeat the discord of the analysts on H4. But on D1, the situation is more certain: 80% of them are painted green. However, 20% of the oscillators have already turned red, signaling the pair is overbought.
Finally, graphical analysis: summarizing its readings on H4 and D1, it is possible to draw support lines at the levels 1.1750, 1.1685 and 1.1600, and resistance lines at 1.1920 and 1.2030;

- The situation with GBP/USD looks clear relative to EUR/USD, albeit by a small extent. Here, 55% of analysts, as well as graphical analysis on D1, sided with the bears, forecasting the pair’s fall to support 1.3150, and, in the event of its breakdown, 110 points lower: to the level of 1.3040.
The remaining 45% of experts and the overwhelming majority (85%) of the indicators believe that the last week's trend will continue, and the pair will rise at least to the resistance of 1.3450. The next resistance is 1.3600. However, in this case in the beginning of the week a certain downward correction is possible, since a quarter of the oscillators are already in the overbought zone;
1508049188_GBPUSD_16.10.2017.png

- USD/JPY. Here, a quarter of the oscillators on both H4 and D1 indicate that this pair is oversold. This is confirmed by the opinion of most experts that the pair is on the way to the upper boundary of the mid-term side channel 108.00-114.50 and should be expected to jump upwards.
However, it is worth considering that the pair is in the Pivot Point zone of this channel now, and therefore can still move along this line for a while, oscillating in the range of 110.65-112.20;

- And, finally, the last pair of our review: USD/CHF. Graphical analysis, trend indicators and oscillators have taken a neutral position. A slight bullish overweight can only be noticed in the readings of graphical analysis on H4, according to which the pair is striving to the 0.9800-0.9835 area.
As far as experts are concerned, 75% of them vote for the fall of the pair. The support levels are at 0.9700, 0.9670 and 0.9560.

Roman Butko, NordFX


Notice: These materials should not be deemed a recommendation for investment or guidance for working on financial markets: they are for informative purposes only. Trading on financial markets is risky and can lead to a loss of money deposited.


#eurusd #gbpusd #usdjpy #usdchf #forex #forex_example #signals forex #cryptocurrencies, #bitcoin
 
Forex Forecast for EURUSD, GBPUSD, USDJPY and USDCHF for October 23 - 27, 2017

First, a review of last week’s forecast:

- Last week, we were unwilling to give any forecast for EUR/USD pair. Our reluctance proved to be well-founded. Recall that there was a complete discord both among experts and among indicators: some were looking to the north, some south, and some were simply shrugging shoulders, unable to predict anything. The pair seemed to feel it: it first went down, then up, then down again ... As a result, it did not opt for either direction, and finished the five-day period near 1.1780, the Pivot level, around which it has been gravitating for four weeks;

- Speaking about the future of the GBP/USD, 55% of analysts, along with graphic analysis on D1, sided with the bears, forecasting that the pair would fall to the support at 1.3150, and, in the event of a breakdown, 110 points lower. This is what happened: starting on Monday, the pair began to lose point after point, reaching the level of 1.3150 on Wednesday. Then it made several attempts to break through this level, and managed to reach the1.3085 mark on Friday. However, the forces of the bears dried up, and by the end of the five-day period the bulls managed to win 100 points, thereby rising to 1.3185;

- USD/JPY. The forecast for this pair also turned out to be absolutely correct. Supported by the oscillators, the experts agreed that this pair was on the way to the upper boundary of the mid-term lateral channel 108.00-114.50, and that one should expect an upwards spurt. This ended up being just under 200 points; as a result, the pair fixed a weekly maximum at the height of 113.56, failing to reach the final goal by approximately a meager 100 points;

- USD/CHF. Here the bulls were granted a slight advantage only by the readings of graphical analysis on H4, according to whom the pair’s target was the zone 0.9800-0.9835. As for the analysts, only 25% of them voted for the growth of the pair. But it was to these voices that we had to listen, as the pair added about 100 points during the week, completing the weekly session in the zone of 0.9840.


As for the forecast for the coming week, summarizing the opinions of analysts from a number of banks and brokerages, as well as forecasts made on the basis of a variety of methods of technical and graphical analysis, we can say the following:

- EUR/USD. It is worth noting that the expert community has been unable to form a clear opinion on the behavior of this pair for two weeks now. Despite the decision of the US Senate to approve the draft budget for 2018 and allow the implementation of Trump's tax reform, only 50% of analysts voted for the strengthening of the dollar. According to their opponents, even if the dollar goes further up, this growth will be short-lived.
Following the analysts, oscillators and trend indicators on D1 either disagree or simply take a neutral position. And it is only on H4 that they point to a downtrend. As for the graphical analysis, it draws a lateral channel in the range 1.1665-1.1925. The following support is in zone 1.1575.
It should be noted that when moving to the medium-term forecast, the picture changes dramatically, and about 80% of the experts vote for the growth of the pair to the area of 1.2000-1.2100;

- The outlook for GBP/USD is negative. This is the viewpoint that most (55%) analysts still adhere to. The nearest support is in the 1.3000 zone. In addition to experts, 70% of trend indicators and graphical analysis on D1 side with the bears.
As for the bulls, they are supported by the remaining 45% of experts, according to whom the pair may once again try to test the October maximum in the 1.3335 zone;

- Like last week, USD/JPY is once again facing a green light. 65% of analysts, 100% of trend indicators and 75% of oscillators on H4 and D1 believe that the growth of the pair to the upper boundary of the medium-term channel of 108.00-114.50 will be continued. We must not forget, however, that certain corrections are possible along this path. This is what the remaining 25% of the oscillators signal about when indicating that the pair is overbought. And, as practice shows, such signals are often enough to make the pair to descend for a short while. The nearest support is in the 112.00-112.30 vicinity, with the next one being 111.65;
1508652773_USDJPY_23.10.2017.png

- Finally, the last pair of our review: USD/CHF. A quarter of the oscillators on H4 and D1 indicate that this pair is overbought, with 65% of experts looking southwards. Moreover, when moving from the weekly forecast to the monthly one, their number increases to almost 85%. All of them expect the pair to fall first to the horizon of 0.9700, and then by yet another 100 points.
The bull supporters that remain, backed by graphical analysis of H4, believe that the potential for growth of this pair has not yet dried up and it has a chance to rise to 0.9900, or, perhaps, even higher to the landmark level of 1.0000. However, here much will depend on the EUR/USD pair, whose behavior USD/CHF often mirrors.

Roman Butko, NordFX


Notice: These materials should not be deemed a recommendation for investment or guidance for working on financial markets: they are for informative purposes only. Trading on financial markets is risky and can lead to a loss of money deposited.

#eurusd #gbpusd #usdjpy #usdchf #forex #forex_example #signals_forex #cryptocurrencies #bitcoin
 
Forex Forecast for EURUSD, GBPUSD, USDJPY and USDCHF for October 30 - November 3, 2017


First, a review of last week’s forecast:

- As the opinions of analysts were split 50/ 50, we had decided not to give a clear forecast for EUR/USD for the second week in a row. In terms of what happened, despite the bulls having an advantage at the beginning of the week, the bears eventually won. The House of Representatives of the US Congress was on their side this time, allowing the Senate to approve Trump's tax reform by a simple majority. But that's not all: on Thursday, 26 October, the dollar experienced a surge of support from the ECB, which decided to extend the QE quantitative easing program and continue buying bonds until the end of September 2018. All this hit the European currency so strongly, that it lost about 250 points against the dollar in two days.
It would be difficult to suspect that graphical analysis had been aware of the plans of the US Congress and the ECB. It was, nevertheless, graphical analysis that managed to predict the maximum level of the Euro fall,1.1575, with 100% accuracy. As a result, the pair completed the three-month "head-shoulders" figure and froze around the mark of 1.1605;

- GBP/USD. Here the supporters of the bears had a slight advantage: 55% versus 45%. They also won with just a small advantage. During the entire week, the pair was either falling or rising; in the end, it completed the five-day period 70 points lower than it had started;

- The forecast for USD/JPY also turned out to be correct. Despite having difficulty overcoming resistance from its adversary, it nevertheless managed to reach the required point: the upper boundary of the mid-term side channel 108.00-114.50. To be precise, the pair took the height of 114.45, after which a predictable rebound followed, which saw it return to the Pivot Point of the week at the level of 113.70 by the end of Friday;

- One of the scenarios for USD/CHF voiced last week had the pair to rise to a landmark level of 1.0000. And, even though it was supported by just a minority of experts, it turned out to be the correct one. As predicted, the pair was strongly influenced by the behavior of the EUR/USD. Mirroring which, it rose by 200 points.


As for the forecast for the coming week, summarizing the opinions of analysts from a number of banks and brokerages, as well as forecasts made on the basis of a variety of methods of technical and graphical analysis, we can say the following:

- EUR/USD. Experts are once again split equally, being in this position for three weeks now. As for the trend indicators, 90% of them look southward. The picture is quite different among oscillators, almost half of them giving signals that this pair is oversold. Graphical analysis on D1 joins them, according to its readings, the pair expects to return to the October highs in the zone 1.1835-1.1880, and then the rise to September peaks at the level of 1.2000-1.2100. It should be noted that in the medium term, about 70% of analysts vote for the return of the pair to the range 1.1800-1.2100.
As for the upcoming week, among the events that can significantly determine trends is the release of the latest data on the labor market in the United States on Friday, 3 November. The data includes the very important NFP indicator - the number of new jobs created outside the agricultural sector. Last month it had a negative value of minus 33K. Should the NFP increase to 270-300K as expected, the dollar will be strongly boosted. It should be noted that large market participants often make plays on such news in advance, already a few days before their official announcement.
Of course, one should also add to this that, by the end of next week, the next Fed head may be revealed. In the meantime, it is evident that Janet Yellen and Kevin Warsh have been eliminated from the competition;
1509256389_EURUSD_30.10.2017.png

- The forecast for GBP/USD is still mostly negative. This is the view most (60%) of analysts, graphical analysis and 90% of indicators on H4 and D1 adhere to. However, when switching to a larger timeframe (W1), the picture changes, giving cause to speak about a lateral trend with support on the area of 1.3000-1.3020. The next support is 100 points lower. Resistance is at the levels of 1.3225 and 1.3285. The ultimate goal in case of growth is 1.3335.
Thursday, 2 November will be important for the British pound, as a large amount of news from the Bank of England is expected. According to forecasts, the number of votes for raising the interest rate may triple; the rate itself may probably be raised from 0.25% to 0.50%;

- To switch to sports terminology, the odds of the growth of USD/JPY are estimated as 2 to 1. More than 65% of experts believe that, with a base at the support at 113.25, it will once again try to test the upper boundary of the medium-term side channel 108.00-114.50. Graphical analysis on H4 agrees with this.
As for the alternative point of view, its supporters believe that the potential for growth of the pair has already dried up and it will take a breather, dropping for a while into the zone 112.25-113.25;

- And, finally, the USD/CHF. Here, 75% of analysts, with full support of technical analysis, say that the pair will certainly try to gain a foothold above the level of 1.0000. The ultimate target is 1.0100. However, if the dollar starts to lose its positioning against the euro, it will with overwhelming probability also weaken with respect to the Swiss franc, as a result of which the pair may fall into the zone of 0.9750-0.9800.

Roman Butko, NordFX


Notice: These materials should not be deemed a recommendation for investment or guidance for working on financial markets: they are for informative purposes only. Trading on financial markets is risky and can lead to a loss of money deposited.

#eurusd #gbpusd #usdjpy #usdchf #forex #forex_example #signals #forex #cryptocurrencies #bitcoin
 
Forex Forecast for EURUSD for the end of 2017 and for 2018

According to statistics, more than 85% of transactions in financial markets are made with the participation of the US dollar, and about 30%, with the participation of the Euro. So, what do experts expect from the EUR/USD at the end of 2017 and in 2018?


What the Bulls Say

To begin with, of the 80 banks that submitted their forecasts for this pair in June, only 23 predicted its growth to $ 1.15 by the end of this year. And only a few believed that it could reach $ 1.18.

Among the most accurate were the analysts of DZ Bank AG - Germany's second-largest bank, but they did not expect that already in early September, EUR/USD would come close to the height of 1.21.

In total, since December 2016, the pair has added about 17%. Then, however, it went down to 1.16 following the ECB decisions on QE program, but this does not mean a final break in the uptrend. As analysts in DZ Bank AG believe, the Euro has a growth potential until the summer of 2018.


"The growth of the Euro has surpassed many expectations," said John Gordon, a leading analyst at NordFX brokerage company. - For example, the strategy of the Canadian Imperial Bank of Commerce, generally adhering to the bullish forecast, expected that by the end of this year the pair would trade in the $ 1.14 zone, and the mark of $ 1.18 euro would be reached only by the end of 2018. The Bank of America Merill Lynch forecast looked like this: the end of 2017 - 1.15, the end of 2018 - 1.19.

Even more modest forecast has been given by Rand Merchant Bank in summer, it expected the rate to be at the level of $ 1.12 by the middle of next year. About the same growth - up to $ 1.13 was mentioned by Bloomberg in its study as well.

"Now, probably, many will have to reconsider their forecasts, - the NordFX analyst continues. - This is due, in the first place, to the fact that the banking strategists overestimated the centrifugal aspirations in Europe. Political risks here gradually come to naught. Negotiations on Brexit, elections in France and Germany, showed that, despite multiple negative factors, including events in Catalonia, the Eurozone is not threatened by the rapid collapse. On the other hand, the recovery of the European economy is gaining momentum and business activity indices are at long-term highs."


As for the Dollar, it could not strengthen against the Euro and other major competitors in the outgoing year. "We are not tired of repeating that the Fed is no longer a "magic wand" for the dollar, which can strengthen the exchange rate, - say in DZ Bank AG. - The actions of the Fed in general are expected, which means that the "American" has nowhere to draw any strength from. The ECB, on the contrary, is full of surprises."

The dynamics of the US economy in 2017 was weaker than predicted. And this, as noted in HSBC, coupled with the absence of real reforms, announced by Donald Trump, caused an outflow of speculative capital in favor of the Euro.


So, what do the most optimistic forecasts look like as of today?

According to analysts of the Dutch Rabobank, the Euro against the Dollar is now undervalued by about 11%, and, therefore, by mid-2018, the pair EUR/USD may rise to the level of 1.25.

BNP Paribas experts expect more complex dynamics. According to their forecast, before growing by the IV quarter of 2018, to $ 1.23, in the I quarter, the pair should fall to $ 1.15.

But in Societe Generale, they believe that first the Euro will grow to $ 1.20, and only then it will go down.
1509683270_EURUSD_2017-18.png


Bearish fears

"It would be wrong to say that everyone is optimistic about the Euro in the financial world," says John Gordon of NordFX. "Eurosceptics also have strong positions."

Among the main challenges facing the EU is the problem of refugees and illegal migrants from North Africa and the Middle East.


Another problem is the serious economic imbalance that arose because the Euro is not tied to one particular country. As a result, some of the countries of the Eurozone, whose economy is based mostly on agriculture, light industry and tourism, are experiencing financial difficulties. But countries with developed machine building received a major benefit from averaging the rate of the single currency.

The largest beneficiary is Germany. The head of the US National Trade Council, Peter Navarro, even said that the current Euro is a disguised Deutsche mark. To which the head of the European Commission Jean-Claude Juncker replied no less starkly, announcing that he would support any state that would have decided to withdraw from the USA.

Of course, these are just words, but a major trade conflict between the Old and New World is not out of the question, which can also pull the Euro down.


In addition, one can expect one more move from Americans, which can sharply raise the dollar. It follows from the plan published by the US Treasury that in the fourth quarter of this year the US budget plans to increase the national debt and attract a record amount with the help of government bonds - about half a trillion dollars.

Withdrawing such a huge volume of dollar liquidity from the market may increase the demand for this currency from such major banks as Citigroup, Goldman Sachs & Co., Morgan Stanley, Deutsche Bank, etc., which, naturally, will lead to the growth of the dollar.


"Of course, if all the bearish forecasts, starting from trade disagreements with the United States and ending with the continuing intra-European risks, come true," says the NordFX analyst, "the EUR/USD may again head South as it did before. If you remember, back in January, the probability that the Euro and Dollar would come to parity was very high. All waited for the rate $ 1.00. But the apocalyptic predictions regarding the complete collapse of the European Union did not come true, and, having turned around at the mark 1.034, the pair once again went up."


If you try to summarize the opinions of experts from leading banks, by the end of this year the pair is likely to move in the side channel 1.150-1.210. But in the event that, thanks to the actions of the Treasury and the US Fed, the Dollar still goes up, the next strong support for the pair will be the level of $ 1.110.


Notice: These materials should not be deemed a recommendation for investment or guidance for working on financial markets: they are for informative purposes only. Trading on financial markets is risky and can lead to a loss of money deposited.

#eurusd #forex #forex_example #signals #forex #cryptocurrencies #bitcoin
 
NordFX is Recognized as the Most Reliable Broker of the Year Yet Again

1510374170_Small.jpg

Exactly one year ago our company was declared the winner for 2016 in the ‘The Most Reliable Broker’ category according to TheForeXAwards. This year, we were once again named ‘The Most Reliable Broker’ at the ShowFx World finance conference, which was held in Singapore in late October, this time for 2017.

Many leading specialists in the field of trading and investments attended this landmark event as guests. We are sincerely grateful to the Forex community for yet again honoring us with this noteworthy award.

Reliability is more than just one of many criteria for evaluating the work of a broker. It represents the face of a company in which traders entrust not only money, but also their hopes for a better future. That is why the protection and safety of our clients' funds has always been and will always remain the top priority at NordFX.
 
Forex Forecast for EURUSD, GBPUSD, USDJPY and USDCHF for November 13 - 17, 2017


First, a review of last week’s forecast:

- Just this summer, strategists of many large international banks had designated the 2015 and 2016 highs in the zone 1.15-1.16 as momentous for EUR/USD. The past two weeks of November confirmed this: this entire time the pair has been moving east along the horizon 1.1600, and its main fluctuations, aside from rare inconsistencies, were within the boundaries of 1.1575-1.1660. It was in this upper border of the side corridor that the pair completed the weekly session;

- GBP/USD. This pair has been in a horizontal trend within 1.3035-1.3320 for more than a month. As for this past week, it saw the bulls try to win back losses of the first days of November. However, pushing away from the lower border of the channel, they were able to rise only slightly higher than its Pivot Point, finishing close to the level of 1.3200;

- USD/JPY did not bring any surprises. As expected, it once again tried to test the upper boundary of the mid-term lateral channel 108.00-114.50. And, as expected, after having failed, it took a breather and sank to the support of 113.00, drawing out a textbook descending channel on the chart;

- Recall that two weeks ago, 75% of analysts, with full support of technical analysis, said that USD/CHF would certainly try to gain a foothold above 1.0000. This scenario turned out to be 100% true. However, without the support of EUR/USD, the forward momentum of the pair dried up: never reaching the final target of 1.0100, it moved to a lateral movement, ending the five-day period at 0.9960.


As for the forecast for the coming week, summarizing the opinions of analysts from a number of banks and brokerages, as well as forecasts made on the basis of a variety of methods of technical and graphical analysis, we can say the following:

- EUR/USD. An overwhelming majority of experts (65%) vote for the growth of this pair, albeit a small one. In their opinion, having beaten off from strong support / resistance level 1.1665, the pair should go up: first to 1.1725, and then another 100 points higher. Both graphical analysis and about 70% of indicators on H4 agree with this scenario. However, when switching to the D1 timeframe, the picture changes to the opposite - here most of the indicators predict the pair's fall to 1.1555. The following support is in the 1.1475 zone;

- The outlook for GBP/USD is negative: over 60% of analysts and graphical analysis on D1 think so. The nearest support is at 1.3035, and in case of its breakthrough – at 1.2870. An alternative point of view is expressed by 15% of experts and by indicators on D1, but even here a quarter of the oscillators signal the pair is overbought. As for the remaining 25% of analysts, in their opinion, the pair will continue to move in the lateral channel 1.3035-1.3320;

- The forecast for the USD/JPY fluctuates between neutral and negative. 70% of experts and about a half of trend indicators and oscillators vote for a downtrend. 40% of the indicators have taken a neutral position, while only 10% of them light up green. Nevertheless, 30% of analysts side with the bulls. The targets remain the same as previously. For the bulls, it is to try to gain a foothold above the upper boundary of the mid-term side channel, which is 114.50. For the bears, it is to return to the Pivot Point of this channel in the 111.70 zone;
1510414116_USDJPY_13.11.2017.png

- USD/CHF. As often happens, the forecast for this pair mirrors the forecast for the EUR/USD, with this case being no exception. 65% of experts with the support of indicators on H4 predict the pair will fall to support 0.9860. The remaining 35% of analysts disagree with this: according to them the pair will rush again to storm the height of 1.0100 from the very start of the week. As for graphical analysis, it offers an alternative opinion on D1: an initial descent to the level of 0.9860, followed by a rise to 1.0100, and then by lateral movement in this channel.

Roman Butko, NordFX


Notice: These materials should not be deemed a recommendation for investment or guidance for working on financial markets: they are for informative purposes only. Trading on financial markets is risky and can lead to a loss of money deposited.

#eurusd #gbpusd #usdjpy #usdchf #forex #forex_example #signals #forex #cryptocurrencies #bitcoin
 
Status
Not open for further replies.
Top