• The Forex, Binary Options Forum - welcomes you to our Community!

    DigitalCashPalace Forum is dedicated to discussions about Forex, Binary Options, commodities, stocks related.

    Please take a look around, and feel free to .

Market analysis and trade recommendations by FBS

EUR/USD Daily Analytics
14:57 14.11.2017

1510671350-63d0ef4f684e15daa2a144be2cef842e_1200x1200_q90v3.png


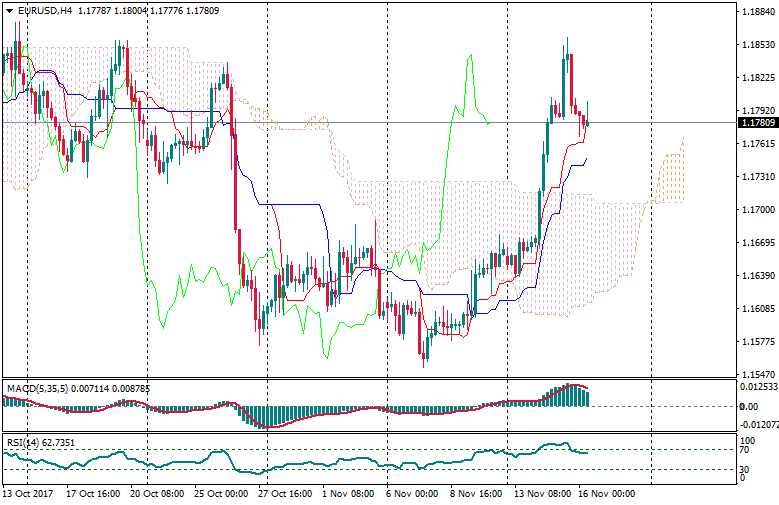
The price has broken all the Moving Averages, but there isn't any reversal pattern so far, cause all the last candles are bullish. So, if the 89 Moving Average acts as support, there'll be an opportunity to have another upward price movement.

1510671350-fb062b7ce83fe92d9259db409d6a76c6_1200x1200_q90v3.png


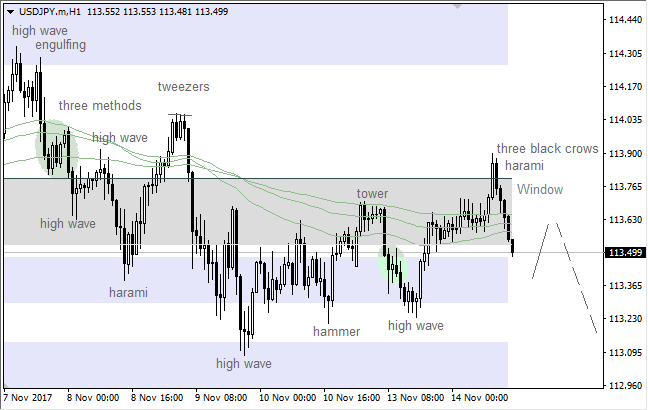
Bulls reached the "Window", but there isn't any reversal pattern for now. However, if any bearish pattern forms in the coming hours, we could have a downward correction.

More:
https://fbs.com/analytics/articles/eur-usd-bulls-reached-the-window-5077
 
USD/JPY Daily Analytics
15:00 14.11.2017

1510671350-8308932f882bb8d3223f907ba60d5edb_1200x1200_q90v3.png


The upper "Window" acted as resistance, so there's a "Shooting Star" pattern, which hasn't been confirmed yet. In this case, we could have a bearish price movement in the short term.

1510671350-90cf0091928d2d5b86518c65062a3221_1200x1200_q90v3.png


We've got bearish patterns such a "Harami" and a "Three Black Crows", which both have been confirmed. So, the market is likely going to continue falling down during the day.

More:
https://fbs.com/analytics/articles/usd-jpy-harami-and-three-black-crows-5078
 
GBP/USD Daily Analytics
06:54 15.11.2017
Recommendation:

BUY 1.3295 SL 1.324 TP 1.3415 TP2 1.352

SELL 1.3045 SL 1.31 TP1 1.289 TP2 1.2715

On the daily chart, GBP/USD keeps consolidating in 1.3045-1.3320 range. A successful test of its lower border will open bears way down to 200% target of AB=CD. On the other hand, a rise above 1.3320 will increase the risks of uptrend’s resumption.

1510728726-b6b56ed02b1869ac79ae2067aff9ca74_1200x1200_q90v3.png


On H1, there’s the senior widening wedge pattern. Taking into account increased volatility in November and formation of the junior pattern, play it on the breaks of resistance at 1.3295 and support at 1.3045.

1510728770-2cf183d9aa99dd882e50bd88c66a58cb_1200x1200_q90v3.png


More:
https://fbs.com/analytics/articles/gbp-usd-got-confused-in-wedges-5091
 
EUR/USD Daily Analytics
09:02 15.11.2017

1510736454-3ee7a5039dadb61beb4a1e0945f70d1d_1200x1200_q90v3.png


Bulls faced with resistance at 1.1787, so the price is consolidating. The main intraday target is the next resistance at 1.1836. If a pullback from this level happens, we could have a bearish correction in the direction of the nearest support at 1.1787.

1510736454-23c566b29f9f314f507cd98bf414e755_1200x1200_q90v3.png


There's a bullish "Flag" pattern, so the market is likely going to continue moving up towards the closest resistance at 1.1804 - 1.1836 during the day. However, if a pullback from these levels arrives little later on, there'll be an opportunity to have a downward correction towards the nearest support at 1.1804 - 1.1787.

More:
https://fbs.com/analytics/articles/eur-usd-bullish-flag-pattern-5096
 
GBP/USD Daily Analytics
09:08 15.11.2017

1510736455-5f48ab39a7c4382e7d92cdf743e72328_1200x1200_q90v3.png


The price is consolidating near the 89 Moving Average. Also, there's a bullish "Thorn" pattern, so the market is likely going to test the next resistance at 1.3182 - 1.3238. If a pullback from these levels happens, we could have a decline towards the closest support at 1.3182 - 1.3150.

1510736454-f829e3708898b75281d9d65a8594061c_1200x1200_q90v3.png


The Moving Averages have acted as support, so there's a "V-Bottom" pattern. In this case, bulls are likely going to reach the nearest resistance at 1.3179 during the day. If we see a pullback from this level, there'll be time for downward correction.

More:
https://fbs.com/analytics/articles/gbp-usd-moving-averages-acted-as-support-5097
 
EUR/USD Daily Analytics
12:35 15.11.2017

1510749246-23cf56f4969d00fbc63df8fbda452644_1200x1200_q90v3.png


There's a bullish "Three Methods" pattern, so the price is likely going to test the nearest resistance. If a pullback from this level happens little later on, there'll be an opportunity to have a bearish correction.

1510749246-b3a25031b3df84cbe591f5e4a14d6bf4_1200x1200_q90v3.png


We've got a bearish "Doji", which has been formed at the last local high. So, the lower "Window" is likely going to act as support in the coming hours. If a pullback from this level arrives afterwards, we could have another bullish rally.

More:
https://fbs.com/analytics/articles/eur-usd-bearish-doji-5099
 
Last edited:
USD/JPY Daily Analytics
12:39 15.11.2017

1510749246-1936848ed957f7972e3be92d650a48bc_1200x1200_q90v3.png


The lower "Window" has acted as support, but there isn't any bullish pattern so far. However, we could have a local upward correction, but bears are likely going to continue to push the price even lower afterwards.

1510749246-c2b59e9dbcaa4691c909344e6d159e11_1200x1200_q90v3.png


The price is still declining, but there's a bullish "Hammer" at the local low. Meanwhile, this pattern hasn't been confirmed yet, so there's an option to have just a local correction. Therefore, we're likely going to have another decline pretty soon.

More:
https://fbs.com/analytics/articles/usd-jpy-window-acted-as-support-5100
 
EUR/USD Daily Analytics
14:21 15.11.2017

1510755605-673d367e866a6a2caef0bd5fd7542ef7_1200x1200_q90v3.png


The market couldn't fixate below 8/8 MM Level, so there's developing wave 5 of (C). Previously, we had an extension in wave 3. Therefore, the last high is likely going to be broken soon.

1510755606-310b6deb7d2e160581e244559fc07ab3_1200x1200_q90v3.png


Wave 4 took the form of a zigzag, which led to the current upward price movement. The main intraday target for wave is 7/8 MM Level, which could be a departure point for wave [ii] of 5.

More:
https://fbs.com/analytics/articles/eur-usd-price-couldnt-fixate-below-8-8-mm-level-5102
 
TRADING PLAN FOR NOVEMBER 16
14:23 15.11.2017
The US dollar index (DXY) declined below 93.50 on Wednesday. The USD was pressured by the decline of the US Treasury yields. American data came out mixed on Wednesday: there was a slight increase in core CPI growth rate, but wages remained soft. Next support for DXY lies at 93.05 (October 19 low). The US will release unemployment claims and Philly Fed manufacturing index at 15:30 MT time and industrial production at 04:15 MT time on Thursday.

1510755470-dcdc5e817cbccf2a99a3edc3ebb67baf_1200x1200_q90v3.png


EUR/USD rose above 1.1800 for the first time in 3 weeks. Demand for the euro rose as investors resumed buying European equities and the region’s economic figures remain strong. Resistance is at October high of 1.1880 and 1.1910.

1510756985-ece6c3cfd6736c88dad910dc12d69721_1200x1200_q90v3.png


GBP/USD is hesitating around 1.3170 after the release of the UK labor market figures. Wage growth exceeded forecast a bit, although the inactivity rate – a number of people not working or seeking job – rose by most in nearly 8 weeks. The release of retail sales on Thursday is the next important event in British economic calendar at 11:30 MT time. In addition, the market will await comments from the Bank of England’s governor Carney during the day. On the upside, the pair’s limited by resistance line from September highs at 1.3210. Support is in 1.3090 area (support line since February) ahead of 1.3000 (psychological level).

1510755530-19dda06215037e098a5fb4cc5581889f_1200x1200_q90v3.png


AUD/USD fell as Australian wage price index disappointed. The Aussie found support at 0.7575 (long-term support line). Attempts to recover will face resistance at 0.7625 (previous support), 0.7650. On Thursday, Australia will release labor market figures at 02:30 MT time.

1510755693-875612112b44805221d72d28a5294877_1200x1200_q90v3.png


More:
https://fbs.com/analytics/articles/trading-plan-for-november-16-5103
 
EUR/JPY Daily Analytics
07:33 16.11.2017
Recommendation:

BUY 133.65

SL 133.1

TP1 134.65 TP2 136

On the daily chart, EUR/JPY reached the targets of “Wolfe waves” pattern. A break of diagonal resistance at 2-4 increased risks of an uptrend’s resumption. To reach targets at 161.8% and 224% of AB=CD the pair should renew November high.

1510817510-151f939c6df1fdb4a28b3d5785d898f1_1200x1200_q90v3.png


On H1, EUR/JPY formed “Wolfe waves” and “Deep Shark”. Correction to 23.6%, 38.2% and 50% of the wave CD are usually used for forming long positions as the Shark is transforming into 5-0.

1510817525-b35d7fb0c22de42ad09055593ba2f9a4_1200x1200_q90v3.png


More:
https://fbs.com/analytics/articles/eur-jpy-euro-is-resuming-its-trend-5115
 
Last edited:
EUR/USD Daily Analytics
07:40 16.11.2017
Technical levels: support – 1.1770; resistance – 1.1850.

Trade recommendations:

Buy — 1.1790; SL — 1.1770; TP1 — 1.1850; TP2 – 1.1880
Reason: expanding bullish Ichimoku Cloud with rising Senkou Span A; a golden cross of Tenkan-sen and Kijun-sen with rising lines; the prices are made a new highs and corrected to the support of Tenkan-sen.

1510817991-5974574d0f06c411e972e24d898d2405_1200x1200_q90v3.png


More:
https://fbs.com/analytics/articles/eur-usd-euro-made-new-highs-5116
 
GBP/USD: POUND CAN’T BREAKING SSB’S RESISTANCE
07:41 16.11.2017
Technical levels: support – 1.3110; resistance – 1.3180.

Trade recommendations:

Sell — 1.3100; SL — 1.3120; TP1 — 1.3050; TP2 — 1.3010.
Buy — 1.3150; SL — 1.3130; TP1 — 1.3260; TP2 — 1.3300.
Reason: narrowing bearish Ichimoku Cloud with rising Senkou Span A; a cancelled dead cross of Tenkan-sen and Kijun-sen; the prices are inside of a Cloud and under pressure of SSB’s resistance.

1510817991-5838ef800660551113de2aff99712827_1200x1200_q90v3.png


More:
https://fbs.com/analytics/articles/gbp-usd-pound-can’t-breaking-ssb’s-resistance-5117
 
EUR/USD Daily Analytics
07:55 16.11.2017

1510818849-6feb5bcf5c9747e5b73aeafff63fdce2_1200x1200_q90v3.png


The price faced with resistance at 1.1857, so there's a "V-Top" pattern, which pushed the pair to the nearest support at 1.1767 - 1.1743. If a pullback from this area happens little later on, there'll be an opportunity to have a bullish price movement towards another resistance at 1.1836 - 1.1857.

1510818849-8ebda1479694508c80350c2fc0809117_1200x1200_q90v3.png


There's a "Double Top" pattern, but the market faced with support at 1.1767, so the price is consolidating. In this case, we could have an upward price movement in the direction of another resistance at 1.1804 - 1.1820. However, if a pullback from these levels happens afterwards, there'll be time for a decline towards the closest support at 1.1767 - 1.1742.

More:
https://fbs.com/analytics/articles/eur-usd-double-top-pattern-5120
 
GBP/USD Daily Analytics
07:58 16.11.2017

1510818849-11d3b592c6a3a9ecd1f0918106619ffe_1200x1200_q90v3.png


There's a "Thorn" pattern, so the price is consolidating. The main intraday target is the nearest support at 1.3150 - 1.3109. If a pullback from this area happens little later on, bulls are likely going to reach the next resistance at 1.3182 - 1.3238.

1510818849-3e098385663b390504832838a7943f68_1200x1200_q90v3.png


The price is consolidating under the Moving Averages. Also, there's a "Thorn" pattern, which has been confirmed. Therefore, the pair is likely going to reach the nearest support at 1.3150 - 1.3153. This area could be a departure point for another upward price movement.

More:
https://fbs.com/analytics/articles/gbp-usd-thorn-pattern-5121
 
USD/JPY Daily Analytics
07:59 16.11.2017
Recommendation:

BUY 113.25

SL 112.7

TP1 114.25 TP2 114.8

On the daily chart, USD/JPY broke the lower border of a rising triangle and then retested it. This was a sign that bears attacked. Sellers tested support at 113 and are trying to fix below it. If they succeed, risks of reaching 88.6% target of a “Shark” pattern will increase.

1510819021-3297c54597baddc0779dab87f73568a2_1200x1200_q90v3.png


On H1, USD/JPY is forming “Wolfe waves” pattern. To trigger it the pair needs a convincing test of resistance at 113.25. The inverted “Crab” pattern with a target at 161.8% will be also triggered.

1510819037-1f50b4d918123f905c31c70a9dfda50a_1200x1200_q90v3.png


More:
https://fbs.com/analytics/articles/usd-jpy-bulls-are-catching-wave-5122
 
EUR/USD Daily Analytics
09:56 16.11.2017

1510826079-ac6721bfa70cf881616dd479e616a121_1200x1200_q90v3.png


There's a developing bullish impulse in wave . Previously, we had a zigzag in wave 4, which means we could have another upward rally. If a pullback from 7/8 MM Level happens little later on, there'll be time for a bearish correction.

1510826079-1464f4ffea5b1270663fb2ce9af9dffd_1200x1200_q90v3.png


6/8 MM Level acted as resistance, so wave (iii) has been ended. Currently, the price is declining in wave (iv). If a pullback from the 34 Moving Average happens during the day, bulls are likely going to deliver another upward impulse in wave (v) of .

More:
https://fbs.com/analytics/articles/eur-usd-6-8-mm-level-acted-as-resistance-5127
 
USD/JPY Daily Analytics
12:45 16.11.2017

1510836190-8751f539e2b20dee63b4e080f1fe9d1f_1200x1200_q90v3.png


There's a "Hammer", which has stopped the last bearish rally. Considering yesterday's "Engulfing" pattern, the market is likely going to continue moving up towards the Moving Averages in the short term

1510836190-0836cd8e71cd9b2d5547c751e186b297_1200x1200_q90v3.png


The price has reached the 34 Moving Average, but there isn't any reversal pattern for now. So, bulls are likely going to test the upper "Window", which could be a departure point for a short-term decline.

More:
https://fbs.com/analytics/articles/usd-jpy-hammer-stopped-bearish-rally-5129
 
EUR/USD Daily Analytics
12:48 16.11.2017

1510836190-76c4453b3de7aa8c382cd303460dbbfe_1200x1200_q90v3.png


There're bearish patterns such an "Evening Star" and a "High Wave". So, the price is likely going to test the nearest support. If a pullback from this level happens little later on, we could have another upward price movement.

1510836190-3992765d8b38f0f5984eca7f3c811619_1200x1200_q90v3.png


The last "High Wave" pattern led to the current decline, but there isn't any bullish pattern so far. In this case, the 55 Moving Average is likely going to act as support soon. If a pullback from this line happens, there'll be an opportunity to have a bullish price movement.

More:
https://fbs.com/analytics/articles/eur-usd-high-wave-pattern-5130
 
AUD/USD Daily Analytics
07:34 17.11.2017
Technical levels: support – 0.7480; resistance – 0.7580

Trade recommendations:

Sell — 0.7560; SL — 0.7580; TP1 — 0.7480; TP2 — 0.7440.
Reason: expanding bearish Ichimoku Cloud with falling Senkou Span A and B; an dead cross of Tenkan-sen and Kijun-sen, falling Tenkan-sen and Kijun-sen; the prices are made a new lows and downtrend will continue.

1510904067-42a68b4bfa2f0515dfbaa054e9dbae66_1200x1200_q90v3.png


More:
https://fbs.com/analytics/articles/aud-usd-aussie-going-to-new-lows-5141
 
Top