Murrey Math Lines 25.03.2024 (EURUSD, GBPUSD)
EURUSD, “Euro vs US Dollar”
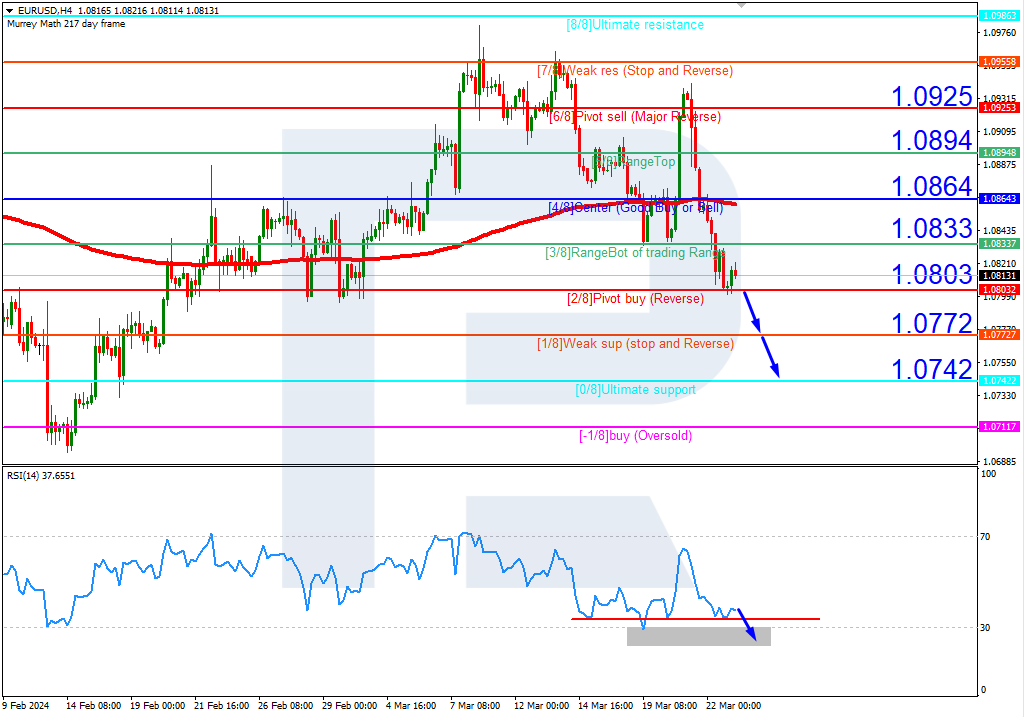
The EURUSD pair stands below the 200-day Moving Average on H4, indicating the prevalence of a downtrend. The RSI is testing the support line. In this situation, a breakout of the 2/8 (1.0803) level is expected, followed by a decline to the support at 0/8 (1.0742). The scenario could be cancelled by rising above 3/8 (1.0833), in which case, the quotes might correct to the resistance at 4/8 (1.0864).
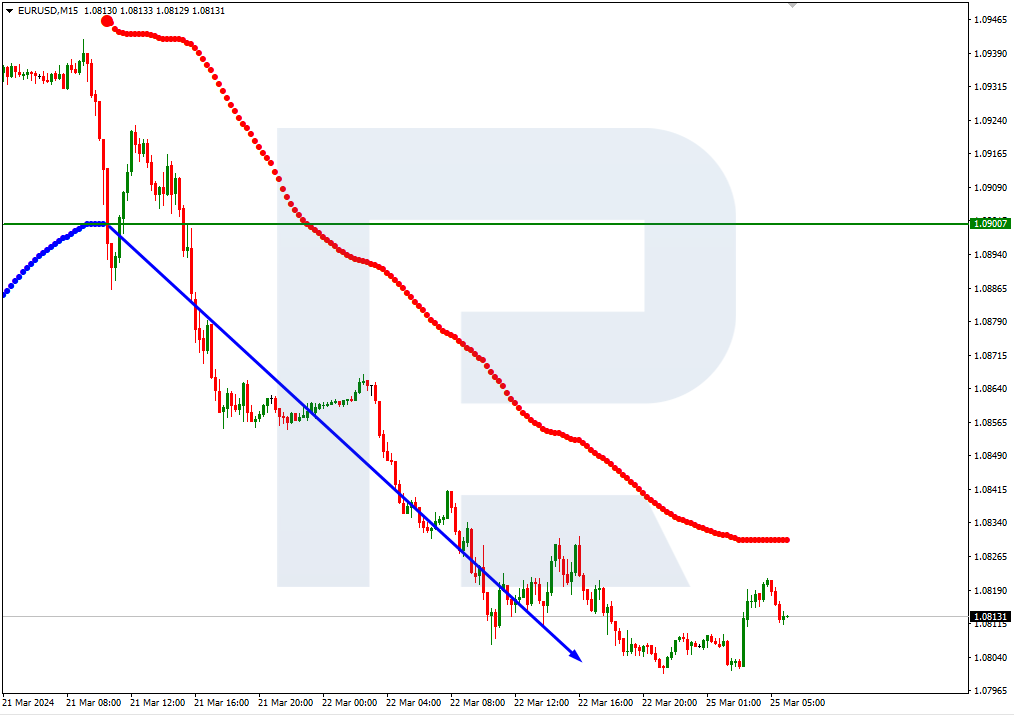
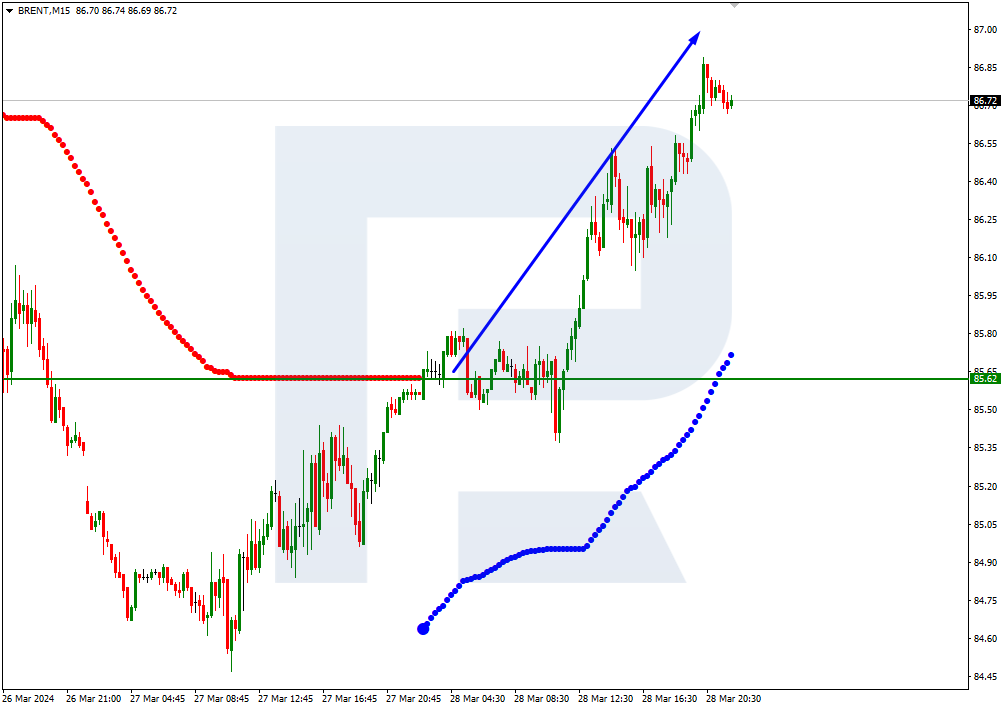
On M15, the lower boundary of the VoltyChannel is broken, which increases the probability of a further price decline.
GBPUSD, “Great Britain Pound vs US Dollar”
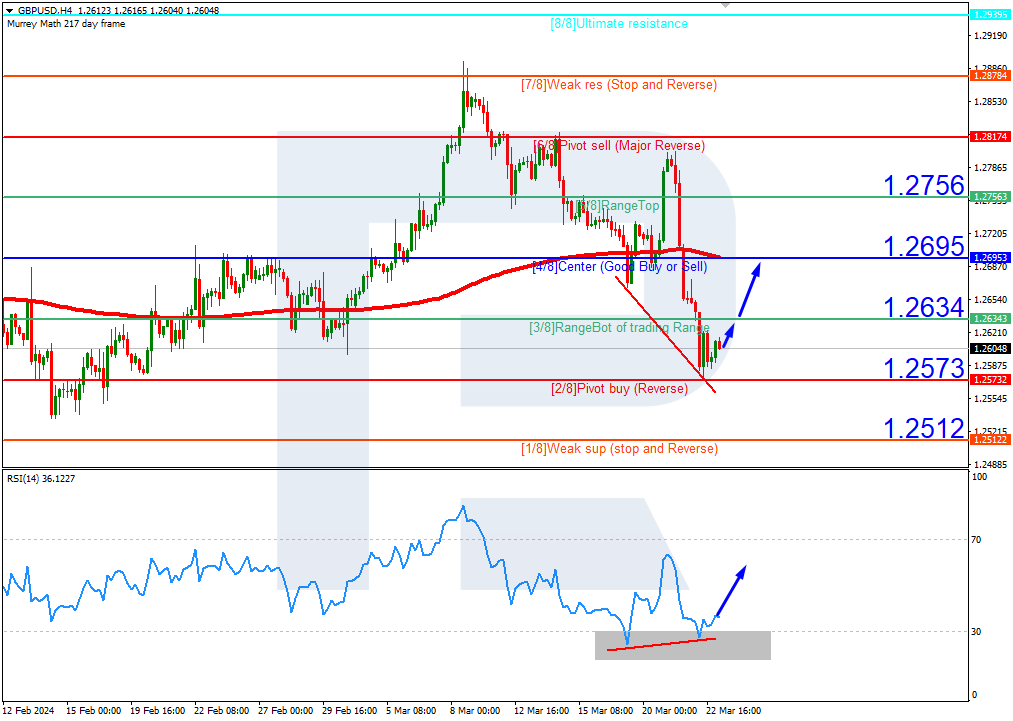
The GBPUSD pair stands below the 200-day Moving Average on H4, indicating the prevalence of a downtrend. However, a convergence has formed on the RSI. As a result, in this situation, the quotes are expected to break the 3/8 (1.2634) level, rising to the resistance at 4/8 (1.2695) afterwards. The scenario might be cancelled by a breakout of 2/8 (1.2573), in which case, the pair could continue falling and drop to the support at 1/8 (1.2512).
Read more -
Murrey Math Lines (EURUSD, GBPUSD)
Attention!
Forecasts presented in this section only reflect the author’s private opinion and should not be considered as guidance for trading. RoboForex bears no responsibility for trading results based on trading recommendations described in these analytical reviews.
Sincerely,
The RoboForex Team